Only a day left to the most contentious U.S. election in recent U.S. history. How will it end and how will markets respond? Historically if the incumbent party wins markets tend to do well. But this is not a normal election and given that one candidate will not accept the results if he loses potential chaos could follow.
The U.S. economy has been the envy of the world but trouble lurks. The October jobs report (chart of the week (page 8)) was well below expectations, however, it contended with hurricanes that impacted data collection. Revisions are very likely. Other numbers have shown strength.
Halloween brought us a scary drop in the markets as they gapped down. Have we topped? Besides the election this week we also have the Fed's interest rate decision (Thursday). The U.S. bond market has seen yields rise despite Fed rate cuts. Will the Fed cut again? 25bp, 50bp or nothing? Consensus seems to be for a 25bp cut.
It wasn't a good week with stock markets mostly down. We note Warren Buffett is sitting on $325 billion in cash. Is he worried about the markets? The energy market was also hit as tensions seemed to have eased in the Mid-East (for the moment) and there is plenty of oil around. Warmer weather is keeping natural gas down.
Precious metals (gold, silver) also fell. But both energy and gold still look higher despite the drop. For example, Secure Energy Services Inc., with services including energy infrastructure, reported increased net income, decreased interest expense, reduced long-term debt, and strong funds flow, pays a dividend, and is held in the Enriched Capital Conservative Growth Strategy.* Warning, if the stock market were to tumble it is not unusual to see energy and gold fall with it.
The weather remains unseasonably warm. Enjoy.
Have a great week.
DC
* Reference to the Enriched Capital Conservative Growth Strategy and its investments, celebrating a 6-year history of strong growth, is added by Margaret Samuel, President, CEO and Portfolio Manager of Enriched Investing Incorporated, who can be reached at 416-203-3028 or msamuel@enrichedinvesting.com
“In the long run we are all dead.”
—John Maynard Keynes, British economist, philosopher, ideas changed macroeconomics and influenced policies of government, founded Keynesian Economics, wrote The General Theory of Employment, Interest and Money (1936); 1883–1946
“The best way to ruin a country is to debauch its currency.”
- Vladamir Lenin, Russian revolutionary, politician, political theorist, founder and first head of the Soviet Russia 1917 and the Soviet Union 1922, leader of the October revolution 1917, leader of the
Communist Party; 1870-1924
“Gold and silver, like other commodities, have an intrinsic value, which is not arbitrary, but is dependent on their scarcity, the quantity of labour bestowed in procuring them, and the value of the capital employed in the mines which produce them.”
—David Ricardo, British political economist, politician, member of Parliament 1819–1823, influential economist, abolitionist, wrote The High Price of Bullion, a Proof of the Depreciation of Bank Notes (1810) and Principles of Political Economy and Taxation (1817); 1772–1823
Gold prices are up this year, the highest since the 1970s. The S&P 500 is up the most since 2007. Both gold and the S&P 500 have made consistent new all-time highs throughout the year. Our understanding is that gold is making its 40th new all-time high this year while the S&P 500 is making its 47th all-time high. At this point, the S&P 500 is running ahead of all years in this century. It has to keep going to become the best year of the century.
Many other indices have followed in the footsteps of the S&P 500. After struggling for a few weeks, the NASDAQ just made a new all-time high (barely) again in 2024. That all this has been led primarily by the MAG7 is beside the point. Election years are usually good years and this year is proving to play to expectations. Since 1896 there have been only six election years (out of 32) that saw declines of 5% or more.
The odds of gold equalling those go-go years of the 1970s are extremely low to nil. The best year was the nearly 135% gain in 1979 when gold rose in a bubble mania to $875. The gold rush started in August 1971 when former president Richard Nixon took the world off the gold standard and Americans could own gold again. For five years during the decade 1971–1980 gold rose over 30%. That’s a record that may never be broken.
Yet here we are with record all-time highs for both the stock market and gold. This is happening against the backdrop of the war between Russia/Ukraine that, more and more, is involving other players, and the ongoing wars in the Middle East that are threatening to expand between Israel and Iran. Add in the extreme divide in the U.S. today as we head into an election and it is surprising that more have not lost faith in governments.
Source: www.conference-board.org
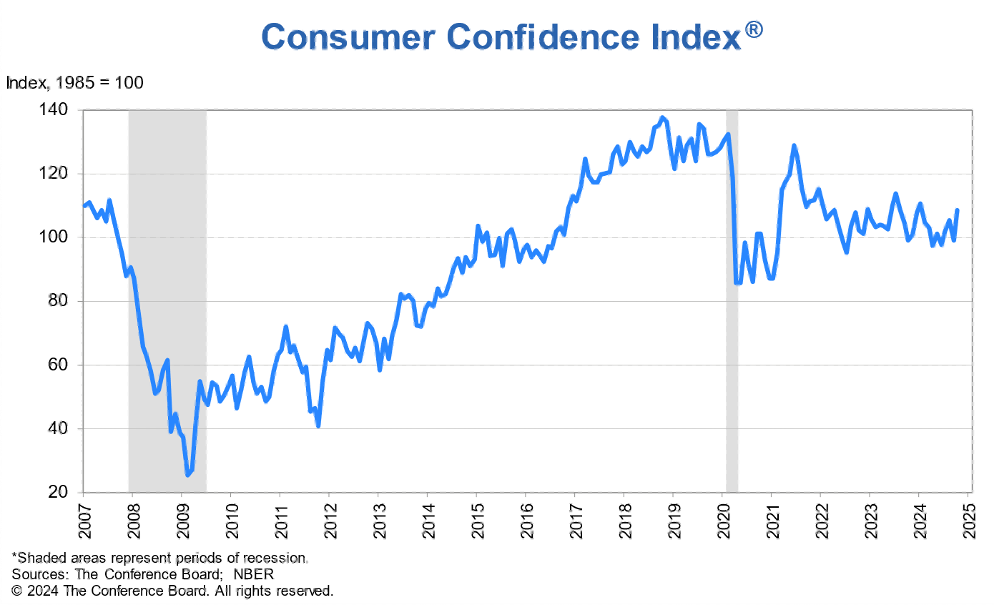
The Conference Board’s (CB) Consumer Confidence Index unexpectedly improved in October at 108.7 (1985=100) from 99.2 in September. The market expected a reading of 98.5. The Conference Board’s Confidence Index differs from the Michigan Consumer Sentiment Index in that the CB’s Index centers on job security and the job market while the Michigan Index centers more on pocketbook issues like gas and food prices. You may have a secure job but you’re unhappy about gas and food prices. While the Michigan Sentiment Index is regularly down at levels that indicate we should be in a recession, the CB Index is off its prepandemic highs but still remains at good levels. Viewing this as a market technician, the CB looks like it made a top, plunged (wave 1 or A), then rebounded and consolidated (wave 2 or B). Wave 3 or C wave down to come.
It's surprising that consumer confidence is remaining so chipper. But then, while unemployment is up, it is not as yet in any danger zone. Job openings have fallen 4.8 million, according to JOLTS openings, since their peak in 2022. That’s almost 40%. Unemployment is up, but at 4.1% it’s still not far off its lows in April 2023 at 3.4%.
This week’s initial claims came in at 216,000 well below the previous week’s 228,000 and the expected 228,000. More importantly, the four-week MA of jobless claims slipped to 236,500, down from 238,750. The four-week MA is a better read of the job situation. We review the October employment numbers in our chart of the week.
Interestingly, fewer are also quitting their jobs to move on elsewhere. The labour market remains surprisingly resilient, although, to be fair, it is a lagging indicator. The U.S. economy appears to be headed to, at best, a soft landing. The latest GDP growth figures showed the U.S. economy grew at a 2.8% rate in Q3. But that is down from 3% in the previous reading and well below the forecasted 3.3%. Problem areas are in commercial real estate, housing, and manufacturing where the latest Chicago PMI fell to 41.6, down from 46.6 and well below expectations of 47.5. Housing starts and sales have been slipping while problems remain in the commercial real estate market, although no major developer has yet to go under. While there are banks experiencing trouble there has been no major bank failure this past year however, two more smaller regional banks failed in 2024.
Despite Fed rate cuts, the bond market, rather than following short rates lower, has instead backed up. As we have noted, after hitting a low of 3.53% in September 2023, the U.S. 10-year note is now at 4.30%. The question becomes: what is the bond market trying to tell us?
Source: www.stockcharts.com
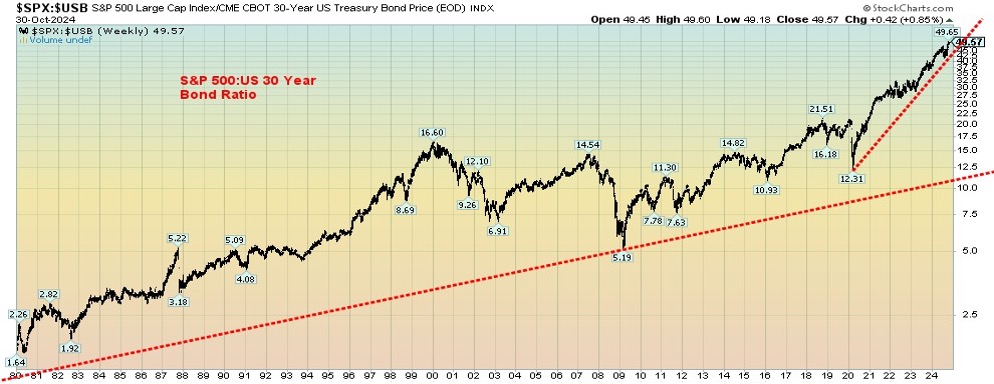
We’ve seen straight-up moves before and they normally don’t end well. This is the S&P 500/U.S. 30-year bond ratio. The last time the ratio rose sharply was during 1993–1999. Then came the dot.com crash and a few years later the 2008 financial crash. During that period bonds were favoured over stocks except 2003-2007. The ratio fell 64% from the high in 2007 to the low in 2009. Mostly since then the ratio has been rising again, favouring the S&P 500 (stocks) over bonds. Following the 2020 pandemic, however, it has gone into the stratosphere. Like our feelings on the stock market, it is ultimately unsustainable. While the trend has not broken down, the message appears to be to sell stocks and buy bonds, although it is probably best to await a signal.
Source: www.stockcharts.com
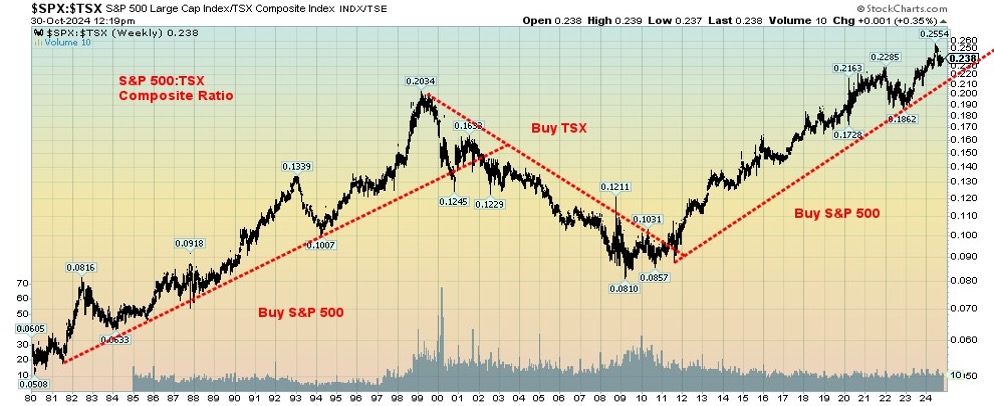
With the SPX/TSX also in a huge uptrend, favouring the SPX over the TSX, it is noteworthy that this run has been very similar to the one from the late 1970s to the high in 1999. After that it shifted to the commodity- dominated TSX. While no sell signals have been seen, we have come off the recent high; however, the uptrend line remains intact. A break of the line and especially a break of that last low at 0.1862 would signal that, going forward, the TSX should outperform the SPX. That in turn is good for commodities.
Source: www.stockcharts.com
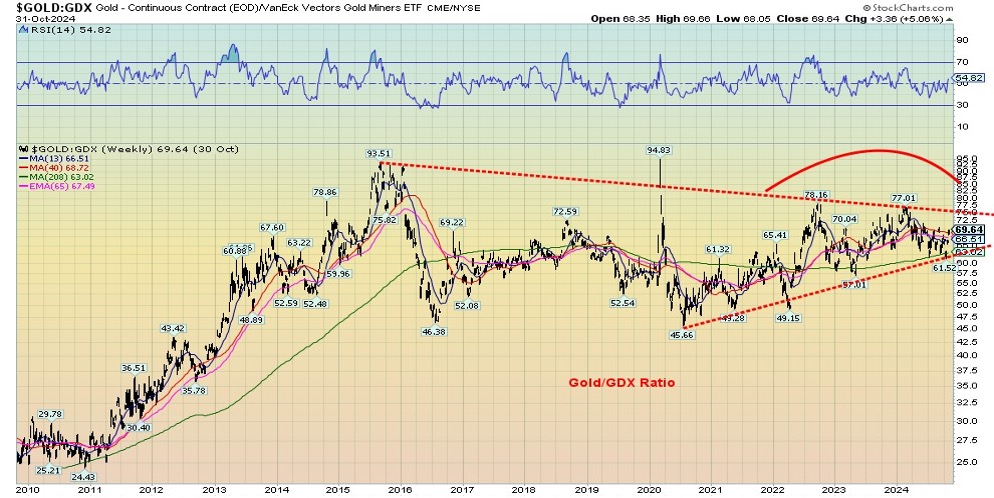
Our chart of gold/GDX ratio shows what appears to be a huge topping pattern. GDX is the VanEck Vectors Gold Miners ETF, consisting of large cap gold stocks. A breakdown would start to signify that the gold stocks should outperform gold itself. This is what we would expect in a bull market, that the stocks lead the way. The recent ratio low at 61.52 is then key to signifying the shift. This chart is not dissimilar to the gold/silver ratio except the topping pattern for the gold/silver ratio has been going on for years, leaving silver fans frustrated. While gold makes fresh all-time highs, silver is nowhere near its nominal highs of 1980 and 2011 near $50. The gold stocks also remain well down from their nominal highs in 2011.
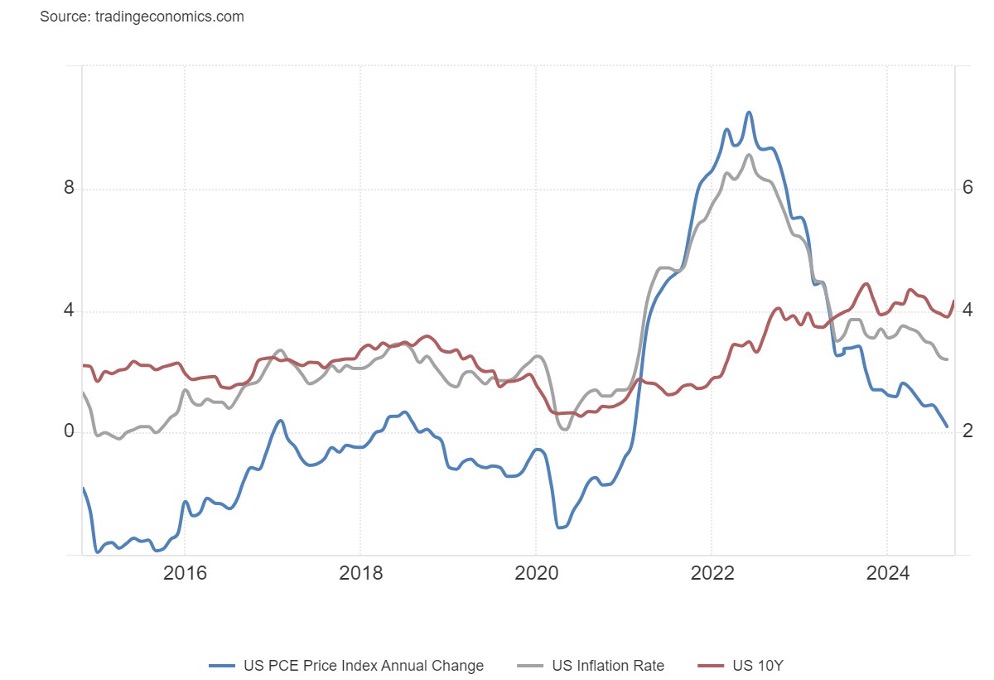
The U.S. economy has been the envy of the world. Inflation is down. The latest PCE prices were up 0.2%, above the projected rise of 0.1%. Year over year (y-o-y) they were up 2.7%, which was as expected. The PCE Prices Index (blue) is now below the rate of inflation (gray) and also the U.S. 10-year treasury note (red). Inflation is falling but long interest rates are rising. Are rising long rates reflecting the strength of the U.S. economy? Or is there a bigger problem? The huge U.S. government debt is a problem. As interest rates rise the cost to service that debt rises too. It is now over $1 trillion just in interest payments.
PCE Price Index, U.S. Inflation Rate, U.S. 10-year Treasury Note 2014–2024
Source: www.tradingeconomics.com, www.bls.gov, www.bea.gov
While the performance of the U.S. economy against the backdrop of all the negatives has been the envy of the world, lurking behind is a monster nobody wants to talk about. The U.S. debt now is just shy of $36 trillion, 122.8% of GDP. As we’ve been saying along with numerous others, this has us headed to a global debt crisis. We seem to be beyond the point of no return. Both candidates for U.S. president will add considerably to the U.S. debt. Any proposed tariffs will only trigger a trade war with reciprocal tariffs. We saw how that worked out in the 1930s.
By 2028, the U.S. debt clock (www.usdebtclock.org) predicts the debt will be over $50 trillion. At 4% interest rates, that is $2 trillion a year just in interest payments. We guess it is: how does one spell unsustainable? Similarly, the U.S. stock market has a current PE ratio of 29.2, with the Shiller PE ratio even higher at 36.5. The all-time high was 44.2 in November 1999. It’s unsustainable—and envy could turn into resentment.
Chart of the week
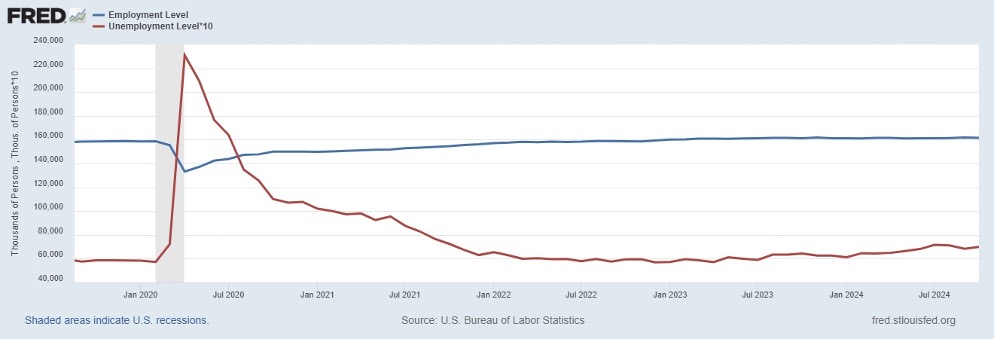
U.S. Employment Level vs. Unemployment Level 2019–2024
Source: www.stlouisfed.org
Well, I guess we could consider that a surprise. The Bureau of Labour Statistics (BLS) reported the U.S. created only 12,000 jobs in October. The unemployment rate (U3) remained unchanged at 4.1% and even the U6 unemployment rate (total unemployed, plus all persons marginally attached to the labour force, plus total employed part-time for economic reasons, as a percent of the civilian labour force plus all persons marginally attached to the labour force) was unchanged at 7.7%. Shadow Stats www.shadowstats.comalso reported its unemployment rate (U6 plus discouraged workers defined out of the labour force in 1994) remained at 26.7% for the third consecutive month.
So, what to make of it? First off, bad weather had a negative impact on the collection of data, particularly in Florida, Georgia, and North/South Carolina—the regions hit the hardest by Helena and Milton. The October reading was not the full month that usually is reported. So, this could be subject to revisions. They just couldn’t sort out all the weather-related issues. But in some ways, it does compare with the 100,000 estimate for nonfarm payrolls. While that was impacted, there was no discernible impact on the U3 and U6 unemployment rate. Interestingly, the two prior periods (August, September) were revised down by 112,000 jobs. That period didn’t have any weather-related events.
Then we have our usual array of numbers for which we can’t explain. The civilian labour force fell by 220,000, yet the working age population grew by 209,000. Interestingly, that was the same number reported as not in the labour force. It rose 209,000. Others fell. The total employment level dropped 368,000, full-time employment fell 164,000, while part-time employment dropped 227,000. It was reported that 512,000 were employed but not working due to the hurricanes, but nonetheless they still collected a paycheck. The unemployment level rose 150,000. All those numbers are a part of the household survey while the non-farm payrolls are the establishment survey. So, the numbers have to all be treated with a grain of salt as revisions could change things.
Regardless, with the numbers pointed down and unemployment pointed up, it heightened expectations that the Fed would cut at least 25bp and even 50bp at its November 6–7 meeting (yes, next week). Bonds rallied as yields fell. Stocks rallied, kicking off the so-called best six months. Gold bounced back but not by much. Then it fell.
Average weekly hours worked remained unchanged at 34.3 hours while average hourly earnings rose 0.4% vs. expectations of 0.3%. The y-o-y average hourly earnings were up 4%, unchanged from September. The average weekly hours worked remained at their multi-year lows.
So, the big question is going to be, what will the Fed do? 25bp, 50bp, or no cut as some are still expecting? Oddly, Trading Economics still expects no cut. They will revisit it in December once things have settled because of the hurricanes. Overall, this was not a great report. But the stock market took it to heart and followed the scary Halloween plunge with a big upward leap. Welcome to volatility.
Markets & Trends % Gains (Losses) Trends
|
|
Close Dec 31/23 |
Close Nov 1, 2024 |
Week |
YTD |
Daily (Short Term) |
Weekly (Intermediate) |
Monthly (Long Term) |
|
Stock Market Indices S&P 500 |
|
|
|
|
|
|
|
|
4,769.83 |
5,728.80 |
(1.40)% |
20.1% |
neutral |
up |
up |
|
|
Dow Jones Industrials |
37,689.54 |
42,052.19 |
(0.2)% |
11.6% |
neutral |
up |
up |
|
Dow Jones Transport NASDAQ |
15,898.85 |
16,351.33 |
1.5% |
2.9% |
up |
up |
up |
|
15,011.35 |
18,239.92 (new highs)* |
(1.5)% |
21.5% |
up (weak) |
up |
up |
|
|
S&P/TSX Composite S&P/TSX Venture (CDNX) |
20,958.54 |
24,255.16 |
(0.9)% |
15.7% |
up (weak) |
up |
up |
|
552.90 |
603.95 |
(2.6)% |
9.2% |
up (weak) |
up |
down (weak) |
|
|
S&P 600 (small) |
1,318.26 |
1,389.31 |
(0.1)% |
5.4% |
up |
up |
up |
|
MSCI World |
2,260.96 |
2,378.06 |
(0.9)% |
5.2% |
down |
up |
up |
|
Bitcoin |
41,987.29 |
69,215.48 |
3.8% |
64.9% |
up |
up |
up |
|
|
|
|
|
|
|
|
|
|
Gold Mining Stock Indices Gold Bugs Index (HUI) TSX Gold Index (TGD)
|
|
|
|
|
|
|
|
|
243.31 |
331.05 |
(4.1)% |
30.4 |
down (weak) |
up |
up |
|
|
284.56 |
377.14 |
(3.6)% |
32.5% |
neutral |
up |
up |
|
|
|
|
|
|
|
|
|
|
|
% |
|
|
|
|
|
|
|
|
U.S. 10-Year Treasury Bond yield |
3.87% |
4.39% |
3.3% |
13.4% |
|
|
|
|
Cdn. 10-Year Bond CGB yield Recession Watch Spreads |
3.11% |
3.31% |
0.9% |
6.4% |
|
|
|
|
|
|
|
|
|
|
|
|
|
U.S. 2-year 10-year Treasury spread Cdn 2-year 10-year CGB spread
|
(0.38)% |
0.17% |
30.8% |
144.7% |
|
|
|
|
(0.78)% |
0.18% |
5.9% |
123.1% |
|
|
|
|
|
|
|
|
|
|
|
|
|
|
Currencies US$ Index Canadian $ Euro |
|
|
|
|
|
|
|
|
101.03 |
104.34 |
flat |
3.3% |
up |
up (weak) |
neutral |
|
|
75.60 |
71.64 (new lows) |
(0.5)% |
(5.2)% |
down |
down |
down |
|
|
110.36 |
108.33 |
0.4% |
(1.8)% |
down |
neutral |
neutral |
|
|
Swiss Franc |
118.84 |
114.80 |
(0.5)% |
(3.4)% |
down |
up (weak) |
up |
|
British Pound Japanese Yen |
127.31 |
129.59 |
(0.7)% |
1.8% |
down |
up (weak) |
up |
|
70.91 |
65.32 |
(0.5)% |
(7.9)% |
down |
down (weak) |
down |
|
|
|
|
|
|
|
|
|
|
|
|
|
|
|
|
|
|
|
|
Precious Metals |
|
|
|
|
|
|
|
|
Gold |
2,071.80 |
2,749.20 (new highs)* |
(0.2)% |
32.7% |
up |
up |
up |
|
Silver |
24.09 |
32.68 |
(3.3)% |
35.7% |
up |
up |
up |
|
Platinum |
1,023.20 |
1,002.90 |
(3.3)% |
(2.0)% |
up |
up |
up |
|
Base Metals |
|
|
|
|
|
|
|
|
|
|
|
|
|
|
|
|
|
PalladiumCopper |
1,140.20 |
1,108.80 |
(7.8)% |
(2.8)% |
up |
up |
down |
|
3.89 |
4.37 |
flat |
12.3% |
neutral |
up (weak) |
up |
|
|
|
|
|
|
|
|
|
|
|
Energy |
|
|
|
|
|
|
|
|
WTI Oil Nat Gas |
71.70 |
69.49 |
(3.2)% |
(3.2)% |
neutral |
down |
down |
|
2.56 |
2.66 |
(13.9)% |
3.9% |
neutral |
up |
down (weak) |
Source: www.stockcharts.com
Note: For an explanation of the trends, see the glossary at the end of this article.
New highs/lows refer to new 52-week highs/lows and, in some cases, all-time highs.
• * New All-Time Highs
Source: www.stockcharts.com
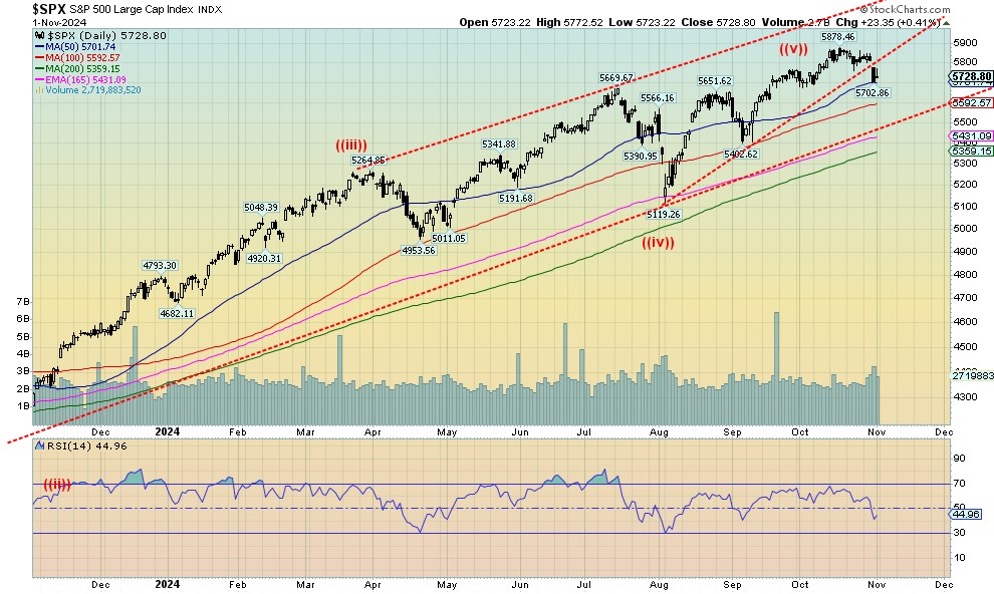
This coming week promises to be a roller coaster, with the election and the Fed meeting. But what may drive markets the most is the extremely contentious election. No one knows what is going to happen, regardless of whether one candidate wins easily or not. At minimum, there could be contentious court cases. At maximum, riots—think January 6 on steroids. That stock markets kept going up against this backdrop is either a miracle or falsely driven as it is by relatively loose monetary policy and oodles of debt. Nonetheless, the S&P 500 (SPX) broke this past week. It gapped down on Thursday. A day we can call the Halloween Day Massacre. Apparently, according to some, $950 billion was wiped out on Thursday. Nothing was spared.
Nonetheless, the SPX closed at the 50-day MA support. It’s still a bit of drop to that next line near 5,500 and a little further to the 200-day MA support near 5,400. A break of 5,400 would be a bigger concern that we are headed for a steeper correction and a bear market.
On the week, the SPX fell 1.4%, the Dow Jones Industrials (DJI) dropped only 0.2%, the Dow Jones Transportations (DJT), spurred on by cheaper oil, rose 1.5%. The NASDAQ fell 1.5% after making new all-time highs, the only one to do so this past week. The S&P 500 Equal Weight Index fell 1.0% while the NYFANG Index fell 0.7%, thanks to a few MAG7 stocks holding up a bit. The S&P 400 (MID) fell a modest 0.2% while the S&P 600 (Small) was down 0.1%. Those two surprisingly held in. Bitcoin was up 3.8%, but after going back over $70,000 it too sold off and closed under that resistance zone.
In Canada, the TSX Composite was down 0.9% while the TSX Venture Exchange (CDNX) fell 2.6%. In the EU, the London FTSE was down 1.0%, the EuroNext was off 1.3%, the Paris CAC 40 was down 1.2%, and the German DAX down 1.1%. In Asia, China’s Shanghai Index (SSEC) fell 0.8%, Japan’s Nikkei Dow (TKN) was off 0.4%, and Hong Kong’s Hang Seng (HSI) fell 0.3%. All in all, not a good week anywhere except for the DJT. Note that’s the Dow Jones Transportations, not the stock DJT Trump Media.
Everywhere we read, the pros are hedging up in front of this week’s election. Smart money getting out? Noteworthy was that Warren Buffett raised some $300 billion in Berkshire Hathaway. Two key ones sold were Apple and Bank of America. The cash position is a good 25% of Berkshire’s value. Is Buffett worried about something we don’t know about?
Volatility has been rising. The VIX is over 20, a level that is unusual when the SPX is not far from all-time highs. Breadth is breaking down. The McClellan Oscillator is in negative territory, despite the high SPX. Bullish Percent indicators are falling. PE ratios, while not at all-time highs, are the highest in few years since the financial crisis and pandemic.
We are sitting in front of an extremely contentious election. The Fed also meets. Wars continue. Some caution is warranted.
Source: www.stockcharts.com
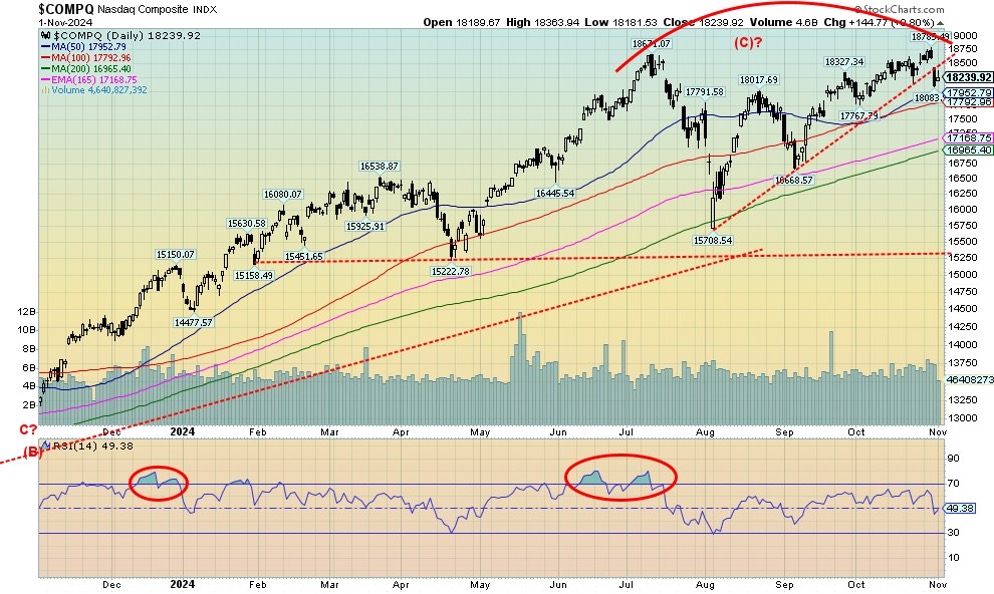
Technically, we can’t say we liked the action on the NASDAQ this past week. Yes, we made new all-time highs, but just barely. On Thursday, the bottom fell out and while we rebounded slightly on Friday the pattern is bearish. The new high day was accompanied by a reversal and lower close but not an outside day lower close. However, we made the new highs, then closed lower on the week by 1.5%. An outside reversal week. That could be interpreted as a key reversal week. The MAG7 stocks were mixed. Tesla fell 7.5%. Musk’s buddy Trump saw his stock DJT fall 21.5% after screaming up over the past week or so. However, Amazon jumped 5.4% and Google gained 3.4%. DJT is not a member of the MAG7 but Tesla is. Outside of the MAG7, Advanced Micro (AMD) fell sharply, off 9.2%. The NY FANG Index that makes up a chunk of the NASDAQ was off only 0.7%, thanks to Amazon and Google to offset Tesla. The next key point is at 17,770. So, if that breaks, we could then fall to 17,200. New highs would end the downside discussion. However, the reality is an outside reversal week with all-time highs, followed by a gap down on Thursday, tells us we may have topped.
Source: www.stockcharts.com
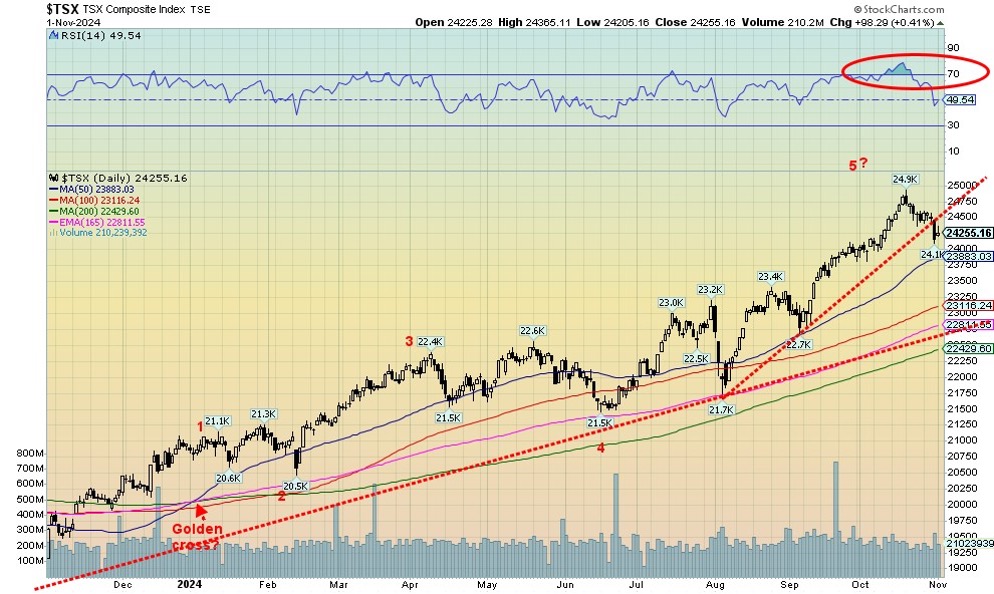
The TSX fell 0.9% this past week while the TSX Venture Exchange (CDNX) was down 2.6%. The CDNX is home to junior mining companies that make up roughly 50% of the index. The TSX broke that trendline up from the August low. Next support is near 23,900, but final better support is down at 22,800. Nine of the 14 sub-indices were down on the week led by Energy (TEN), off 4.2%. Income Trusts (TCM) were down 4.1% and Golds (TGD) were off 3.6%. Of the leaders, Health Care (THC) made 52-week highs, gaining 4.4%. But HC is only a small portion of the TSX. Note the TSX is falling from quite overbought conditions, so a pullback was going to happen no matter what. Like everything else, this week is key with the election and the Fed. New highs would turn this market back up again.
U.S. 10-year Treasury Note, Canada 10-year Bond CGB
Source: www.tradingeconomics.com, www.home.treasury.gov, www.bankofcanada.ca
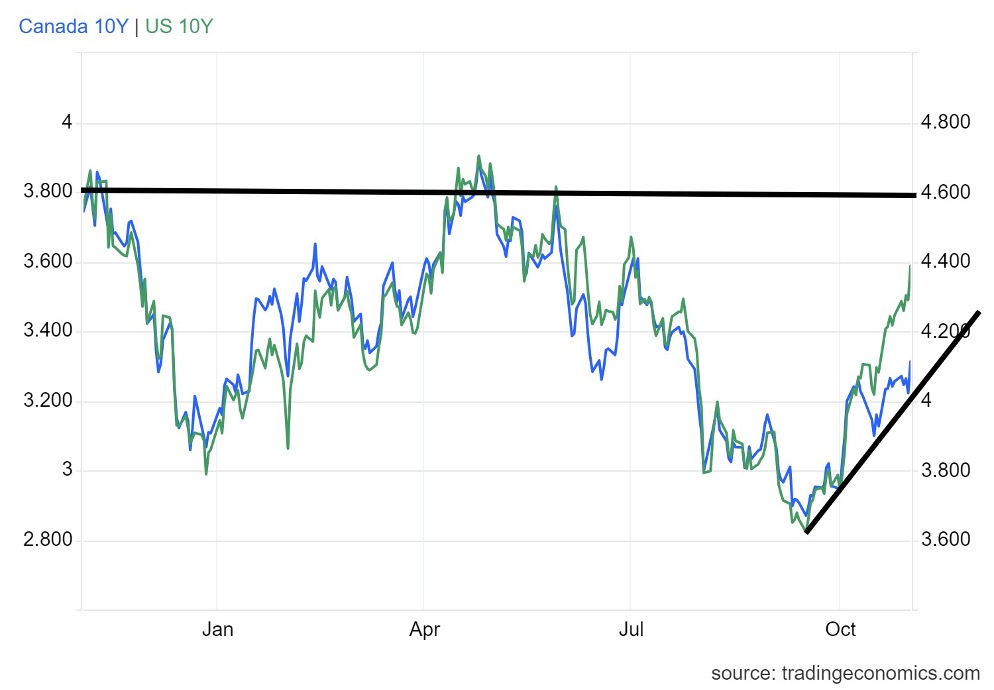
Longer term interest rates keep on rising. With the poor job numbers (with extenuating circumstances and subject to large revisions), interest rates, instead of falling, have been rising. Maybe trillion-dollar interest payments are sparking some of this. Maybe it’s the unsustainable debt and the knowledge that, no matter who is elected, debt is going to continue to rise at a rate predicted to be $3.5 trillion/year over the next four years. Actually, it might be even worse. The U.S. budget deficit at 8% of GDP is unusually high. Both candidates’ proposals will make it worse, particularly Trump’s. Currently at $2.3 trillion, it suggests that if this rate is maintained, we will go up $9 trillion over the next four years. However, the U.S. debt clock (www.usdebtclock.org) suggests it could rise to $50 trillion, a gain of $14 trillion. Economists have also confirmed these numbers. These are based on projections from the Congressional Budget Office (CBO), based on the candidates’ proposals. That’s a lot of debt to be issued when there is already $36 trillion of it. How’s it going to be financed?
The U.S. 10-year rose to 4.39%. Canada was up as well but not as much, rising to 3.31%. The 2–10 spreads widened slightly with the U.S. at 17 bp and Canada at 18 bp. It keeps the recession watch on track. The U.S. economy has been humming compared to others. But trouble lurks beneath and the message from the bond market seems to suggest there is a problem.
Source: www.stockcharts.com
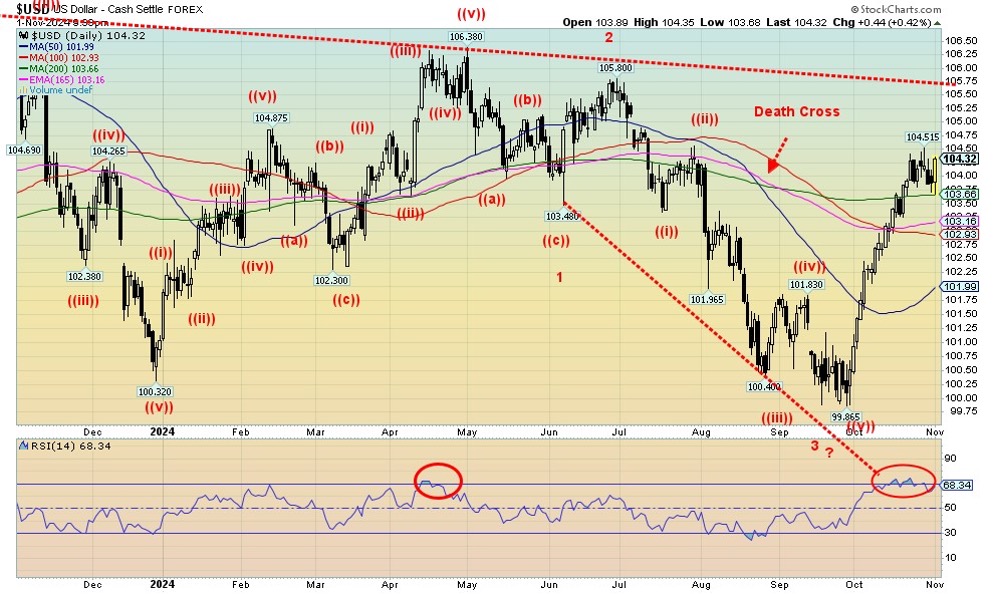
The US$ Index has at least paused over the past week or so. Resistance just above 104 and the huge need to consolidate following a straight-up move plus overbought conditions was badly needed. Whether it proves to be a top is still to be determined. The weak U.S. job numbers on Friday helped, but only momentarily. Friday saw a good up day. On the week, the US$ Index was flat. But other currencies were not. The euro gained about 0.4%. However, the Swiss franc was down 0.5%, the pound sterling off 0.3%, and the Japanese yen down 0.5%. The Cdn$ has been struggling and falling as it too lost 0.5%. The Cdn$ fell to 52-week lows and is now deeply oversold. From these levels it is now becoming a buy. Straight-up moves like that for the US$ Index are not normal or sustainable. The danger comes this week with the contentious election and the Fed meeting. Under 103 we’re probably breaking down.
Source: www.stockcharts.com
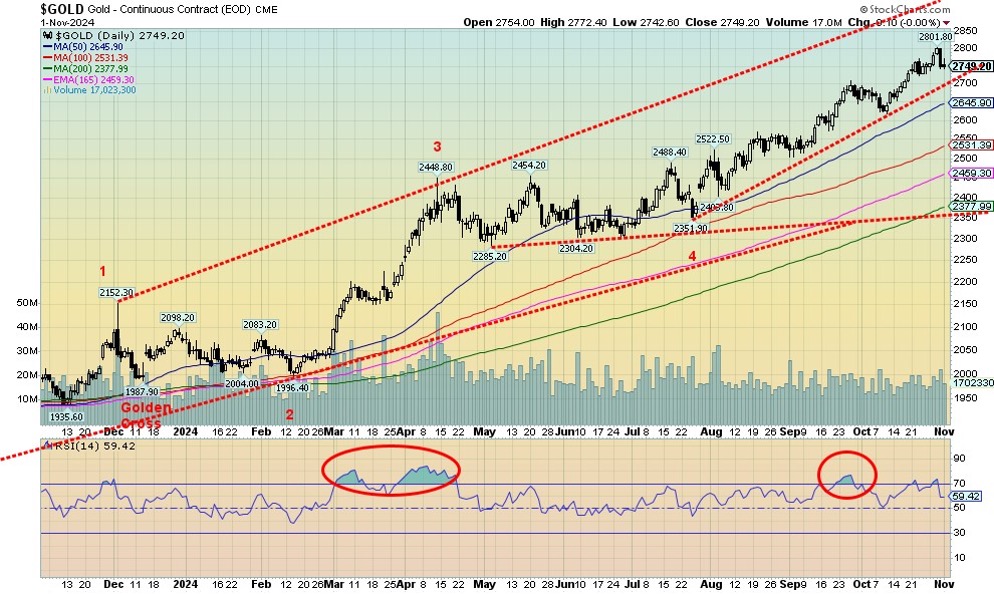
Gold is the safe haven against geopolitical gyrations, domestic political gyrations, and accumulation of massive debt by governments, corporations, and individuals. It is nobody’s liability. It is not necessarily a hedge against inflation or deflation but could turn out to be. It rises when faith is lost in the system and gold becomes the safety valve. And that is real bullion—not gold stocks, not ETFs, mutual funds, or any other way that could hold gold. Bitcoin is not the safe haven. It’s virtual. If there is a fear about gold, it is the fear of government confiscation. It happened before in the 1930s when gold was revalued to $35/ounce. It was at the time a devaluation of the U.S. dollar and a revaluation of gold. But only gold bars, etc. were confiscated, not gold collectible coins. President Nixon ended the gold standard for good in August 1971 when he closed the gold window and the world turned to floating fiat currencies, backed by nothing except a government’s promise to pay—an IOU.
Against this backdrop, gold once again made fresh all-time highs, but then yanked back to a small loss due to some better than expected U.S. economic numbers sparking the US$ Index up. Also, we still have the ongoing turmoil in the Middle East and the extremely contentious U.S. election where one candidate has already declared that if he doesn’t win it was fraudulent. Gold has been rising steadily with periodic pullbacks that are inevitably bought. Yes, we have a breakdown point that would signal a much bigger correction. That comes in initially at $2,700. It could set off a deeper correction, but gold remains a bull as long as we remain over $2,400. It was just a steep correction. We note as well how gold has pulled back every time it became overbought with an RSI over 30 (circles). The RSI only briefly touched over 70 the last couple of weeks so we didn’t circle those.
On the week, gold made all-time highs, then reversed and closed lower by 0.2%. That’s not much so the reversal is not damaging for the longer term. Silver was hit harder, down 3.3%. Platinum fell 3.3% as well. Of the near precious metals, palladium fell 7.8% but copper was flat. The gold stocks were hit as the Gold Bugs Index (HUI) fell 4.1% and the TSX Gold Index (TGD) was off 3.6%. Both remain up over 30% in 2024 as do gold and silver. But palladium and platinum are down on the year, although copper is up a modest 12%. You want to see palladium, platinum, and copper rising as well. It’s the old Dow Theory that the indices (commodities) must confirm each other.
Our targets remain for $3,000 and possibly up to $3,600. This coming week should be filled with drama. No matter what and regardless of the temporary pullback, gold is going higher.
Source: www.stockcharts.com
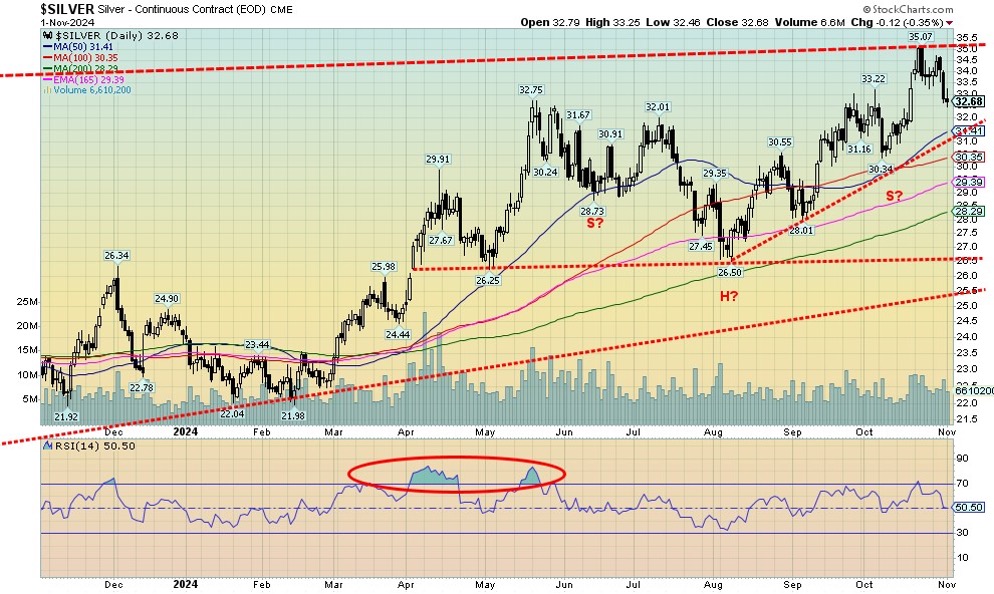
Silver followed gold lower this past week, except it got hit harder. That’s not unusual as we have noted that silver tends to lead both up and down. Silver fell 3.3% this past week to gold’s drop of 0.2%. We are now down 7% from that high seen a week or so ago. But we continue to hold well above the uptrend line from that last low at $26.50 in early August. On the year, silver remains up 35.7%, outpacing gold. But it’s been a back and forth effort as a rise is met by a pullback. Some of it, we know, is nervous nellies selling at the first sign of trouble, especially if they have a profit. That pattern still looks like an awkward head and shoulders bottom and we did break over $33/$33.50 where the neckline would have been. So, is this just the pullback to test the breakout? If we break down under $30.35, we’ll confirm a false breakout. Our targets on the breakout were to be $39/$40. They still can be, but we must hold above $31.50 now. Predictably, volume on the pullback has eased. A breakout further now is new highs above $35.07. A move back above $34.50 would be positive.
Source: www.stockcharts.com
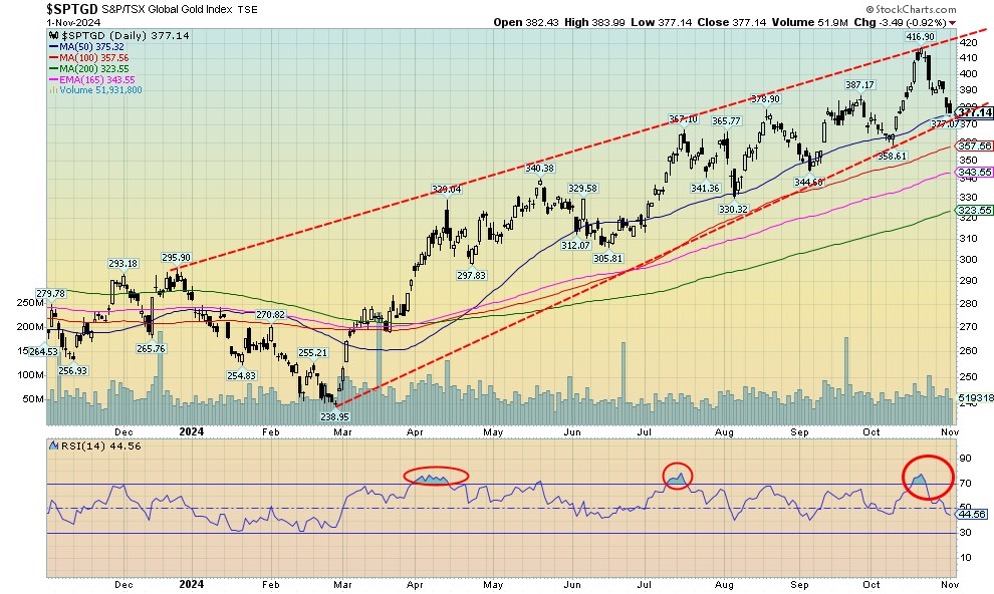
If there is a positive to be taken from the pullback in the gold stocks, it’s that this is the fifth pullback from that low in February 2024. The pullbacks have been 10%, 10%, 9%, 7%, and this time about 10% so far. Each time the pullback saw the RSI dip to 50 or a bit under. The current RSI is 44.6. We are also close to an uptrend line from that February 2024 low. The constant pullbacks indicate strength to us. So far, we see no topping signs. Our expectations remain that once this pullback is finished, we should move higher once again. Grant you, a break under 370 would break the uptrend line and potentially set us up for a further pullback in the 15%–20% range. Support can be seen at 355, 340, and finally 320. For now, it is wait and see through the election and the Fed this coming week. But the trend is up and we would not consider it over until we bust under 320.
Source: www.stockcharts.com
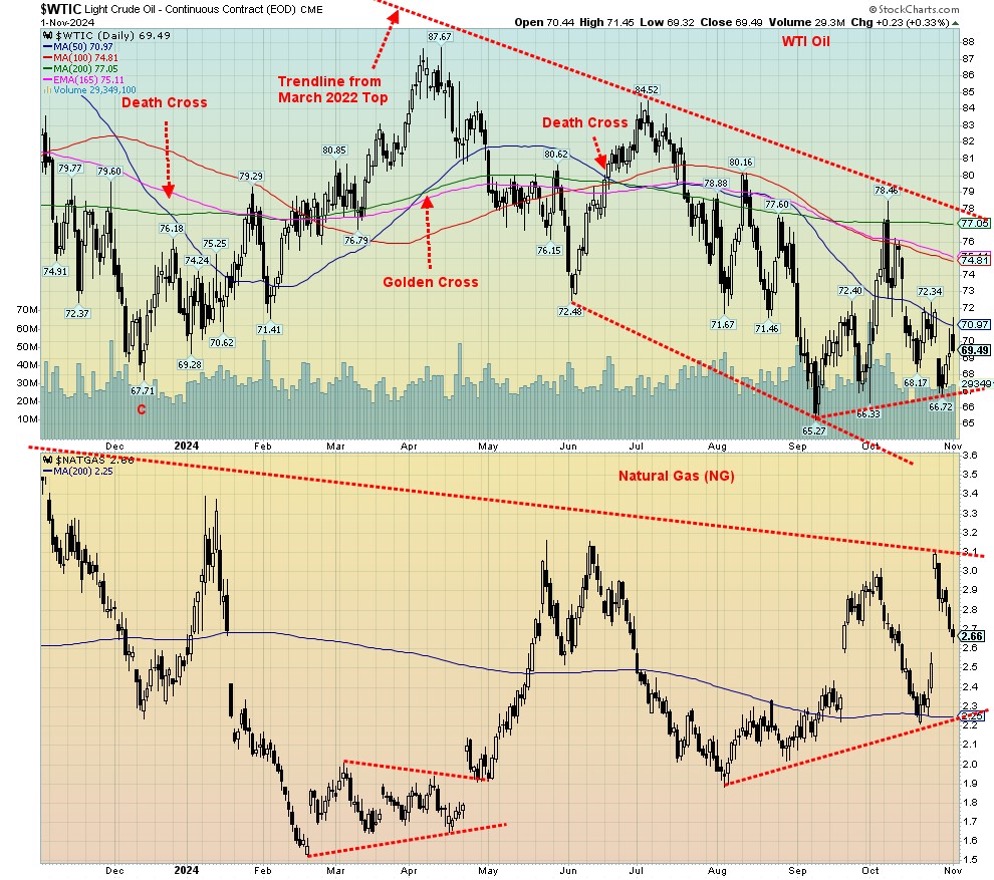
The oil market is in flux. On one hand, the threat of a further outbreak of war between Iran and Israel that could then involve others keeps the market on edge. On the other hand, reduced demand and increased production could keep downward pressure on oil prices. It’s a tug of war and it is helping keep oil prices down but volatile. It’s the threat of war vs. the threat of lower demand and over-production.
Last week we noted that the oil sands breakeven was $75 to $85. That came from estimates from the Alberta Energy Regulator (AER) and the Canadian Energy Research Institute (CERI). Another study by Royal Bank of Canada Capital Markets (RBC) showed that they needed $60 to cover capital and dividend costs. For some producers, the breakeven cost may be even lower down towards $50. Nonetheless, Canada’s oil sands producers’ costs are well above those of Saudi Arabia and others. Just to note. Thanks to reader Jim Semple for the heads-up.
On the week, WTI oil fell 3.2%, while Brent crude was down 3.3%. Natural gas (NG) at the Henry Hub was down 13.9% and NG at the EU Dutch Hub fell 10.7%. For whatever reason, fears of Iran/Israel faded and the weather was warmer, unseasonally warm. Energy stocks responded as the ARCA Oil & Gas Index (XOI) fell 2.7% and the TSX Energy Index (TEN) was down 4.2%. NG remains higher in 2024 but oil is down. The XOI is down 1.2% in 2024 but the TEN has a gain of 11.2% thus far. Despite all that, the charts still appear bullish for energy as we head into 2025.
For NG, $3.10 is now the breakout number as our foray above $3 was short-lived. Major support is at $2.25. For oil, so far, we haven’t made new lows and if that holds, we’ll have a higher low. The only concern is that there might be a head and shoulders consolidation top. Head at $78.46, left shoulder at $72.40, and right shoulder at $72.34. Neck line is near $67. If that breaks, the target could become $53.80. For energy buffs, that is a sobering thought. But then the Middle East war would be in abeyance and the weather would be balmy. Add in lower demand and over-production and we’ll have a reverse energy crisis where many producers could struggle to survive.
Copyright David Chapman 2024
GLOSSARY
Trends
Daily – Short-term trend (For swing traders)
Weekly – Intermediate-term trend (For long-term trend followers)
Monthly – Long-term secular trend (For long-term trend followers)
Up – The trend is up.
Down – The trend is down
Neutral – Indicators are mostly neutral. A trend change might be in the offing.
Weak – The trend is still up or down but it is weakening. It is also a sign that the trend might change.
Topping – Indicators are suggesting that while the trend remains up there are considerable signs that suggest that the market is topping.
Bottoming – Indicators are suggesting that while the trend is down there are considerable signs that suggest that the market is bottoming.
Disclaimer
David Chapman is not a registered advisory service and is not an exempt market dealer (EMD) nor a licensed financial advisor. He does not and cannot give individualised market advice. David Chapman has worked in the financial industry for over 40 years including large financial corporations, banks, and investment dealers. The information in this newsletter is intended only for informational and educational purposes. It should not be construed as an offer, a solicitation of an offer or sale of any security. Every effort is made to provide accurate and complete information. However, we cannot guarantee that there will be no errors. We make no claims, promises or guarantees about the accuracy, completeness, or adequacy of the contents of this commentary and expressly disclaim liability for errors and omissions in the contents of this commentary. David Chapman will always use his best efforts to ensure the accuracy and timeliness of all information. The reader assumes all risk when trading in securities and David Chapman advises consulting a licensed professional financial advisor or portfolio manager such as Enriched Investing Incorporated before proceeding with any trade or idea presented in this newsletter. David Chapman may own shares in companies mentioned in this newsletter. Before making an investment, prospective investors should review each security’s offering documents which summarize the objectives, fees, expenses and associated risks. David Chapman shares his ideas and opinions for informational and educational purposes only and expects the reader to perform due diligence before considering a position in any security. That includes consulting with your own licensed professional financial advisor such as Enriched Investing Incorporated. Performance is not guaranteed, values change frequently, and past performance may not be repeated.


