
“Reason can never be popular. Passions and feelings may become popular, but reason will always remain the sole property of a few eminent individuals.”
—Johan Wolfgang Van Goethe, German poet, playwright, novelist, statesman, theatre director, critic, known for his poems, plays, literature, and aesthetic criticisms, first novel The Sorrows of Young Werther (1774); 1749–1832
“That men do not learn very much from the lessons of history is the most important of all the lessons of history.”
—Aldous Huxley, English writer and philosopher, author of nearly 50 books, including Brave New World (1932); 1894–1963
“Never underestimate the power of stupid people in large groups.”
—George Carlin, American stand-up comedian, actor, social critic, author, dubbed “the dean of counterculture comedians”; 1937–2008
Sanctions and embargoes are words that are tossed around as if they are something new. They are not. Sanctions and embargoes have been around since at least the Middle Ages. Before that, blockades were not uncommon. One is an act of war (blockades) while the other is a legal barrier (sanctions and embargoes). Sanctions include various forms of trade barriers, tariffs, or restrictions on financial transactions while embargoes are similar but more severe. So today, whether we call them trade wars as we did in the 1930s or sanctions as we call them today, the effect is similar. Both result in a decrease in global trade and a decrease in economic growth, and they ultimately hurt the people in the country invoking the sanctions more than those the sanctions are directed against.
Listing a history of trade wars, sanctions, or embargoes takes an entire book or more. Some famous ones include: the Anglo-Dutch War between Great Britain and the Dutch Republic (1652–1784) where Britain effectively used embargoes and more against the Dutch Netherlands, the Opium Wars between Western powers, led by Great Britain against the Qing dynasty of China (1839–1860), the Banana Wars between the U.S. against a collection of small Central American and Caribbean countries (1898–1934), and, most famously, the trade wars of the 1930s triggered by the Smoot-Hawley Act of 1930 that resulted in a series of protectionist moves that deepened the Great Depression.
Sanctions are an economic tool of power, usually applied by a strong economic power against a weaker one. With the U.S. as the world’s largest economy, many might be surprised to learn that they have placed sanctions of varying degrees on some 20 countries (this includes both the country itself and sanctions against individuals in those countries). Most of the names are familiar—North Korea, Iran, Venezuela, Syria, Cuba, and sanctions primarily against individuals in China and Russia. One needs a very large book or a sophisticated
computer system to keep track of all of this so as not to go against sanctions and wind up suffering a severe financial penalty.
The war in Ukraine, coupled with the sanctions against Russia, reduced global trade by 2.8% in 2021. The biggest effect was felt in the EU and Russia as container ship traffic fell sharply. Russian imports fell 9.7% while EU imports dropped 3.4%. As to exports, Russia’s fell 5% while the EU fell 5.6%. The U.S. wasn’t immune as exports fell 3.4% while imports dropped 0.6%. As the chart implies, the impact on China was negligible, at least for now. We are also seeing a slow decline in the Baltic Dry Index (BDI), an index that provides a benchmark for shipping raw materials by sea and the Cass Freight Index (CFI), a measure of monthly freight activity and economic indicator of North American economic trends. Sanctions have an impact and the biggest is a decline in global trade, that could eventually translate into a decline in global economic growth. The question is, is this the end of globalization?
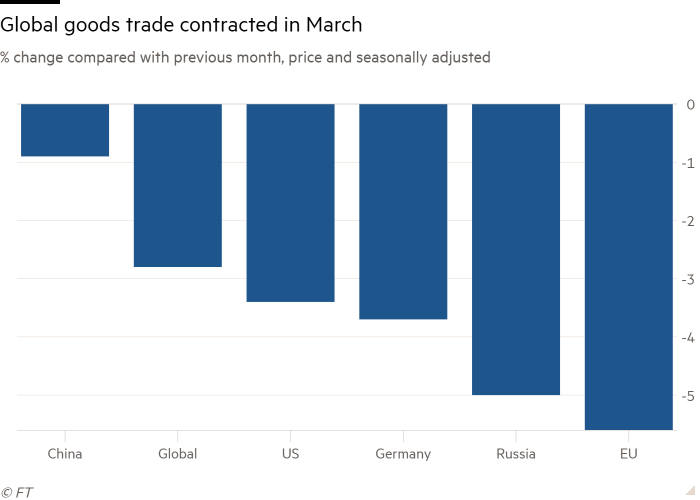
Source: www.ft.com
Globalization is what makes the world go around. Without it, history has shown that economies stagnate, falling into recessions and even into economic depressions. In its most severe form, the world fell into the Great Depression as trade wars, started as a means of protectionism, sparked a huge plunge in global trade
resulting in economic contraction, bankruptcies, and rising poverty. Trade wars, embargoes, and sanctions can ultimately lead to real wars as we saw with the two worst wars of the 20th century, World War I in 1914–1918 and World War II in 1939–1945, both leading to the death of millions. Trade and currency wars preceded both global wars.
Trade wars, sanctions, and embargoes are also currency wars. Before World War I, there was a gold standard but following it the gold standard mostly started to disappear. During World War I, most abandoned the gold standard to print money to pay for the war. During the 1920s, many including Germany, France, and Belgium depreciated their currencies to try to return to some semblance of a gold standard. However, others tried to prevent a currency war as Great Britain did. That didn’t go well and soon everyone, led by Great Britain, France, and the U.S., were engaging in competitive devaluations. That in turn led to the trade wars of the 1930s, exacerbating the Great Depression. That also led to a revaluation of gold upward when the Gold Reserve Act of 1934 saw gold rise from $20.67 to $35, thus devaluing the U.S. dollar. With the U.S. setting a floor for the price of gold, the rest of the world had to follow.
The dollar system, which came out of Bretton Woods following World War II, tying the value of the U.S. dollar to gold (at $35) with everyone else tied to the U.S. dollar, worked until it didn’t. In August 1971 President Richard Nixon took the world off the gold standard. By 1973 Bretton Woods was effectively dead and the world was solely on an experiment of fiat currencies and floating exchange rates. The 1973–1974 Arab oil embargo helped the U.S. dollar to become known as the petro dollar as oil (and all other commodities) were to be priced in U.S. dollars for trade purposes.
With money no longer tied to any gold standard, the next 50 years has seen an explosive growth of money and debt and a series of financial and currency crises. The overvalued U.S. dollar fell sharply during the 1970s, which in turn triggered sharply rising inflation and eventually a financial crisis, resulting in the steep 1980‑1982 recession. Other currency crises were seen during Black Wednesday, September 16, 1992 when the United Kingdom (UK) was forced to withdraw the pound sterling from European Exchange Rate Mechanism (EERM). Other currency crises were seen in Mexico in 1994 and the Asian financial crisis of 1997.
But it is the ongoing currency wars since 2009 that have resulted in competitive devaluations and trade wars that threaten once again. And at the center is the U.S. dollar. The U.S. dollar is the world’s reserve currency and, despite ongoing attacks against it, is likely to remain there, at least for the foreseeable future. Forty percent of international payments for commodities are still conducted in U.S. dollars, U.S. dollar-denominated assets still make up about 60% of the $12 trillion in foreign currency reserves, the euro is no longer considered a threat to U.S. dollar dominance, and the Chinese yuan is still not fully convertible. Chinese yuan securities make up only about 3% of foreign currency reserves even as the IMF has added the yuan as a reserve currency alongside of the U.S. dollar, the pound sterling, and, the Japanese yen.
But sanctions against Russia are changing how countries view the use of the U.S. dollar. Expelling Russian banks from SWIFT has led many to believe that SWIFT is now being politicized. Alternative systems to SWIFT are being built by China and Russia and their membership is expected to grow, particularly China’s. They would use the yuan. Russia’s move to demand payment for their oil and gas in rubles, while still a work in progress (and it could still fail), has had the desired effect. The ruble that crashed following the February 24 Ukraine
invasion is now trading at a better rate than it was on that date (current US$1=79 vs. a high of 150 and 84 on February 24). In other moves, China and Saudi Arabia are looking at conducting their trade for oil in yuan rather than U.S. dollars. Russia and India are looking at conducting their trade in rubles and rupees.
But it is not just SWIFT that is being politicized. With the U.S. effectively blocking Russia’s access to its foreign reserves held outside Russia (or China), they have now politicized holding foreign reserves anywhere that is not one’s home country. If it can happen to Russia, it could happen to anyone. Are your reserves safe and are they yours? This is particularly true for gold reserves held outside the home country. Venezuela saw its gold reserves frozen by the Bank of England (BOE) in the U.K. Years ago, when Germany asked for its gold back from the Federal Reserve, they were told it could take seven years. Germany did get its gold back, but it took four years. The questions begged—why so long and where was the gold?
As to Russia wanting payments for its oil and gas in rubles, as noted, this could fail. The EU could decide they could find oil and gas replacement elsewhere and that demanding payment in rubles violates contracts. As well, Russia would have to find new markets, most likely in Asia where the Asian countries, particularly China, have not gone along with U.S.-led sanctions. Russia may soon find out as the EU is placing sanctions on Russian coal and is now considering a full ban on Russian energy (oil and gas). The trouble is, how is the EU going to replace the energy supplies? There are insufficient supplies globally. Oil can be shipped in tankers but natural gas (NG) requires LNG facilities. Few EU countries have them. Germany may balk, particularly for NG. Hungary is indicating they won’t go along. Others could follow.
Meanwhile, energy prices are soaring as the chart below shows. At some point these prices increases bite. How long will people living in the EU put up with declining living standards, rationing, and more before the seeds of dissent and protests set in? The same could occur in North America (Canada and the U.S.). The same can be said for soaring food prices.
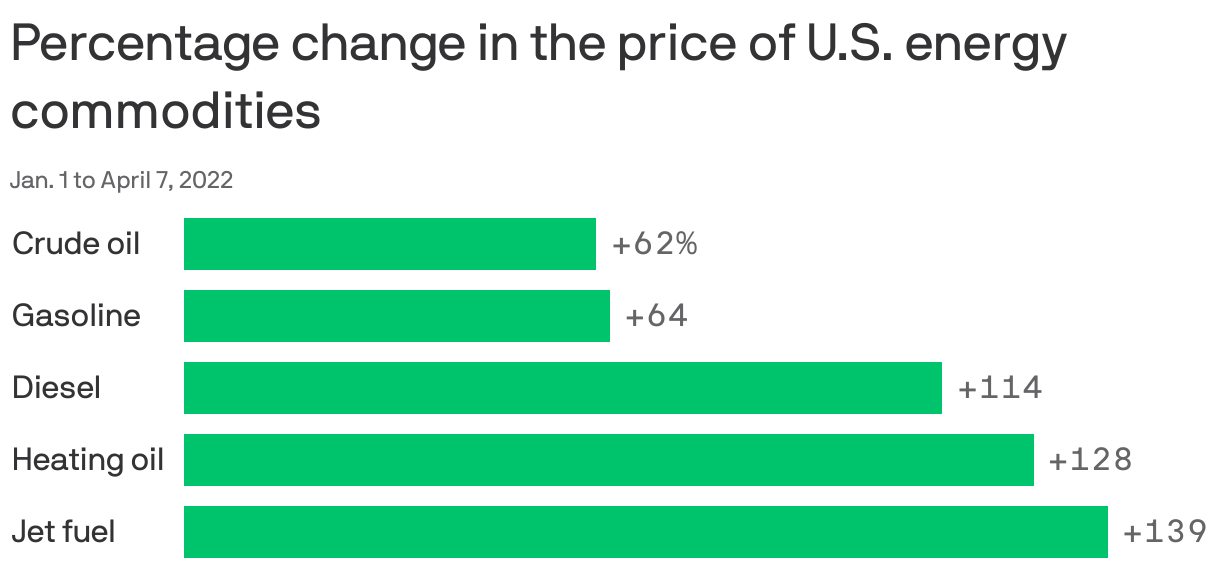
Source: www.factset.com, www.axios.com
The chart from Trading Economics www.tradingeconomics.com shows how food prices have soared.
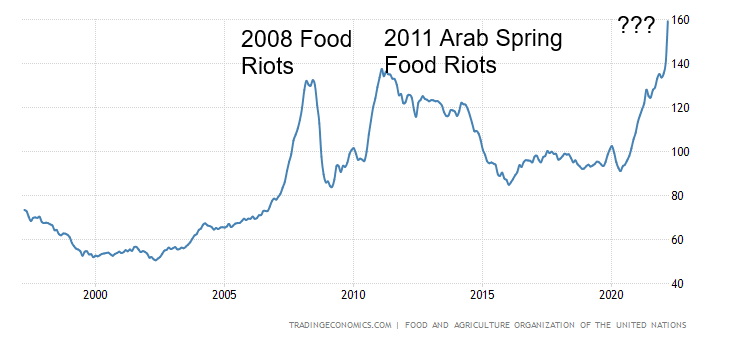
Source: www.fao.org, www.tradingecoomics.com
With Russia and Ukraine accounting for some 30% of global wheat trade, it is no surprise that food prices have soared. The global estimate for February is a rise of 12.6%. With the Middle East and Africa being a prime recipient of Russian/Ukrainian wheat supplies, they are already feeling the pain. Protests are already underway in some countries. Sri Lanka, as an example, has already faced protests as energy blackouts, shortages of basic food goods and soaring prices have set off a wave of protests. We are also hearing of trouble in Peru, Egypt, and more as more countries are expected to follow. By the summer it could be a tidal wave of countries. Two previous spikes seen above during the 2008 financial crisis and again during the period of the EU/Greek debt crisis saw food prices soar in these countries. Protests were widespread during the 2008 financial crisis and the so-called Arab Spring was set in motion during the second spike. Some are already expecting this one to be worse.
But can the crisis be contained just in the Middle East and Africa or could soaring food prices set off sparks in the EU and North America as well?
Meanwhile, the clock is ticking on Russian debt. No, the possibility of a Russian debt default has not gone away. Russia has not officially defaulted on its external debt since 1917. The 1998 financial crisis was a devaluation of the ruble and a default on domestic debt. On April 4, 2022 Russia was to make a payment of $649 million to holders of two of its sovereign bonds. The U.S. Treasury blocked the payment, preventing Russia from using its currency reserves for servicing debt. Russia placed the equivalent in rubles in special accounts. They won’t accept rubles.
The last figures we have on Russia’s external debt was $478.2 billion in Q4. There is a 30-day grace period. Russia appears to be showing a willingness to pay and they have the means, given their large foreign exchange reserves. Not all of that is frozen. And in the interim, they do continue to receive payment for their energy (oil and gas). But many believe trying to pay in rubles is technically a default although it is not being reported that way. The question now becomes: how will the market perceive this, given this is a default not caused by Russia itself but by the U.S. blocking payment? How will that impact potentially up to $41 billion of credit default swaps? Spreads on credit default swaps have soared. A full embargo on Russian oil and gas along with coal and nuclear fuel that is being proposed could be at least be partially offset by a Russian debt default.
Russia External Debt 2019–2021
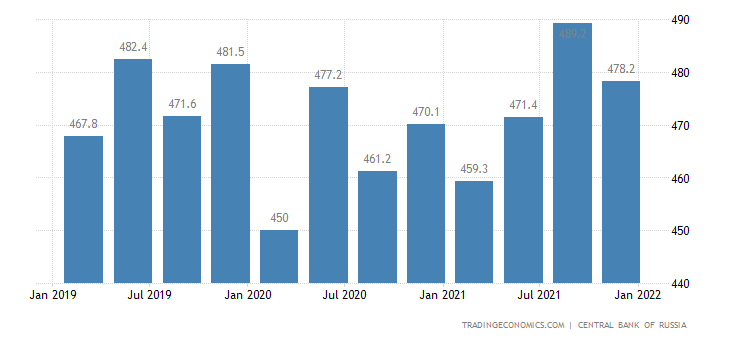
Source: www.tradingeconomics.com, www.cbr.ru
We have noted previously that the ruble has returned to levels below where it was before February 24, 2022 Hiking interest rates and putting on exchange controls, intervening in markets have thus far allowed the ruble to regain its value. They also effectively turned the ruble into the gold ruble by backing it with gold at a price of 5,000 rubles to 1 gram of gold. All that sparked a ruble rally that fell from around 150 to the U.S. dollar to currently around 78, below the 84-level seen on February 24, 2022. It is good news and bad news, as a strengthening ruble means funds received for selling energy in U.S. dollars or euros will now purchase more rubles but it has backfired against the U.S. who wanted to sharply devalue the ruble.
Prices are rising in Russia as well. Inflation was reported at 16.7% for March 2022 compared to 9.2% in February. Food prices in particular have soared 18.0% vs. 11.5% in February. Prices are soaring because of sharply rising import costs (if they are even coming) and the growing lack of component parts which are now largely unattainable because of sanctions. Much of their domestic airline industry is composed of foreign
airplanes. Parts are now unattainable. All this also could negatively impact Russia’s budget. Russia has one of the lowest government debt to GDP ratios in the world, currently around 17.8% (compare that to the U.S. at 125%) so they do potentially have room to increase domestic government debt (i.e., print money).
Russia Government Debt to GDP 2012–2021
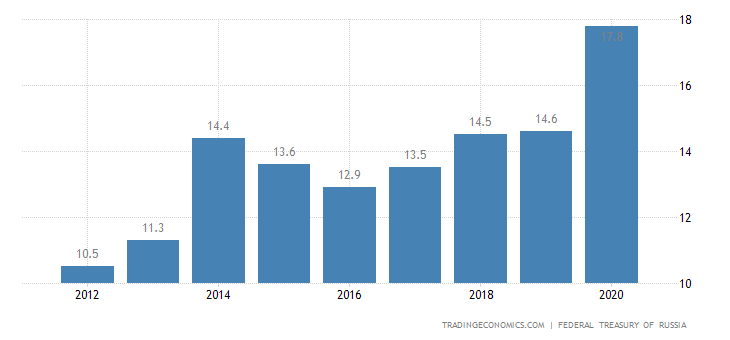
Source: www.tradingeconomics.com, www.roskanza.gov.ru
Sanctions, embargoes, and trade wars have consequences. If a full embargo on Russian commodities were put in place it could prove very damaging, not only for Russia but for the world economy. Yes, some commodities, particularly oil and gas can be replaced but not immediately and, given the investments required, it could take years. While the world continues to invest in renewable energy and alternatives, they cannot replace overnight what oil and gas contribute. Oil, gas, and coal still supply the world with some 80% of its energy needs. Russia can redirect some of its energy, particularly to other parts of Asia and China, but again that is not going to happen overnight. Russia lacks storage capacity so it could lead to shutting in wells. You cannot shut down and start up wells at the push of a button.
Oil alone is 5% of global GDP, and when you add in all of what flows out of oil in terms of goods the actual number is likely quite higher. Global trade has already contracted and could take a bigger hit. Globalization that has helped much of the world out of poverty would retreat, potentially throwing millions back into poverty and sparking unrest, including revolts in many countries. Globalization that has meant so much to the world could also see the world plunge into a global recession or worse. And, as we noted, trade wars eventually lead to real wars.
There is a wide margin for error in all of this. What happens if we have a resurgent COVID? Global GDP growth expectations are already being cut back. They may be cut back even more.
Chart of the Week
Source: www.stockcharts.com
When we started The Scoop some 27 years ago, we used to write most days a short piece on a stock in the news. What was interesting about it was that sometimes the technicals went against the rosy picture that was being presented in the article. Setting aside the ongoing war in Ukraine, what caught our attention this past week was Twitter (TWTR). Yes, Twitter, where many, including the former president, have been banned because of violating Twitter’s terms of service. But when the world’s richest man “scoops” up 9.2% of Twitter, it catches some people’s attention.
Yes, the world’s richest man—Elon Musk. Mr. Musk is so rich that if he were a country, he’d be the 46th largest country in the world between Vietnam and Romania. Billionaires are so rich that even your garden variety billionaire could snap up an entire country, okay, island, such as Grenada with an estimated GDP of $1.3 billion. Musk could buy 200 Grenada’s and have change left over. So, it’s nothing really, purchasing Twitter whose market cap is estimated at $41 billion. Musk’s net worth is estimated at $267 to $270 billion. The world’s largest company is Apple (AAPL) with an estimated market cap of $2.9 trillion. The world’s largest gold mining company, Newmont Corp. (NEM), has a market cap of about $47 billion. Tesla, where Musk is the CEO, has a market cap of about $1.1 trillion.
Your average Canadian household has a net worth of between $900,000 to $1,000,000 with most of that being real estate. But the median net worth is less than $400,000 and 3–4% of Canadian families live in poverty. On
the other hand, there are an estimated 2,668 billionaires in the world, according to Forbes. Of that total, 735 are in the U.S., the highest, followed by China with 607. Russia has 83 and that’s down by 34 because of the war with Ukraine and the result of sanctions. Canada has 64 billionaires, led by Changpeng Zhao, who was born in China but came to Canada at a very young age. He’s the CEO and founder of Binance, the world’s largest cryptocurrency exchange with an estimated net worth of US$68.2 billion. At least nine billionaires have a net worth in excess of $100 billion. Musk is so wealthy that it would take 267,000 Canadian families to equal what he is worth.
So, will Elon Musk have influence at Twitter now that he is also on the Board of Directors? Musk started buying Twitter shares only recently. He has freely admitted his purpose is to effect change at the company. What that means is not clear at the moment. Employees have expressed concerns. Musk has agreed to not purchase more than 15% of the company. But his influence on the company could go way beyond 15%.
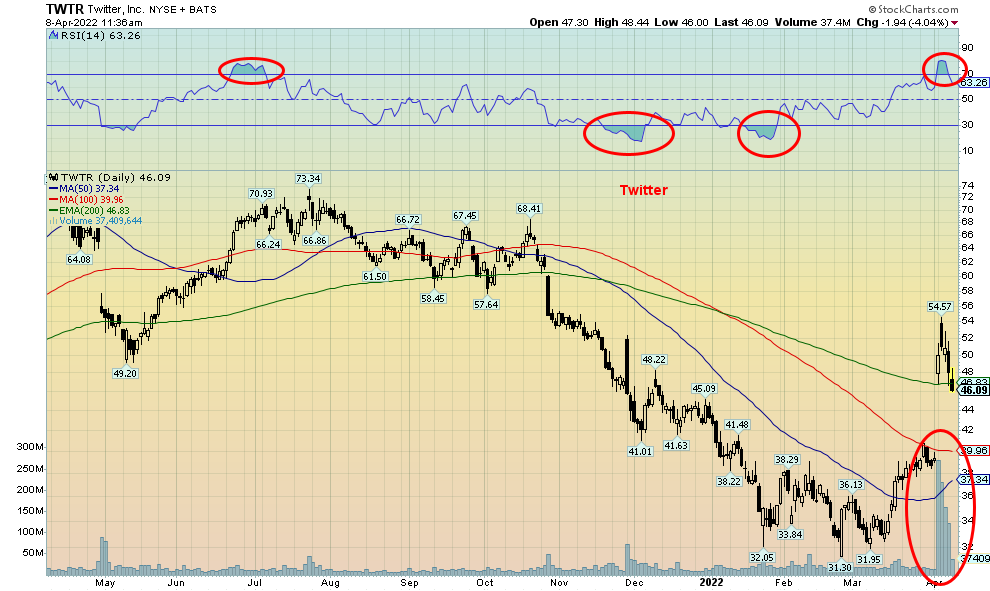
So, what happened? Twitter, which had been at one time a bit of a tech darling and is a member of the FAANGs Index, rose from March 2020 to February 2021 over 300%. Then it fell over the next year roughly 61%. Not such a darling any more. But when everyone realized Musk had purchased over 9% of the company and he might effect change, Twitter gapped higher on April 4, 2022, up 32% on the day on record volume. Looks like a pretty solid breakaway gap despite the fact that on the week Twitter closed up only 17.7%. Looks like Musk got himself a pretty cheap deal. The rich get richer.
TWTR stalled out at the 40-week MA, and, just above the 200-day MA. There is a large gap below begging to be filled. Will TWTR fill that huge gap? That’s less likely because the volume was so huge confirming the breakaway gap. However, a test into the gap wouldn’t be a surprise. But TWTR may consolidate around here before moving higher. Clearly, a breakdown under $40 would suggest this is a failure. A lot may depend on what Musk brings to the table in terms of changing the company. But for now, the world’s richest man has a megaphone to the world (he does have 80.5 million followers) through one of the world’s largest social media companies. Maybe he’ll send it into space.
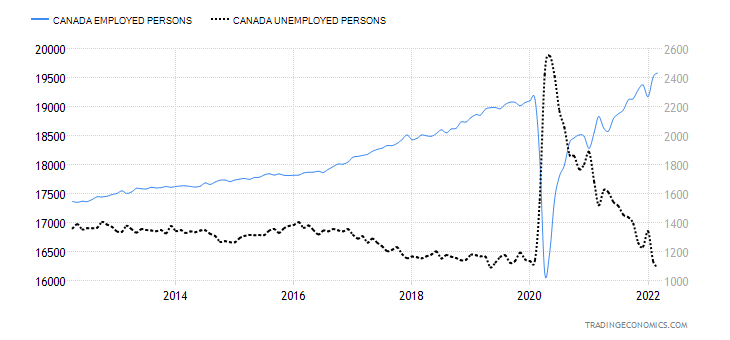
Canada job numbers
Source: www.tradingeconomics.com, www.statcan.gc.ca
The unemployment rate unexpectedly fell to 5.3%, the lowest rate on record since comparable data came on stream in 1976. In February the rate was 5.5%. The R8 unemployment rate, which is the highest level released by Statistics Canada rose, however, to 8.3% from 8.1%. The R8 unemployment rate includes discouraged workers and involuntary part-timers. In February 2020 that rate was 8.6%. The labour force participation rate was unchanged at 65.4%. In February 2020 the rate was 66.3%.
Canada’s labour force remains relatively tight, especially given that the unemployment rate is the lowest in years. That, along with the budget just released this week, means that the Bank of Canada (BofC) remains on course to continue to hike interest rates. While the budget forecasts further deficits economic growth is expected to temper some of the rise, thus lowering the important debt to GDP ratio. Canada’s Federal debt to GDP ratio is already the lowest in the G7, projected to fall to 45.1%. Remember that is just Federal debt. The U.S. Federal debt to GDP is 125.6%
All this should leave the BofC on target to hike interest rates 50 bp next week. As we have noted, the danger is the risk that the global economy falls into recession into 2023.
Canada Wage Growth vs. Inflation 2017–2022
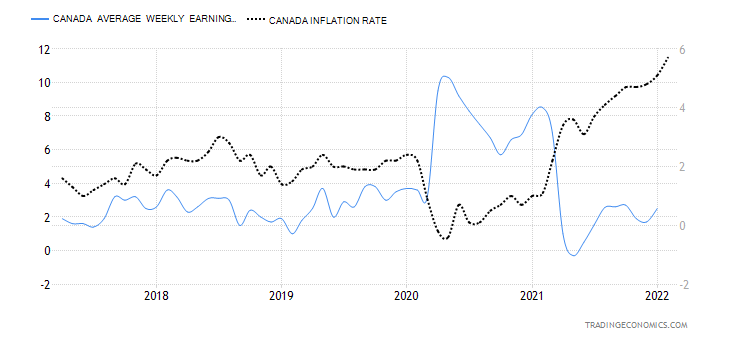
Source: www.tradingeconomics.com, www.statcan.gc.ca
MARKETS AND TRENDS
|
|
|
|
% Gains (Losses) Trends
|
|
||||
|
|
Close Dec 31/21 |
Close Apr 8/22 |
Week |
YTD |
Daily (Short Term) |
Weekly (Intermediate) |
Monthly (Long Term) |
|
|
Stock Market Indices |
|
|
|
|
|
|
|
|
|
S&P 500 |
4,766.18 |
4,488.28 |
(1.3)% |
(5.8)% |
up |
neutral |
up |
|
|
Dow Jones Industrials |
36,333.30 |
34,721.12 |
(0.3)% |
(4.5)% |
up |
neutral |
up |
|
|
Dow Jones Transports |
16,478.26 |
14,470.72 |
(6.7)% |
(12.2)% |
down |
down |
up |
|
|
NASDAQ |
15,644.97 |
13,711.00 |
(3.9)% |
(12.4)% |
down |
down |
up |
|
|
S&P/TSX Composite |
21,222.84 |
21,874.35 (new highs) |
(0.4)% |
3.1% |
up |
up |
up |
|
|
S&P/TSX Venture (CDNX) |
939.18 |
888.21 |
(1.0)% |
(5.4)% |
up |
neutral |
up |
|
|
S&P 600 |
1,401.71 |
1,272.84 |
(4.4) |
(9.2)% |
down |
down |
up |
|
|
MSCI World Index |
2,354.17 |
2,175.50 |
(2.4)% |
(7.6)% |
neutral |
down |
up (weak) |
|
|
NYSE Bitcoin Index |
47,907.71 |
42,523.07 |
(5.2)% |
(9.1)% |
up (weak) |
neutral |
up |
|
|
|
|
|
|
|
|
|
|
|
|
Gold Mining Stock Indices |
|
|
|
|
|
|
|
|
|
Gold Bugs Index (HUI) |
258.87 |
322.53 |
0.4% |
24.6% |
up |
up |
up |
|
|
TSX Gold Index (TGD) |
292.16 |
363.10 |
0.8% |
24.3% |
up |
up |
up |
|
|
|
|
|
|
|
|
|
|
|
|
Fixed Income Yields/Spreads |
|
|
|
|
|
|
|
|
|
U.S. 10-Year Treasury Bond yield |
1.52% |
2.71% (new highs) |
13.9% |
78.3% |
|
|
|
|
|
Cdn. 10-Year Bond CGB yield |
1.43% |
2.64% (new highs) |
8.6% |
84.6% |
|
|
|
|
|
Recession Watch Spreads |
|
|
|
|
|
|
|
|
|
U.S. 2-year 10-year Treasury spread |
0.79% |
0.19% |
416.7% |
(76.0)% |
|
|
|
|
|
Cdn 2-year 10-year CGB spread |
0.48% |
0.21% |
110.0% |
(56.3)% |
|
|
|
|
|
|
|
|
|
|
|
|
|
|
|
Currencies |
|
|
|
|
|
|
|
|
|
US$ Index |
95.59 |
99.75 (new highs) |
1.1% |
4.4% |
up |
up |
up |
|
|
Canadian $ |
.7905 |
0.7954 |
(0.5)% |
0.6% |
up (weak) |
up |
up |
|
|
Euro |
113.74 |
108.75 |
(1.6)% |
(4.4)% |
down |
down |
down |
|
|
Swiss Franc |
109.77 |
107.09 |
(0.9)% |
(2.4)% |
down |
down |
up (weak) |
|
|
British Pound |
135.45 |
130.34 |
(0.6)% |
(3.8)% |
down |
down |
neutral |
|
|
Japanese Yen |
86.85 |
80.44 (new lows) |
(1.5)% |
(7.4)% |
down |
down |
down |
|
|
|
|
|
|
|
|
|
|
|
|
|
|
|
|
|
|
|
|
|
|
Precious Metals |
|
|
|
|
|
|
|
|
|
Gold |
1,828.60 |
1,945.60 |
1.1% |
6.4% |
up |
up |
up |
|
|
Silver |
23.35 |
24.82 |
0.7% |
6.3% |
neutral |
up |
up |
|
|
Platinum |
966.20 |
975.60 |
(1.3)% |
1.0% |
down |
down |
neutral |
|
|
|
|
|
|
|
|
|
|
|
|
Base Metals |
|
|
|
|
|
|
|
|
|
Palladium |
1,912.10 |
2,420.10 |
6.7% |
26.6% |
down (weak) |
neutral |
up |
|
|
Copper |
4.46 |
4.73 |
0.8% |
5.9% |
up |
up |
up |
|
|
|
|
|
|
|
|
|
|
|
|
Energy |
|
|
|
|
|
|
|
|
|
WTI Oil |
75.21 |
98.26 |
(1.0)% |
30.7% |
down (weak) |
up |
up |
|
|
Natural Gas |
3.73 |
6.28 (new highs) |
9.8% |
68.4% |
up |
up |
up |
|
Source: www.stockcharts.com, David Chapman
Note: For an explanation of the trends, see the glossary at the end of this article.
New highs/lows refer to new 52-week highs/lows and, in some cases, all-time highs.
Source: www.stockcharts.com
A hawkish Fed, an ongoing war, and sanctions may be biting but the backlash could wind up being worse. The Fed now seems to be on a mission to hike rates even faster and start a round of quantitative tightening (QT) as they reduce their balance sheet by $95 billion/month, starting most likely in May. Inflation is going to get worse (see bonds) and that could spark even bigger rate hikes. We suppose it wasn’t a surprise with growing negativity that consumer staples and health care sectors did well this past week. And, as we note with the TSX, the metals, energy, and telecommunications are also doing well.
This past week the S&P 500 fell 1.3%, the Dow Jones Industrials (DJI) was down 0.3% (the best performer), the Dow Jones Transportations (DJT) down 6.7% (the worst performer), the NASDAQ down 3.9%, the S&P 600 small cap down 4.4%, and the S&P 400 mid-cap down 3.4%. The S&P 500 equal weight was down 0.9%, but we couldn’t help but notice that the ultimate value stock Berkshire Hathaway was up 0.2%. In Canada, the TSX Composite fell about 0.4% after once again hitting new all-time highs while the TSX Venture Exchange (CDNX) fell 1.0%. In the EU the London FTSE was a performer, up 1.2% but the Paris CAC 40 fell 2.0% and the German DAX dropped 1.1%. In Asia, China’s Shanghai Index (SSEC) was down 0.9% and the Tokyo Nikkei Dow (TKN) dropped 2.5%.
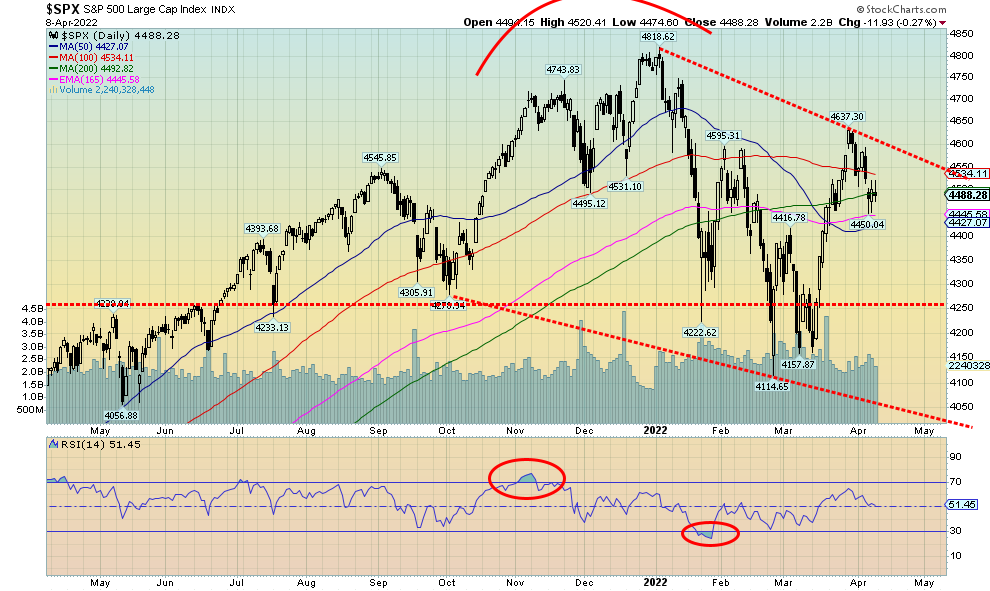
If we are entering a bear market, it is so far a slow-moving bear. That could be the worst kind of bear as the market just grinds lower before it falls off the cliff. The recent rally for the S&P 500 regained 74% of the recent
drop, falling just short of going over 4,650 that might have suggested new highs ahead. Instead, we came back down and are now clinging to the 200-day MA. The 50-day has crossed under the 200-day and the 100-day MA is pointed down. A breakdown under 4,400 could start things further to the downside. A breakdown under 4,250 could suggest new lows ahead. A firm break under 4,400 could also prove fatal for the market.
The stock markets have been in a corrective phase now for three months. This has not yet turned to an official bear market (down 20% or more). That doesn’t happen until under 3,850. But the overall direction is not good and there is little, if anything, on the horizon that might make this market positive again. The negatives outweigh the positives. As others have noted as well, the sanctions on Russia will not be removed even if somehow peace broke out tomorrow. And, given word of massive movements of more heavy armaments into Ukraine, the odds of peace being achieved are slim to none. So, inflation is going to stay high (could become stagflation if the economy starts to slow), the Fed is hawkish, world trade is being seriously disrupted, and oil prices are going to stay high. Can’t bring much joy. All we need now is a Russian debt default (that appears to be coming) or, as a surprise out of the blue, a major debt default or bond fund blowup. The risks are rising, not abating. But this current decline could still turn out to be merely a pullback within the context of larger up move. Watch what happens at 4,400 and 4,250 for clues as to where we might go.
Source: www.stockcharts.com
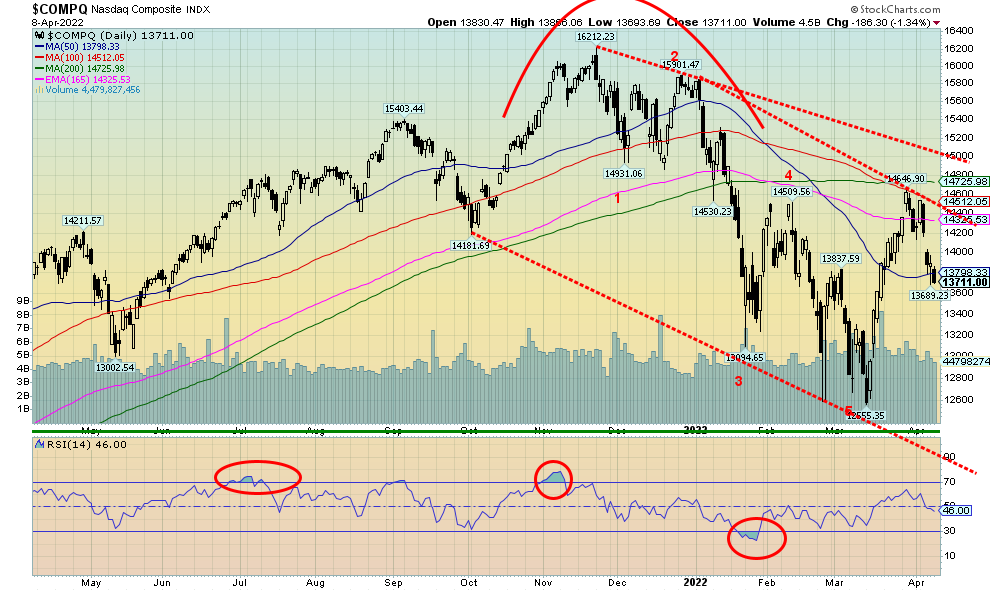
The NASDAQ struggled this past week, gapping down on Wednesday and finishing the week down 3.9%. The NASDAQ is now down 12.4% in 2022 and has been down as much as 22.6% from the early January 2022 high. The FAANGs continue to be leaders to the downside. Meta fell 1.1%, Apple was down 2.4%, Amazon dropped 5.6%, Netflix fell 4.8%, Google down 4.8%, Microsoft was off 4.0%, and Tesla dropped 5.5%. However, the big losers were the Chinese stocks with Baidu down 4.5% and Alibaba off 6.1%. The biggest loser? Nvidia, down a sharp 13.5%. Were there any winners? Yes, Twitter was up 17.7%, thanks to Elon Musk buying in (our Chart of the Week). But there is no joy in the chart of the NASDAQ as it has a classic bear market look. The close on the week was back under the 50-day MA and we failed at the 200-day MA. This is going lower, although we can note this might merely be a correction to the up move from the March low. We’d need to find support at minimum around 13,000. A break below that level could see the NASDAQ fall further and see new lows. Only recovering and taking out 15,000 could save this market.
Source: www.stockcharts.com
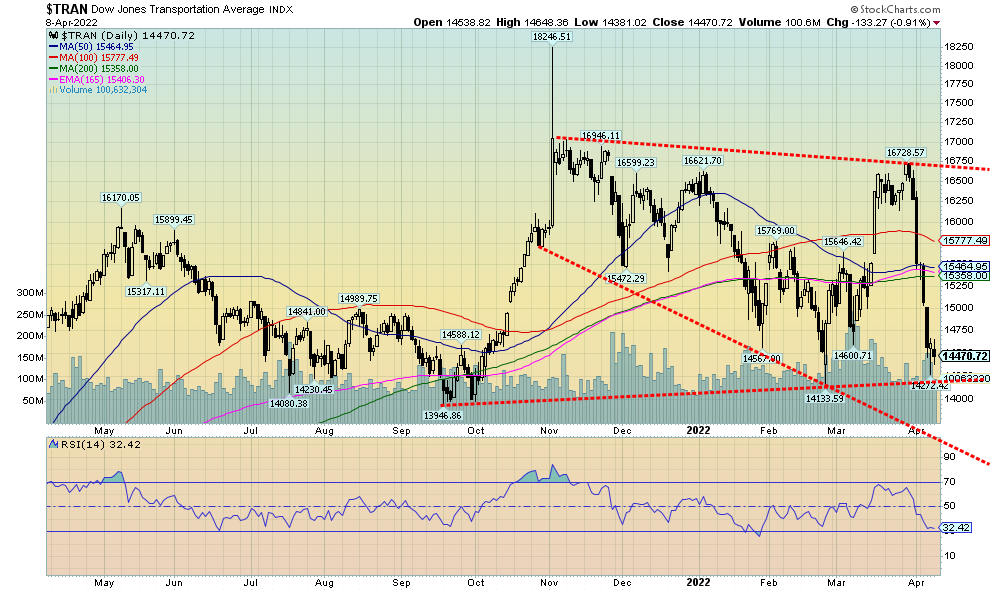
Is the Dow Jones Transportations (DJT) the canary in the coal mine for the stock market? It certainly has been weak as this past week attests, given the index fell 6.7%. The DJT is down 12.2% on the year, leading the DJI by quite a margin as it is only down 4.5% on the year. It rivals the NASDAQ, down 12.4% so far in 2022. Not helping, of course, is the slowdown in global trade, a decline in the Baltic Dry Index (BDI) for global shipping, and the Cass Freight Index (CFI) again for shipping but domestic. High oil prices are also not helping along with supply disruptions. Higher interest rates will also not help. The DJT appears to be on the cusp of a further breakdown and we could soon see new lows. The breakdown starts under 14,200 and new lows would be seen under 13,950. This chart does not look positive.
Source: www.stockcharts.com
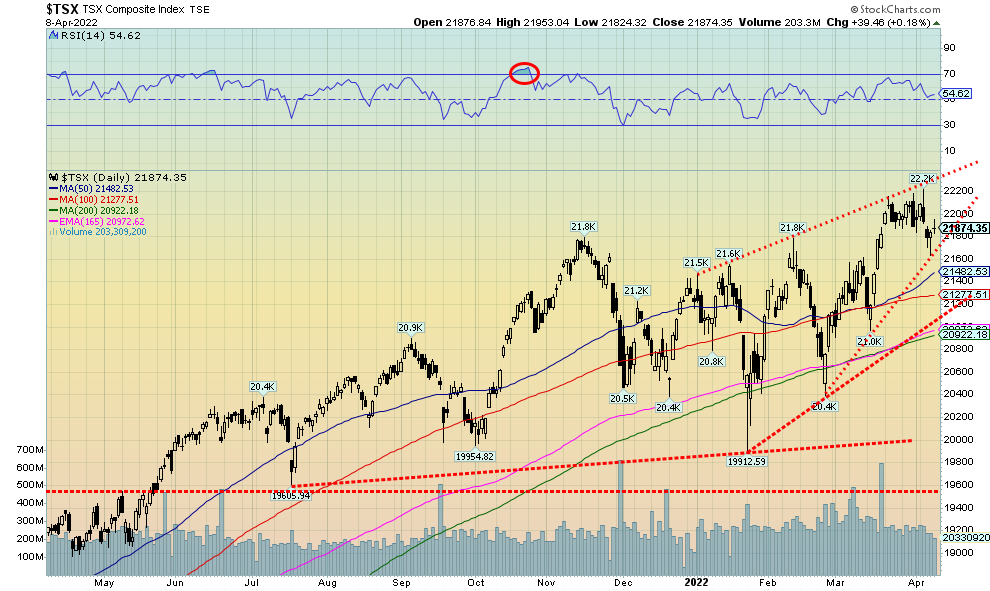
The TSX keeps on making new highs. They did it again this past week. But, as has happened before, the TSX wound up closing slightly lower on the week, down just under 0.4%. A number of sub-indices made new highs along with the TSX. These indices are all in nice uptrends and could go higher, continuing to make the TSX the best-performing index. Making new highs were Consumer Staples (TCS) up 3.3%, Energy (TEN) up 2.3%, Telecommunications (TTS) up 3.2%, and Utilities (TUT) up 2.1%. Indeed, only six of the 14 sub-indices were up on the week. The other two were Golds (TGD), up 0.8% and Materials (TMT), up about 0.5%. Surprisingly, Metals & Mining (TGM) did not close higher down 1.2% but that sector is also in a good uptrend. Leading the losers was Information Technology, down 5.1%. Other significant losers were Health Care (THC) -4.8% and Industrials (TIN) -2.0%. The TSX continues in what appears as an ascending wedge triangle which is bearish. The top of the channel is currently around 22,300 so there is room to move higher. The initial breakdown comes in around 21,650 but we’d need a confirmation under 21,475 and especially under 21,000. However, the triangle is getting narrower so a break one way or the other (down is favoured) is coming.
U.S. 10-year Treasury Bond/Canadian 10-year Government Bond (CGB)
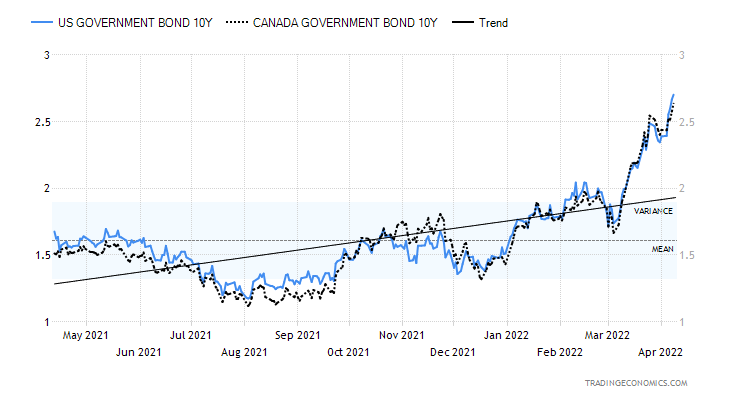
Source: www.tradingeconomics.com, www.home.treasury.gov, www.bankofcanada.ca
Bond yields just keep on rising. This week the U.S. 10-year treasury note soared to 2.71% following more hawkish statements from the Fed. The Fed seems determined to fight inflation rather than employment as the job market continues to be tight. Fear is rising that the Fed may hike even faster with 50 bp hikes in May and June. As well, it is moving to quantitative tightening (QT) by suggesting they’ll shrink their bond positions by $95 billion monthly starting in May. The 2-year U.S. treasury note didn’t respond as fast as the 10-year and the result was that the 2–10 spread leaped from negative 6 bp a week ago to +19 bp this week. The trouble is that rapid hikes in interest rates could see the U.S. economy move in the opposite direction from growth to recession and that could happen in a hurry. Already we are hinting that the U.S. could fall into recession by year end or certainly into 2023. As to inflation, oil, gas, and food are causing the biggest problem but we note that even the core inflation rate is jumping. For the 10-year, the yields are now the highest in three years.
Another danger is, what if COVID gets ugly again? China is seemingly struggling with it and they take a vicious approach with full lockdowns (don’t cross them). That is causing more supply disruptions. But the economic effects of China can ripple around the world. Add in the sanctions on Russia and the fact it’s a commodity powerhouse and it exacerbates the problem. Not helping as well is a strong U.S. dollar as, while it makes imports cheaper, it can negatively impact exports and it makes it more expensive for the massive amount of foreign debt denominated in U.S. dollars held by foreign countries. Now the U.S. appears to be blocking Russia from making its bond payment and that could trigger another financial crisis.
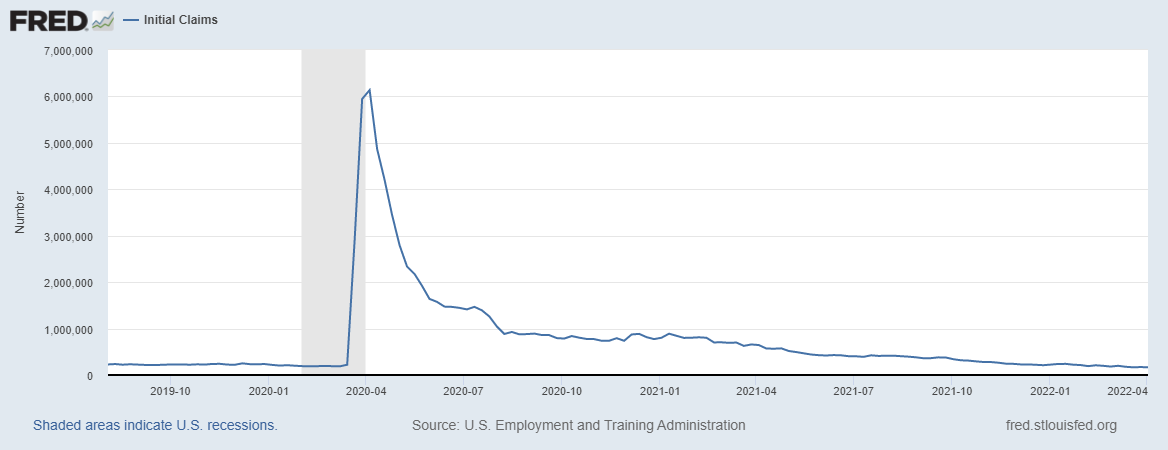
We can’t help but notice the strong job numbers as the initial jobless claims fell to their lowest in 54 years. Yes, that’s right. This past week initial jobless claims were 166,000, the lowest since 1968. It was only two years ago that 6.1 million applied for jobless claims. Workers that leave jobs are finding new ones quickly and employers are looking for people. A reminder as well that this number is impressive as the labour market was a lot smaller in 1968 than it is today. The official unemployment rate (U3) is 3.6%, also one of the lowest in 50 years (in only two other months has it been lower). No wonder inflation is rising and the tight labour market could put more upward pressure on wages that have so far lagged.
Initial Jobless Claims 2019–2022
Source: www.bls.gov, www.stlouisfed.org
This coming week could prove interesting as the CPI comes out on Tuesday and expectations are 8.3% vs. 7.9% in February, and, core inflation 6.7% vs. 6.4%. The PPI comes on Wednesday and again expectations are 11% vs. 10% and core 8.8% vs. 8.4%. Inflation is soaring, along with interest rates.
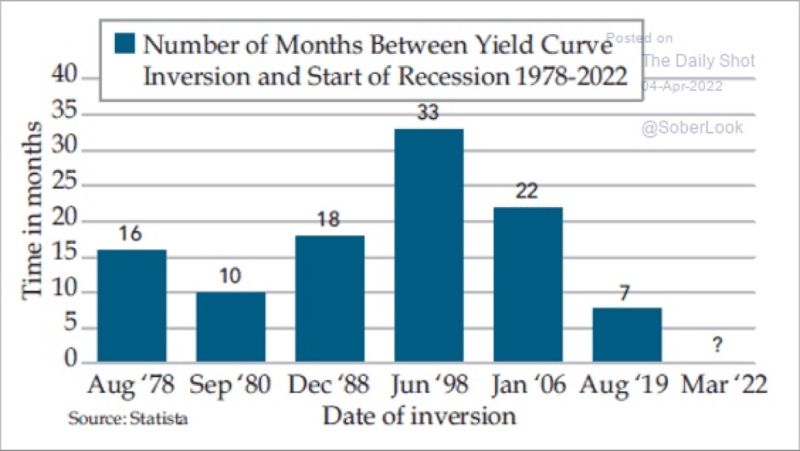
Source: www.statista.com
We have said before that there is a lag between the yield curve inverting and the start of a recession. This chart from Statista (www.statista.com) shows it can be substantial. In one case it was up to 33 months. The average is about 18 months. But throw out the longest and shortest and the average is still 16.5 months. Given the yield curve first went negative in March 2022, it could take from June 2023 to August 2023 before we see a recession get underway. Or, if the time frame is short, it could start in October 2022 to January 2023. The clock is ticking.
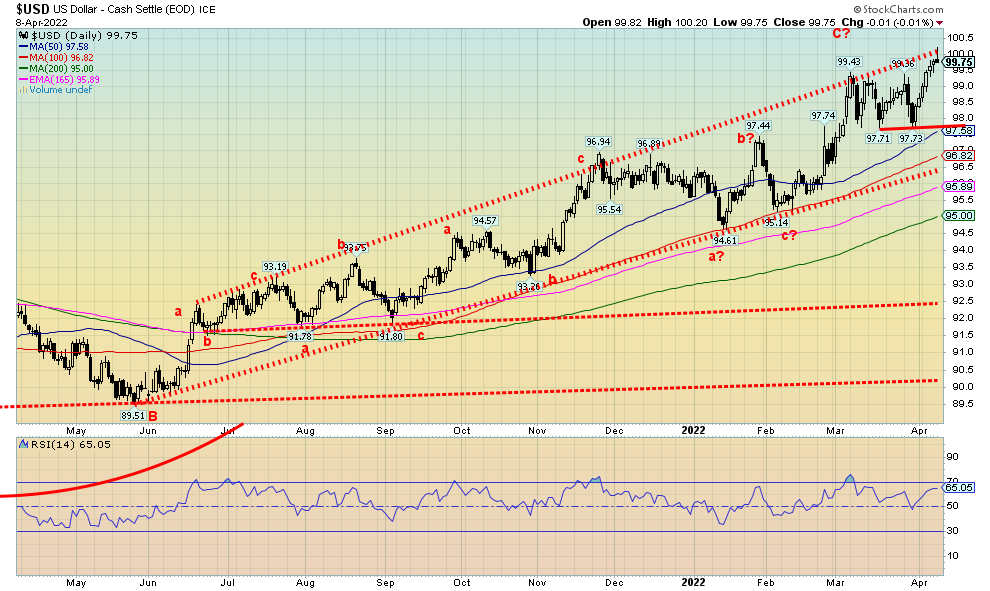
Source: www.stockcharts.com
Once again the US$ Index tested the top of our channel before reversing and closing off small on Friday. The high was 100.20, the highest level seen since 2020. With the US$ Index making new highs, we note a potential divergence with the euro that failed to make new lows this past week. Divergences are just that but they need to be confirmed. If the euro falls further to new lows then it will confirm the new high for the US$ Index. We’ll have to wait, however, as we might not get a confirmation until the US$ Index breaks back under 98 and the euro breaks back over 111.75. This past week the US$ Index rose 1.1% while the euro fell about 0.5%, the Swiss franc was down 1.6%, the pound sterling off 0.6%, and the Japanese yen continued its woes, losing 1.5% to fresh 52-week lows. The yen is not being helped by the BOJ that is artificially keeping interest rates low and Japan faces high energy costs as they have to import their oil. The BOJ has shown little desire for tightening like other central banks. The euro remains weak because of the ongoing war in Ukraine and some fears that Macron might lose the election to the far right Le Pen. Hawkish messages from the Fed are also helping the US$ Index. Hitting the top of the channel may be it for the moment. but we can’t even think about a a US$ Index breakdown until under 98 and especially under 97.50. Even then, we can see further support at the bottom of the bull channel near 96.50 and the 200-day MA near 95.
Source: www.stockcharts.com
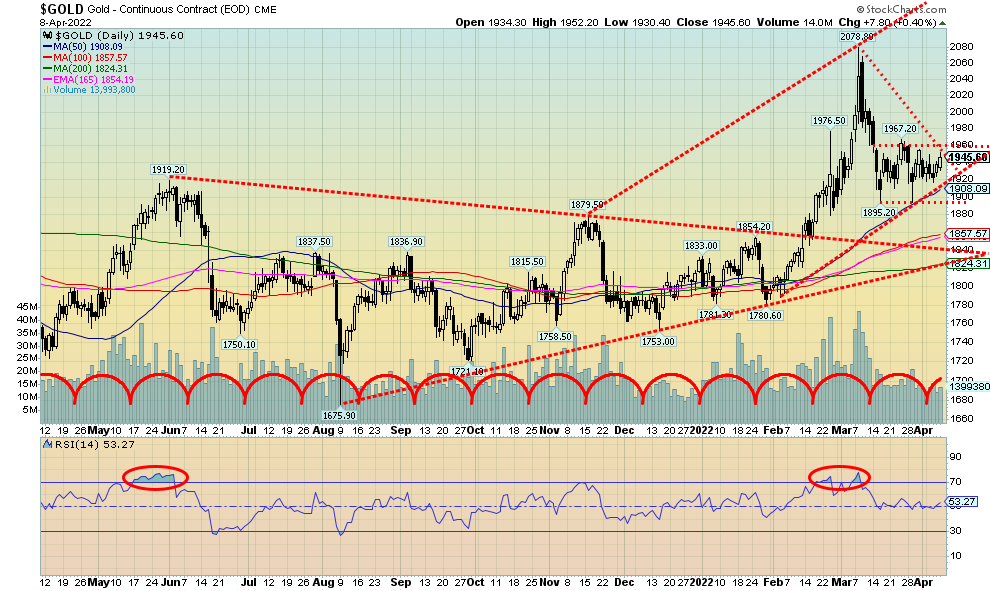
It is interesting to note that gold has sustained itself over $1,900 since the invasion got underway on February 24. Gold hadn’t done that apparently since September 2020 and back then gold was on its way down. Now gold appears to be on its way up but is, we suspect, being held back by all the hawkish comments from the Fed and a strong U.S. dollar that hit 100 this past week. That said, we view all this as bullish. Gold even appears to be forming some sort of bull triangle. A break over the recent high at $1,967 could trigger further up moves. The range over the past month for gold is roughly $1,900 to $1,960.
This past week gold gained 1.1%, silver was up 0.7%, platinum continues to be weak, down 1.3%, but palladium got a boost, gaining 6.7% and copper jumped 0.8%. Compare all these moves to the broader stock indices that were almost universally down this past week. The gold stocks also gained with the TSX Gold Index (TGD) up 0.8% and the Gold Bugs Index (HUI) up about 0.4%.
Gold is remaining strong due to demand and lesser supply. Central banks have been steady buyers, particularly Russia and China, but also mostly other Asian banks. Gold is also being driven to some extent by the war in Ukraine as it goes up when hostilities rise and goes down if they talk peace. Gold is also benefitting from the ongoing negative yields as the Fed Funds and the U.S. 10-year remain well below the rate of inflation. Even if the Fed were to raise rates as everyone expects the negative spread will still be over 5% by year end assuming inflation remains roughly where it is. Unless the Fed wants to push the Fed rate to 8%. At that level the Fed will be more concerned about the sinking economy than inflation. Stagflation is also entering the discussion as
many are now becoming concerned that high inflation could persist and the economy will start to slow down. The stagflationary 1970s were ideal conditions for gold as it soared from $35 to over $800, even if it was over a decade.
There is also some buzz over Russia’s decision to effectively peg gold at 5,000 rubles = 1 gram. Although Russia sort of broke off from that promise, it had the desired effect and the ruble increased in value and is now trading at a better level than it did on February 24, suggesting that despite all the sanctions the attempt to sink the ruble has failed. The translation for that price into US$ suggests a floor around $1,940. View this as a kind of Russian put on the price of gold. As well, Russia is creating connection between rubles and gold. Russia has a lot of gold and there are suggestions that they have even more than they are stating. Some analysts have suggested that Russia actually holds some 12,000 metric tonnes of gold and China 20,000 metric tonnes of gold. Officially Russia holds at least 2,300 metric tonnes and China 1,948 metric tonnes. The U.S. is supposed to hold 8,133 metric tonnes, but no audit has been done since 1986.
All of this is just background intrigue with speculation as to what it all means. One thing that is clear is that both Russia and China are major gold producers. China is number one and Russia number three (Australia is number two). And both hold large reserves of gold. Russia has the world’s second largest reserves of gold in the ground behind Australia. China ranks number seven. Both Russia and China have the reserves to continue to supply themselves without exporting any. The U.S. is the world’s fourth largest producer and holds the fourth largest mining reserves.
On another note, the London market has suspended trading in newly refined Russian platinum and palladium. Palladium prices surged about 11% after that but it did nothing much for platinum. Russia’s Norilsk Nickel produces some 25%–30% of the global palladium supply and 10% of the world’s platinum. Palladium in particular is used in automobile manufacturing to help curb emissions. Norilsk continues to sell to manufacturers but they may have to find a work-around for London trading using third parties.
For the past month gold has been range trading. It now appears to be getting ready to potentially break out even if there is a bit more up and down to do. Over $1,960 would signify a breakout with first confirmation coming over $1,967, but we really need to break and hold over $2,000 to suggest new highs. $1,900/$1,920 continues to be support and below $1,885 the rally might be over.
Source: www.cotpricecharts.com
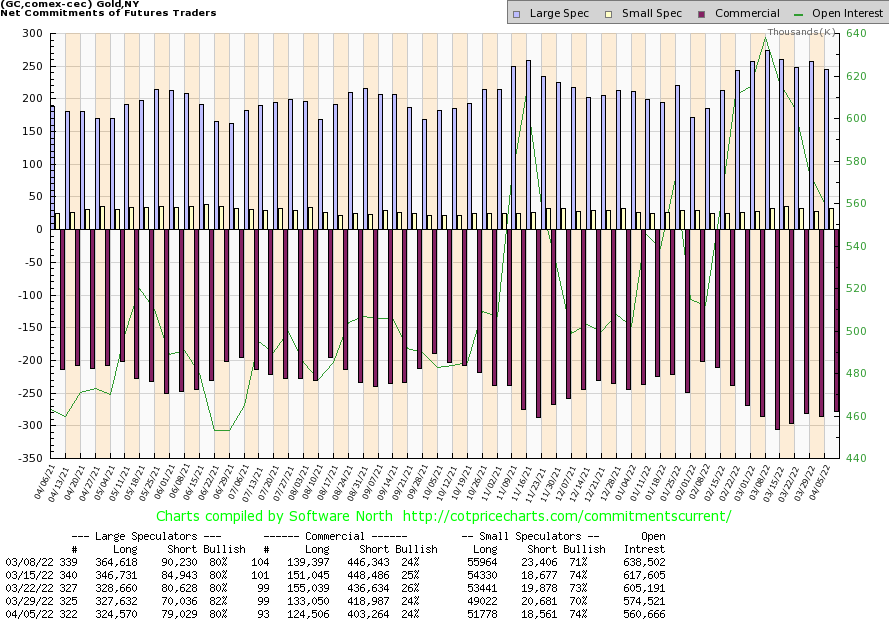
The commercial COT (bullion companies and banks) for gold was steady at 24% this past week. Both long and short open interest fell with longs down about 9,000 contracts and shorts down over 15,000 contracts. The large speculators COT (hedge funds, managed futures, etc.) dropped to 80% from 82% as they shed about 3,000 longs while the short position rose roughly 9,000 contracts. With the large speculators suddenly getting negative, we tend to favour the commercials and view this report as at least mildly bullish. Although, we confess, we wish it were higher for the commercials over 30%.
Source: www.stockcharts.com
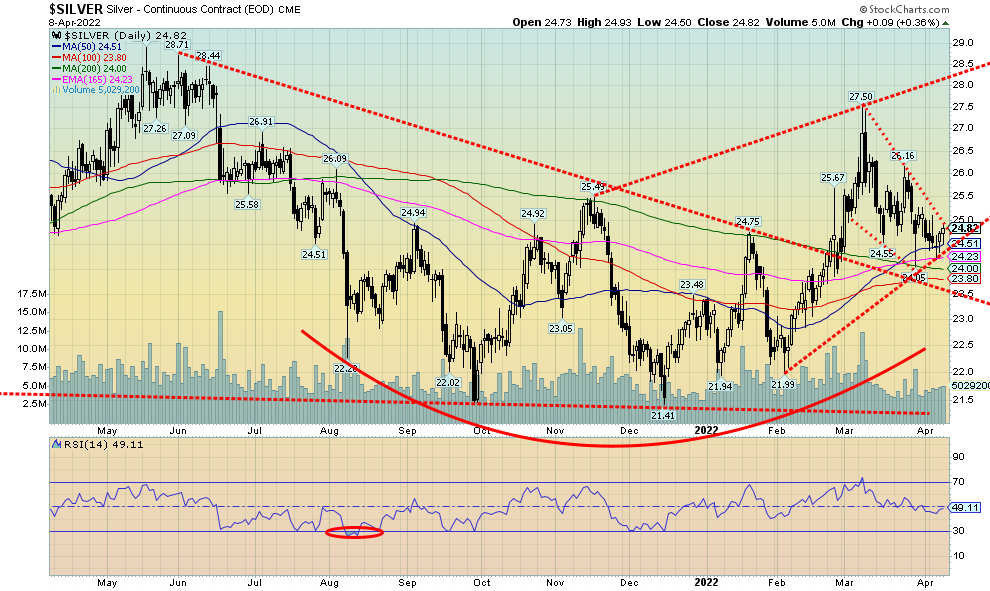
Silver eked out a gain of 0.7% this past week as it, for the most part, continues to underperform vs. gold. Normally one wants to see silver lead. So far in 2022 silver is up only 6.3% vs. gold up 6.4%. But silver over the past several days appears to be finding support around its 50-day MA and even down to the 200-day MA. We also appear to have been forming a large pennant formation which should ultimately be bullish. It could be on the cusp of a breakout. A move back over $25 would start to confirm that, but we need a move over that recent high of $26.16 to fully confirm the breakout. The pennant formation has potential targets up to at least $28.50 with higher levels possible. So far, $24 appears to be good support and we’d continue to use that level as key support. A breakdown under that level instead could target silver down to test the February lows near $22.
Source: www.cotpricecharts.com
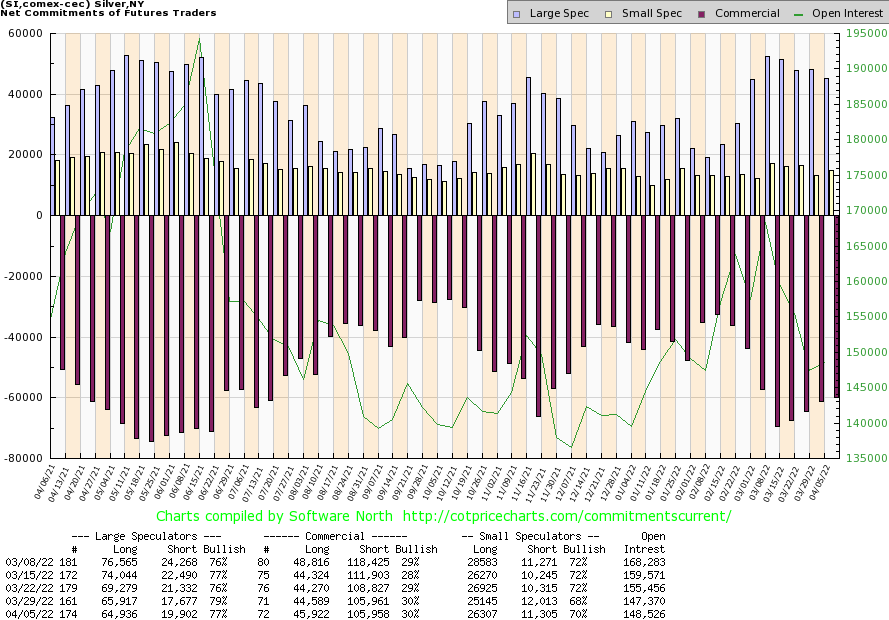
The silver commercial COT was steady this past week at 30%. Little changed as long open interest rose a small 1,400 contracts while short open interest was flat. The large speculators COT slipped to 77% from 79% as they dropped about 1,000 longs and added over 2,000 shorts. Open interest on the week rose just over 1,000 contracts on an up week. This report remains mildly bullish.
Source: www.stockcharts.com
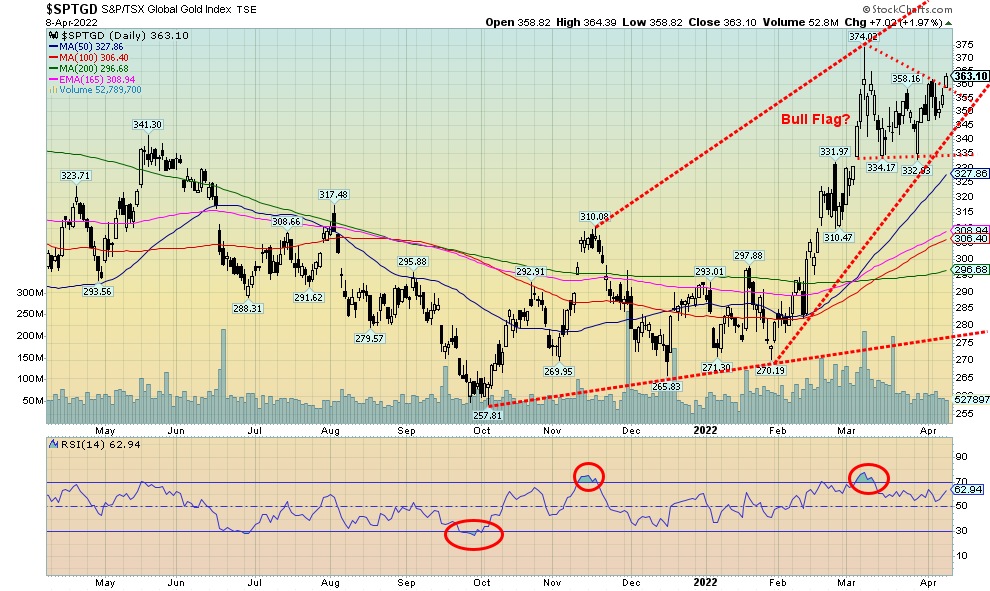
The gold stocks enjoyed a positive week with the TSX Gold Index (TGD) gaining 0.8% and the Gold Bugs Index (HUI) up about 0.4%. Relative to the broader market as represented by the major indices, gold stocks are outperforming. The recent surge in gold prices has also seen the gold stocks rise. The gold stocks are outperforming, which is what one wants to see in a gold bull market. To date, while gold is up 6.4% on the year and silver up 6.3% the TGD is up 24.3% and the HUI up 24.6% thus far in 2022. That’s a nice turnaround from 2021 when they underperformed.
But recognition of this is not fully registering in the market. The preponderance of recommendations coming out of the investment shows, business television, and even in the newspapers is big cap stocks, tech stocks and dividend paying value stocks. Gold stocks fell hard following the top seen in August 2020. The TGD dropped 38.2% between August 2020 and the low in September 2021. The HUI fell 60%. The zenith for the gold stocks was actually way back in August/September 2011. The TGD is still down 20% from that high and the HUI down almost 50%. The gold stocks have a long way to fully recover still. And it’s been that huge underperformance that has kept investors away.
However, both the HUI and the TGD appear to have broken out of long downtrends. And if we look at numerous individual stocks, we see a similar pattern. Two good representatives in ETF form for the gold stocks are the GDX (VanEck Vectors Gold Miners) and the GDXJ (VanEck Vectors Junior Gold Miners). Since the invasion of Ukraine on February 24 the TGD has gained about 17% and the HUI 18.5%. That date happened to
register a low for both. Now we appear to be breaking out of the flag or pennant formation. If that’s correct, then the TGD has targets to over 400. Support appears to be down to 335. Below that, lower prices could be seen. The current run reminds us about the strong runs in 2016 and 2020. Back then the TGD gained 148% in 2016 over seven months and in 2020 140% over five months.
Source: www.stockcharts.com
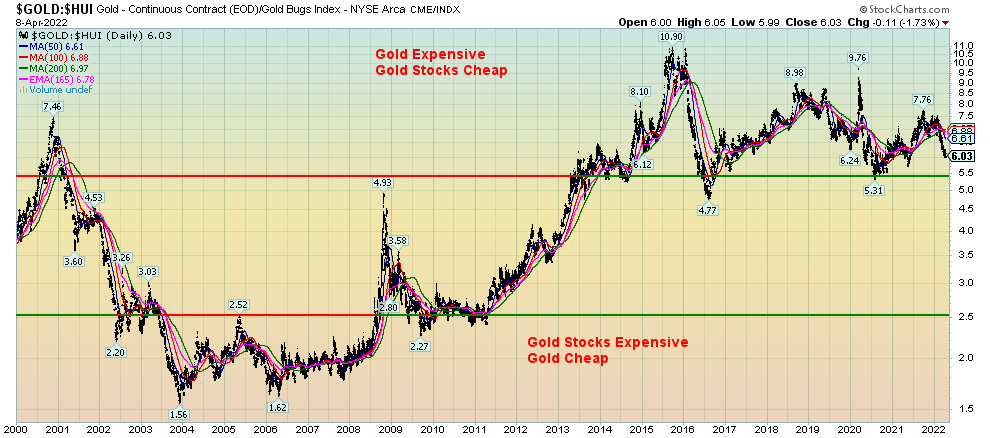
The Gold/HUI ratio is our best indicator to tell us whether gold stocks are cheap or expensive relative to the price of gold. For the past decade, gold stocks have remained relatively cheap compared to the price of gold. The zenith was hit in late 2015 when the Gold/HUI ratio hit 10.90. It was at the time a generational buying opportunity for gold stocks as the ratio collapsed to 4.77 over the next several months. But since then, gold stocks have once again remained relatively cheap to gold. In March 2020 during the COVID crash the ratio jumped to 9.76, the highest level since 2015. Since peaking at 7.76 back in September 2021, the ratio has fallen now to 6.03. Gold stocks are still cheap, but we won’t know they are going to go on a good run until they take out those lows of 2016 and 2020. The last time there was good run was from roughly 2000 to 2004 when the ratio fell quickly from 7.46 to 1.56 in 2004. The entire pattern from 2013 until now appears to us as a large topping pattern. What is needed is the breakdown under those previously mentioned lows. Then a strong run could get under way for the gold stocks vs. gold. While investors should hold bullion, some may wish to hold a good position in gold stocks as well. Just remember that, unlike gold itself, gold stocks do have liability.
Source: www.stockcharts.com
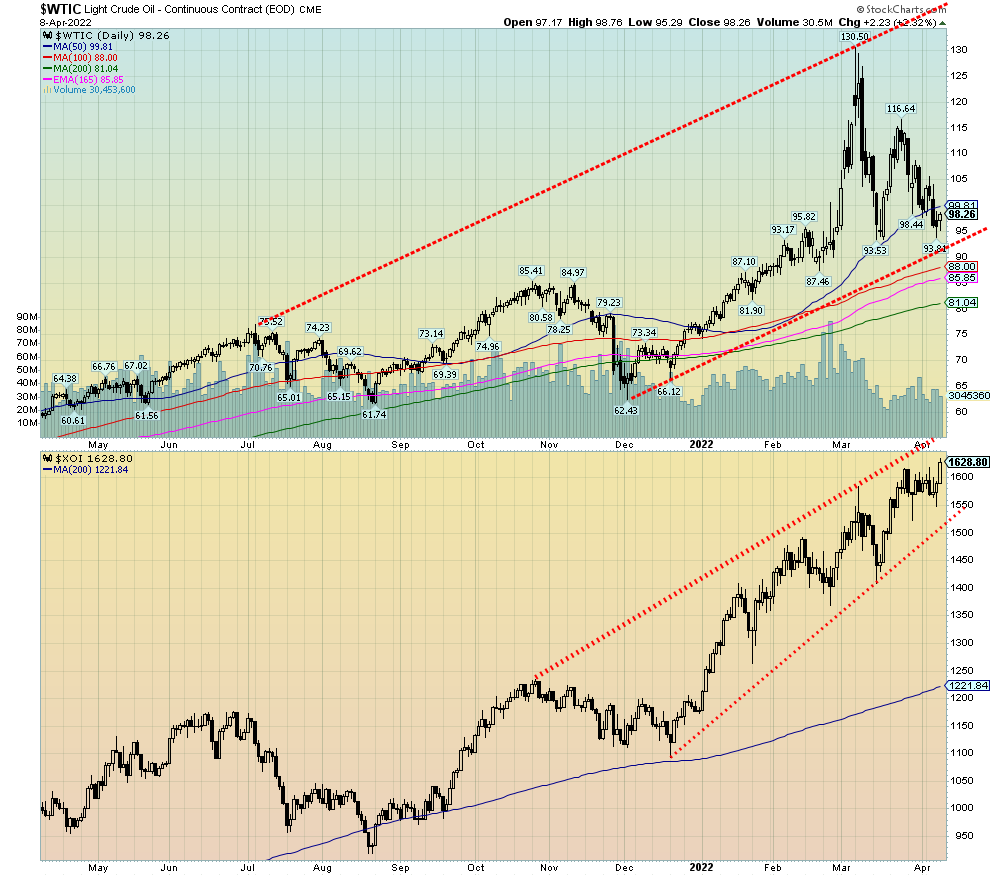
For the second consecutive week WTI oil fell, this time down 1.0%. That was following a bounce-back on Friday that saw WTI oil rise 2.3%. WTI oil closed under $100. Brent crude lost 1.9% on the week but managed to hold above $100. Natural gas (NG) continued its recent rise, hitting fresh 52-week highs and gaining 9.8% to close over $6. The energy stocks also enjoyed a good week as both the ARCA Oil & Gas Index (XOI) and the TSX Energy Index (TEN) hit fresh 52-week highs. The XOI was up 2.4% while the TEN gained 2.3%.
This time, the catalyst for the drop in oil prices was the International Energy Agency (IEA) announcing they would release some 60 million barrels of oil over the next six months. Together with the announcement the
previous week that the US would release from their strategic reserves 180 million barrels over six months brings the total over six months to 240 million or roughly 1.3 million bpd. To put that in perspective, Russia exports some 4.7 million bpd of which roughly 49% goes to the EU. That works out to 2.3 million bpd. That still leaves the EU short at least 1 million bpd and the window is only good for six months. And the release from the IEA and the SPR are not necessarily all going to help the EU. Helping things is the slowdown in China due to the COVID rise as demand has slipped. We note that, with the U.S. releasing 180 million barrels, it is roughly one-third of their total reserves.
Russian oil accounts for some 25% of Germany’s imports, down from 35% before the invasion. Gas imports are also down to 40% from 55%. Coal down to 25% from 50%. Germany has heavy reliance on Russian energy so it is going to be much harder for Germany to wean itself off without resorting to rationing and other methods to cut demand. It could also easily tip Germany into recession which in turn would have a negative impact on all of the EU since Germany is the leading economy.
The EU is also planning to ban coal exports from Russia. Except that won’t take place for at least five months to give everyone time to try and build some reserves. U.S. crude oil stocks are at their lowest level in years, latest down to 416 million barrels. A year ago, they were 498 million barrels which was also a low level. This is below the 5-year average. Gasoline stocks are also starting to fall, although that’s a seasonal thing and they remain at mostly normal 5-year average levels—for now.
The cost to oil companies for exiting Russia is expensive. Shell has announced they will take a $5 billion hit in Q1. Oil companies have been taking major hits in the billions to exit Russia.
WTI oil continues in its bull channel, although it is now down near the bottom of that channel. A breakdown under $90 could lead to further losses, taking WTI down to better support near $80/$81. A rebound that takes WTI back up over $105 could signal the end of this corrective wave. From that low in August 2021 at $61.74 it appears this wave might be a fourth wave which suggests a potential fifth wave to the upside to come. Following that top at $130.50, WTI fell in three waves, suggesting this is nothing more than a correction. This last wave down appears to have unfolded in five waves, typical of a C wave. Thus, a move over that last high near $105 could signal the end of the correction. Over $116.64 and a new uptrend could be confirmed. Taking out the highs of $130.50 could then suggest a move as high as $165/$170.
Despite all the recent maneuvers to lower the price of oil, the oil bull does not yet appear to be over. We note that, despite the rise in oil prices over the past year, the oil rig count has gone up only a little bit and drilling on new lands for new sources is not really underway. Why producers are not putting more oil rigs in is not known, and major environmental concerns, along with regulations, are keeping drills out of sensitive areas.
Copyright David Chapman, 2022
Copyright David Chapman, 2022
|
GLOSSARY
Trends
Daily – Short-term trend (For swing traders) Weekly – Intermediate-term trend (For long-term trend followers) Monthly – Long-term secular trend (For long-term trend followers) Up – The trend is up. Down – The trend is down Neutral – Indicators are mostly neutral. A trend change might be in the offing. Weak – The trend is still up or down but it is weakening. It is also a sign that the trend might change. Topping – Indicators are suggesting that while the trend remains up there are considerable signs that suggest that the market is topping. Bottoming – Indicators are suggesting that while the trend is down there are considerable signs that suggest that the market is bottoming. |
Disclaimer
David Chapman is not a registered advisory service and is not an exempt market dealer (EMD) nor a licensed financial advisor. He does not and cannot give individualised market advice. David Chapman has worked in the financial industry for over 40 years including large financial corporations, banks, and investment dealers. The information in this newsletter is intended only for informational and educational purposes. It should not be construed as an offer, a solicitation of an offer or sale of any security. Every effort is made to provide accurate and complete information. However, we cannot guarantee that there will be no errors. We make no claims, promises or guarantees about the accuracy, completeness, or adequacy of the contents of this commentary and expressly disclaim liability for errors and omissions in the contents of this commentary. David Chapman will always use his best efforts to ensure the accuracy and timeliness of all information. The reader assumes all risk when trading in securities and David Chapman advises consulting a licensed professional financial advisor or portfolio manager such as Enriched Investing Incorporated before proceeding with any trade or idea presented in this newsletter. David Chapman may own shares in companies mentioned in this newsletter. Before making an investment, prospective investors should review each security’s offering documents which summarize the objectives, fees, expenses and associated risks. David Chapman shares his ideas and opinions for informational and educational purposes only and expects the reader to perform due diligence before considering a position in any security. That includes consulting with your own licensed professional financial advisor such as Enriched Investing Incorporated. Performance is not guaranteed, values change frequently, and past performance may not be repeated.
About the author


Website: https://www.enrichedinvesting.com
Disclaimer: David Chapman is not a registered advisory service and is not an exempt market dealer (EMD) nor a licensed financial advisor. We do not and cannot give individualised market advice. David Chapman has worked in the financial industry for over 40 years including large financial corporations, banks, and investment dealers. The information in this newsletter is intended only for informational and educational purposes. It should not be considered a solicitation of an offer or sale of any security. The reader assumes all risk when trading in securities and David Chapman advises consulting a licensed professional financial advisor before proceeding with any trade or idea presented in this newsletter. David Chapman may own shares in companies mentioned in this newsletter. We share our ideas and opinions for informational and educational purposes only and expect the reader to perform due diligence before considering a position in any security. That includes consulting with your own licensed professional financial advisor.