Our first report of 2025. Chaos and volatility remain our themes.
We look at a number of issues. Interest rates, fund manager cash levels, complacency, recession watch, the performance of the MAG7 and Bitcoin, stock indices, gold and commodities, currencies, and cryptos. After two strong up years, the stock markets appear to be headed for headwinds this year. The so-called Santa Claus Rally (SCR) saw markets fall but gold, energy, and commodities rose. We await the other two parts of the January trifecta - the first five days (ends Jan 8) and the January barometer (ends Jan 31).
Oddly the best-performing stock market index over the past week was the TSX Venture Exchange (CDNX). A signal that this could be the year for the junior energy, gold, and commodities markets? For example, Dynacor Group, an international gold ore industrial corporation servicing ASMs, announced a higher selling price of gold and expanded sales, increased its dividend, and is held in the Enriched Capital Conservative Growth Strategy.* We await. Also up well this past week was oil. Is something amiss?
The cryptocurrency market has been in a bubble along with the MAG7. They also could be the key to what the market does in 2025. Crypto is highlighted by the absurdity of a meme crypto called Fartcoin.
This coming week sees the certification of the recent U.S. election. Four years earlier we saw an insurrection. Before the certification happens the U.S. has already been demonstrating chaos and dysfunction. Similar dysfunction is playing out in many other countries as well. Two alleged terror attacks also highlighted the week.
We start the first full week of the new year with the December job numbers out this coming week for both Canada and the U.S. next Friday, Jan 10. Expectations are for Canada to have 11 thousand new jobs and the unemployment rate unchanged at 6.8%. For the U.S. the expectation is 200 thousand jobs and the unemployment (U3) to rise to 4.3% from 4.2%. It could be a telling week.
Have a great 2025 and a great week!
DC
* Reference to the Enriched Capital Conservative Growth Strategy and its investments, celebrating a 6-year history of strong growth, is added by Margaret Samuel, President, CEO, and Portfolio Manager of Enriched Investing Incorporated, who can be reached at 416-203-3028 or msamuel@enrichedinvesting.com
Chaos and volatility. That’s what we see in store for 2025, especially in politics. The election of U.S. President Donald Trump already ensures that. Open threats to trade, immigrants, and the budget are the potential catalysts. Whether any of them come to fruition is beside the point. Trump’s threats alone before he is even inaugurated have already sent countries scrambling on how they might counter his tariffs. As well, immigrants, whether they are illegal or not, are already trying to figure out how to either stay under the radar or actually leave for elsewhere. Threats to cut the budget by $2 trillion are causing considerable unease throughout the U.S. civil service. And need we mention trillion-dollar tax cuts and deregulation, whether for good or ill?
As The Economist points out in an article dated January 1, 2025 (“What Investors Expect from President Trump”), they are uneasy but they also don’t expect the worst to take place. Some tariffs may be enforced, but what will the retaliation be? Deportations may not be enough to upset the labor market, but restrictions on future immigration might have an impact on inflation and the labour market. There may be cuts, but not to the extent of $2 trillion, which would spark cuts to the untouchable Social Security, Medicare/Medicaid, and defense that, along with interest on the debt, represents over 70% of the U.S. budget. Potential deregulation and tax cuts could be inflationary but also spark another big stock market rally.
One could say the new year is starting off with a bang of the wrong kind with the truck attack in New Orleans leaving 14 dead and many injured. Also, the Tesla Cybertruck blowing up in front of the Trump Las Vegas Hotel is a touch of irony. Fortunately, the death toll and injury list were small. In both cases, the perpetrators were U.S. citizens and the U.S. military. Is this a new level of risk as we go into 2025?
The new year is also off with a bang of a different sort as the stock market, gold, the US$ Index, and oil all rise. Although the stock market faded later. The so-called Santa Claus rally finished Friday down. The Santa Claus rally is part of the January indicator trifecta. The others are the first five days (ending Wednesday, January 8) and the January barometer (ending January 31). If all three are up, the odds heavily favour an up year. Their predictability is fully reinforced if all three end the same way.
During Trump’s last tenure, the stock market rose (S&P 500) 70% while gold was up 55%. So far, under Biden, the stock market is up 53% and gold is up 42%. Thanks to the potential for the original Trump tax cuts to be extended plus any new tax cuts, stocks could once again do well under Trump. Gold rises because of all of the current Trump proposals on tariffs, deportations, tax cuts, etc. giving headwinds to the yellow metal, a long-time safe haven.
A reminder that both Trump and Biden added substantially to the debt, with U.S. federal debt up $8.2 trillion under both Trump and Biden. U.S. GDP rose $3.4 trillion under Trump and is up $6.9 trillion under Biden. The total employed under Trump fell by 2.4 million, thanks to the timing of the pandemic recession, while the total employed under Biden rose by 11.3 million.
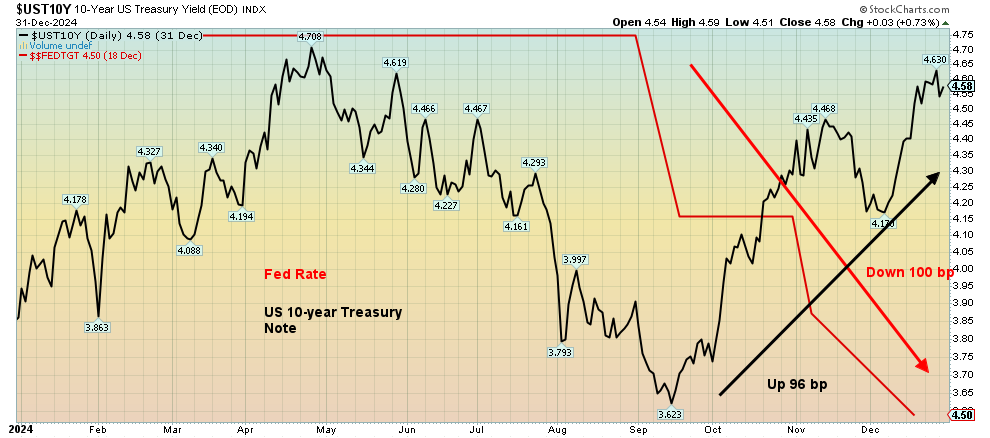
One of the signs of trouble we are seeing going forward is that, while the Fed has cut the Fed rate by 100 bp, the U.S. 10-year treasury note has jumped 96 bp. The Fed controls the short end of the market but the long end is controlled by the bond market, and what they are seeing is that inflation could raise its head once again.
This is not unusual as we have noted that, during the 1970s, there was an initial bout of inflation followed by a sharp drop in it as the Fed tightened to combat rising inflation. A sharp recession in 1973–1975 helped bring it down. But easy money policies and low interest rates once again allowed inflation to rise even more a second time into 1980. It took Fed Chairman Paul Volcker raising rates to 21% to bring down inflation. It also sparked the steep 1980s recession. A reminder that over $3 trillion of U.S. federal debt comes due in 2025, plus whatever is added to the debt which will most likely be at least another $2 trillion (the U.S. budget deficit). Raising the funds could meet severe headwinds and rising interest rates. Interest on the debt now exceeds $1.1 trillion annually. That’s more than is spent on defense.
Source: www.stockcharts.com
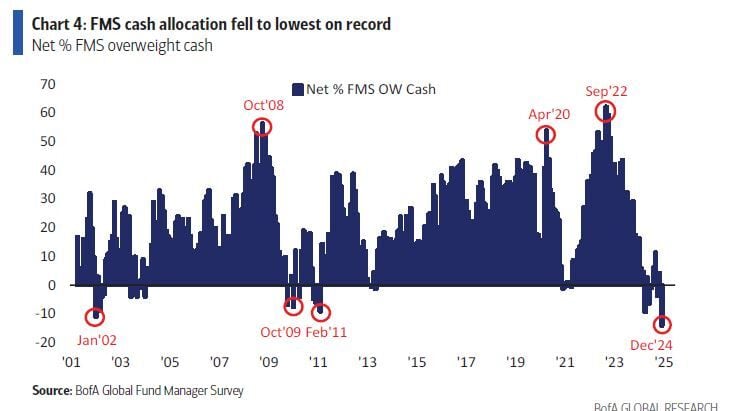
The U.S. and Canada are facing headwinds in 2025 with rising problems in the commercial real estate market and rising delinquencies and defaults in consumer credit card loans. Curiously, fund managers are holding not only the lowest level of cash in 13 years but the lowest level this century. Complacency is the by-word. The wide expectation is that the Fed is successfully engineering a soft landing. A danger sign is that Trump does not hesitate to fight with the Fed Chairman and tries to dictate to the Fed what its policies should be.
Bank of America Survey Cash Allocation 2000–2024
Source: www.bloomberg.com, www.bofa.com
Banks have continually upped their reserves for loan losses in 2024. Banks are in better shape today than they were before the financial crisis of 2008, largely because of stricter capital requirements and stress tests. Could that help prevent a banking crisis à la 2008? It could, but promises from the incoming Trump administration could undo some of that protection through deregulation. The stock market won’t have a collapse without a banking crisis to trigger it. Not surprising was that the Great Depression, the 1970s recession, the 1980s recession, and the Great Recession 2007–2009 were all triggered by a banking crisis and bank failures. We could go back even further and find a banking crisis at the heart of an economic crisis.
Irrespective of this, a recession appears to be in the cards. We haven’t had a full-blown recession since the 2007–2009 Great Recession that was sparked by the financial crisis of 2008. We can’t help but note that the German economy is slowing down into a recession and China’s economy is also faltering. The EU is not being helped by the blockage of the gas pipeline from Russia by Ukraine. The natural gas flows primarily to eastern European states and Austria. While Russia no doubt will find other buyers for their gas, the impacted EU states will have to pay much higher prices for their gas. The region is already under a recessionary warning, with several eastern European states already in a recession. Both Germany and the U.K. are also teetering on the edge of a recession. Blockage of the Russian gas may only exacerbate the situation. EU natural gas at the Dutch Hub recently hit $50, the highest level in over a year.
The U.S. could soon follow, despite the current rosy numbers coming out and a labour market that is still well-employed. The Goldilocks Economy? The pandemic recession of 2020 was steep, causing all sorts of supply disruptions and deepening of divisions, but that has been the only recession since 2009. We had slowdowns but no recession during the EU/Greek debt crisis of 2011 that lingered through 2016. Trump’s initial trade wars triggered a slowdown but no recession in 2018. Stock market declines were seen in 2011, 2015–2016, 2018, 2020, and 2022. According to the four-year stock market cycle, a stock market decline in 2024 might have occurred but the range for the cycle is 3–5 years. By that measurement, a stock market decline might now be expected for 2025.
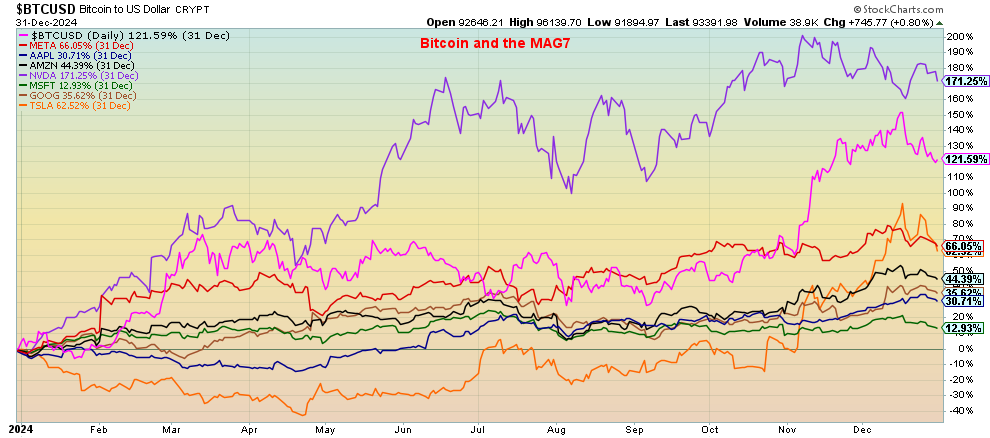
The story of 2024 was the MAG7: i.e. Meta, Apple, Amazon, Microsoft, Google, Nvidia, and Tesla. Add in Bitcoin and what you have is really the market of 2024. Gains were: Bitcoin 122%, Meta 66%, Apple 31%, Amazon 44%, Netflix 83%, Google 36%, Microsoft 12%, Nvidia (the big winner) 171%, and Tesla 63%. Ten stocks—the MAG7 plus Netflix +83%, Broadcom +109%, and Snowflake -22% (the only loser)—make up the ten that accounted for 59% of the gains for the S&P 500 since the market low in 2022. The question is, has the U.S. become an oligarchy? Many believe so because of the dominance of these companies, along with their increasing political power. Given that Tesla’s Elon Musk has become a part of the U.S. administration plus the march of U.S. billionaires mostly from the MAG7, the question becomes more serious. Going forward, will the tax cuts, deregulation, and more benefit primarily the billionaires and the MAG7?
The absurdity of the cryptocurrency market is highlighted by the existence of a crypto called Fartcoin. Fartcoin has a market cap of $1.4 billion and is up 2,800% since it got underway in 2022. In total, the cryptocurrency market today is $3.5 trillion. Bitcoin, of course, is the best-known and the leader with a market cap of $1.9 trillion. The existence of Fartcoin outdoes Dogecoin which now has a market cap of over $56 billion. Fartcoin, like many cryptocurrencies, is a meme coin that like most, if not all cryptos, has no value and no use. For comparison’s sake, the gold market has a market cap of roughly $15 trillion. Gold does have value and can even be used. The crypto market is currently flashing greed to extreme greed.
Bitcoin and the MAG7 Performance 2024
Source: www.stockcharts.com
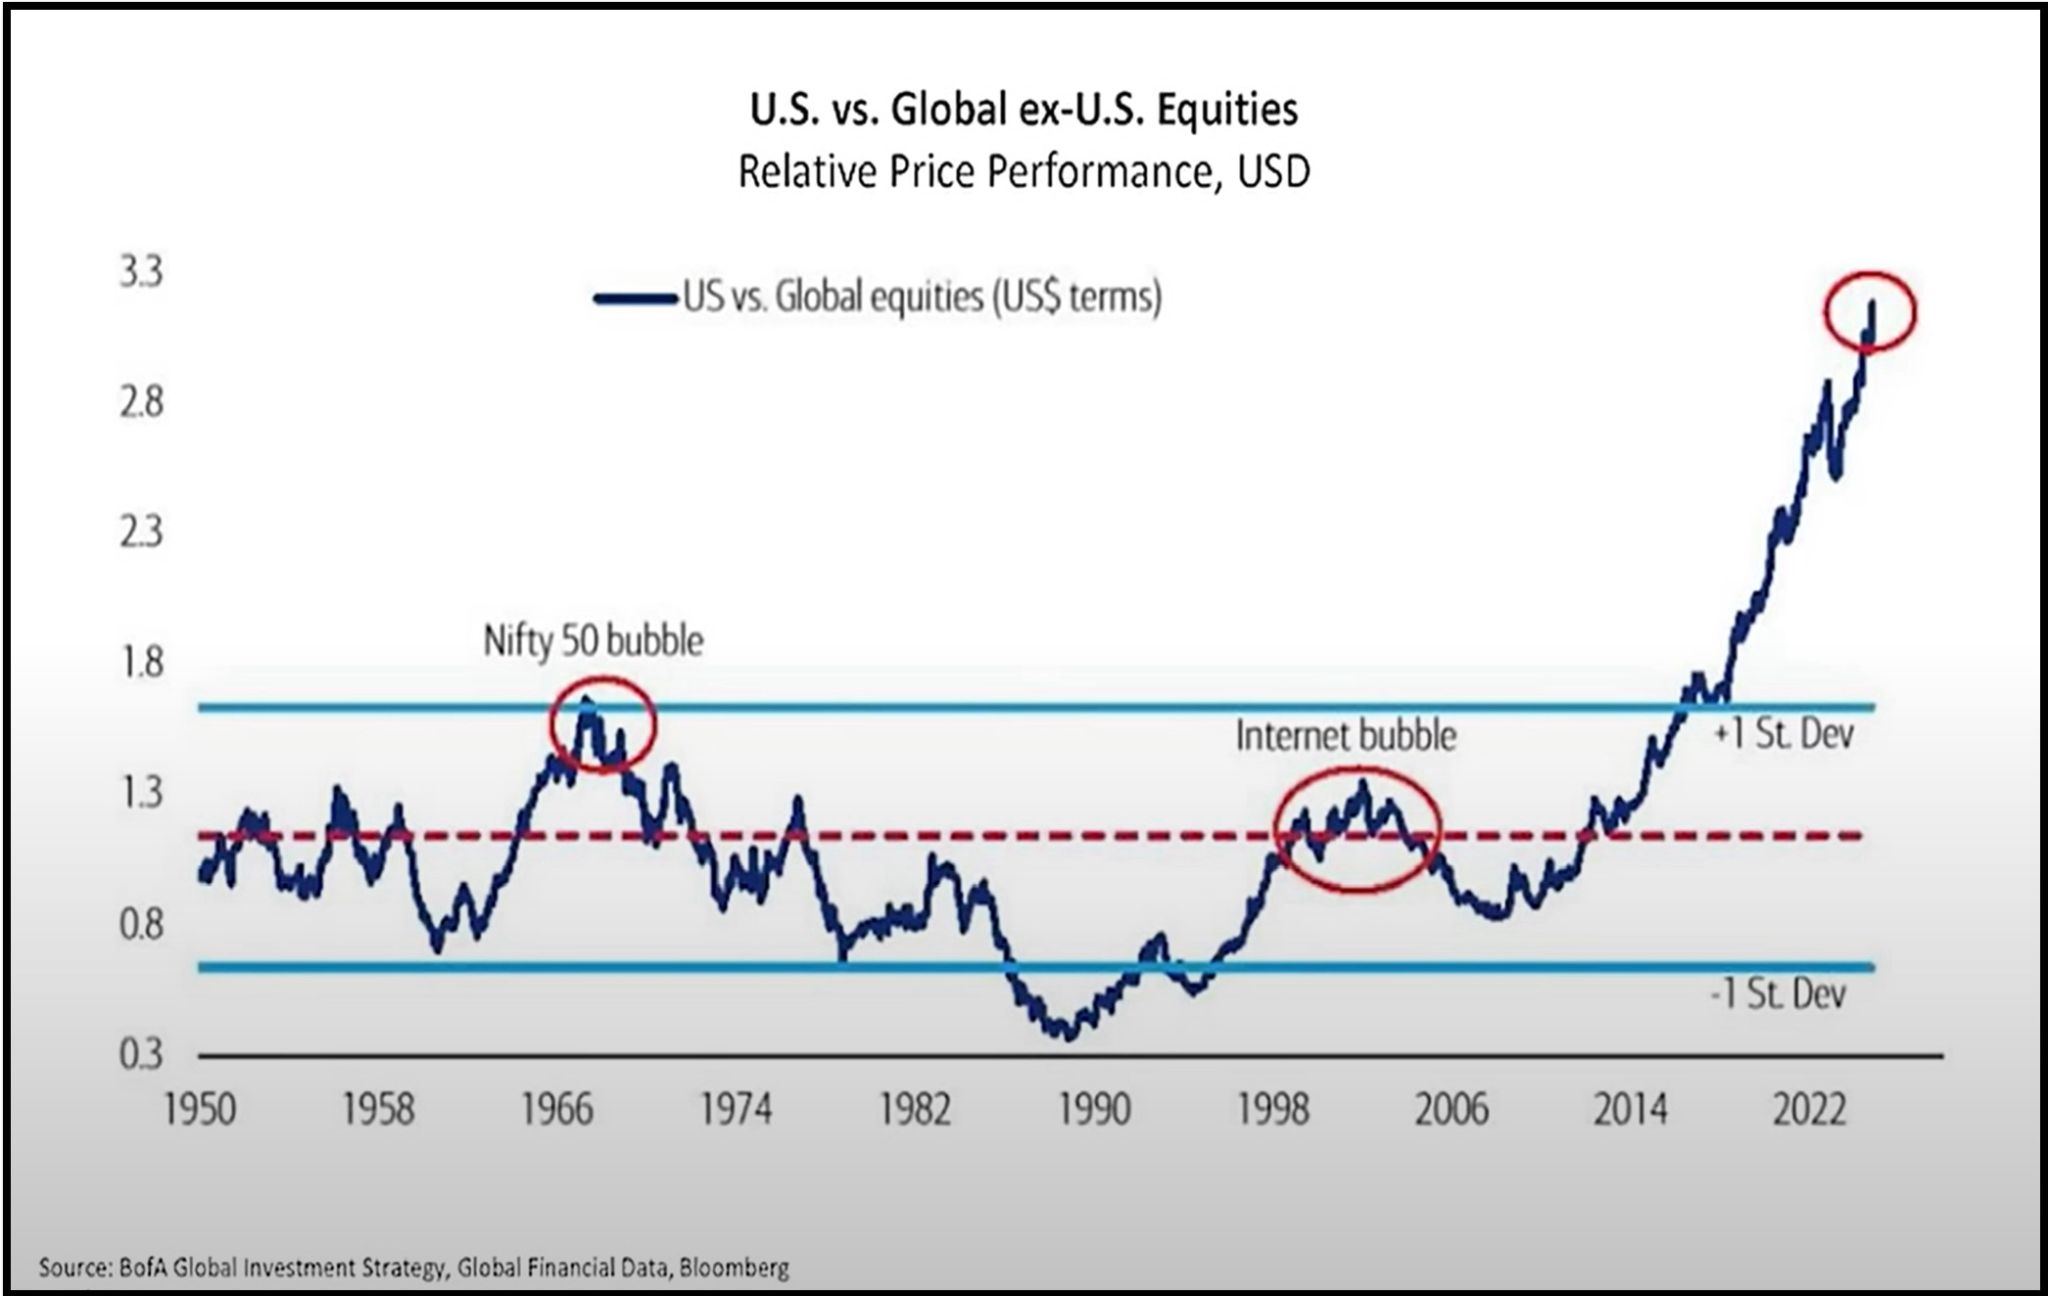
It is interesting to note that U.S. equities have outperformed their foreign counterparts by a wide margin. The chart below shows that. It is interesting to note the other two times in the past 50 years that U.S. stocks outperformed their foreign counterparts by a good margin was the Nifty 50 bubble that occurred in 1972, along with the internet bubble of the 1990s. Both bubbles eventually burst, only to be followed by a steep recession. Today we have the MAG7 and Bitcoin (crypto) bubbles. The current bubble is at levels never seen before.
Source: www.business.bofa.com, www.globalfinancialdata.com, www.bloomberg.com, www.crescat.net
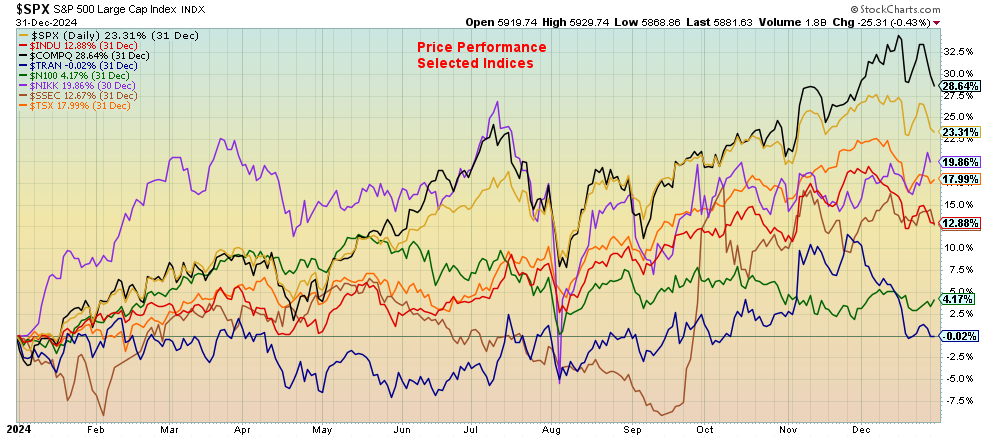
So how did markets perform in 2024? It was good for some but not as good for others. U.S. stock indices did well, with the S&P 500 up 23%, the Dow Jones Industrials (DJI) gaining 13%, while the NASDAQ was the leader, up about 29%. The Dow Jones Transportations (DJT) faltered, ending the year flat. Elsewhere, the EuroNext gained only 4%, the Tokyo Nikkei Dow (TKN) was up about 20%, China’s Shanghai Index was up about 13%, and Canada’s TSX Composite gained 18%. Can we repeat this in 2025? The current start to the year doesn’t bode well.
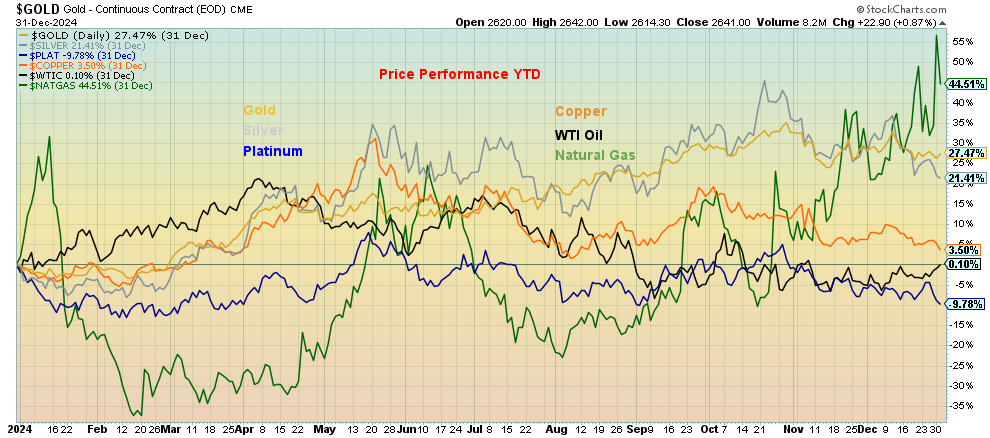
Commodities were decidedly mixed. Natural gas (NG) was the big winner for 2024, up 44.5%. NG at the EU Dutch Hub gained 56.0%. Others, we note, were gold +27.5%, silver +21.4%, copper +3.5%, oil +0.1%, while platinum was a loser, down 9.8%. Palladium was also a loser, down 20.2%. Gold stock indices were positive with the Gold Bugs Index (HUI) up 13.3% and the TSX Gold Index (TGD) up 18.4%. Note that the gold stock indices lagged both gold and silver. Energy indices didn’t fare as well. While the TSX Energy Index (TEN) gained 10.4%, the ARCA Oil & Gas Index (XOI) fell 5.3%. Commodities once again should be at the forefront in 2025, with potential upward pressure on energy prices and continued positive upmoves from the precious metals.
Selected Indices Performance 2024
Source: www.stockcharts.com
Selected Commodities Performance 2024
Source: www.stockcharts.com
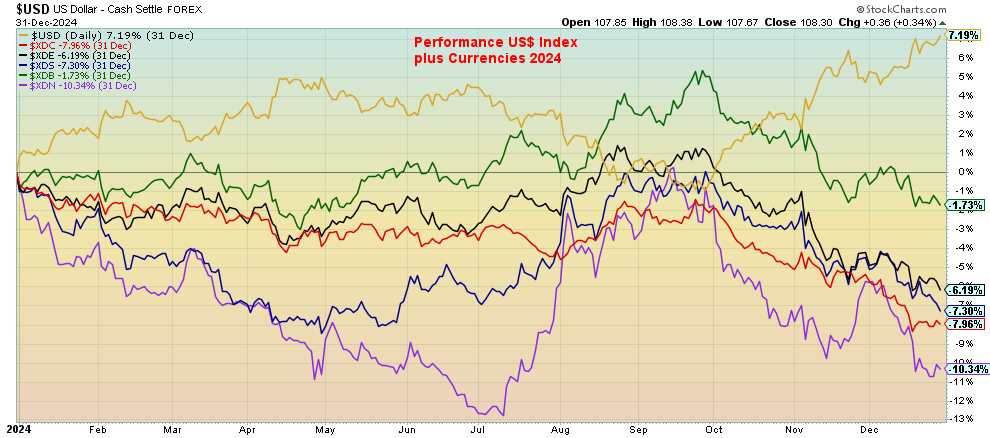
Noteworthy in 2024 was the performance of the US$ Index. While the US$ Index was gaining 7.2% in 2024, the euro fell 6.2%, the Swiss franc dropped 7.3%, the pound sterling was down 1.7%, and the Japanese yen was off 10.3%. The Canadian dollar fell about 8.0%. Given wars, economic problems, and more, funds flowed into the U.S., sparking demand for U.S. dollars. Funds primarily went into the stock market as the investors feared U.S. bonds, given the massive size of the U.S. Federal debt (123% of GDP) and the potential for even larger increases in debt. Despite the massive flow into U.S. dollars and the U.S. stock market, gold did exceptionally well. If the U.S. dollar is rising, gold normally falls moving inversely to the US$. The same occurs with interest rates as long-term U.S. interest rates rose despite the Fed cutting rates. Gold, instead of falling against rising U.S. interest rates rose and a US$ Index rose instead. The 10-year U.S. treasury rose in yield by 18.3% (prices that move inversely to yields fell 4.1% in 2024) before considering the coupon. Gold rose 27.5% in 2024. Gold is a currency and a contrarian signal.
Performance of the US$ Index and Currencies 2024
Source: www.stockcharts.com
If you thought 2024 was a year of chaos, get ready for 2025—an overvalued stock market led by the MAG7, ongoing wars in Russia/Ukraine, Israel/Gaza, and Sudan, the potential for further terrorist attacks, threats of trade wars and more from the incoming Trump administration, political disintegration in numerous countries with incumbent governments under pressure and a growing rise of alt-right parties. Political dysfunction is seen in a number of EU countries, particularly Germany, France, and even the U.K. Canada is also experiencing political dysfunction with a looming election sometime in 2025 and chaos with the ruling Liberal party. South Korea has gone through impeachments and attempts to arrest the former president that have failed. Political dysfunction reigns and chaos could most likely follow. Is this time different? No.
Is there a safe haven? Normally we’d say bonds, but as we have noted, the longer end of the yield curve has backed up even as the short end falls. That’s a potentially negative sign for inflation going into 2025. Bonds will not be helped by rising inflation from potential trade wars and escalating wars between countries, sending energy prices higher. That leaves only gold, silver, and selected commodities that could benefit from the turmoil and volatility. Cash is also safe. But as we have noted, currencies have fallen in value and inflation eats away at cash.
All the best in 2025, but the keywords remain chaos and volatility.
Markets and Trends follow shortly.
Copyright David Chapman 2025
Markets & Trends
|
|
|
|
% Gains (Losses) Trends |
|
||||
|
|
Close Dec 31/24 |
Close Jan 3/25 |
Week |
YTD |
Daily (Short Term) |
Weekly (Intermediate) |
Monthly (Long Term) |
|
|
Stock Market Indices |
|
|
|
|
|
|
|
|
|
S&P 500 |
5,881.63 |
5,942.47 |
(0.5)% |
1.0% |
up |
up |
up |
|
|
Dow Jones Industrials |
42,544.22 |
42,732.13 |
(0.6)% |
0.4% |
up |
up |
up |
|
|
Dow Jones Transport |
16,030.66 |
16,007.02 |
(0.2)% |
0.7% |
up |
up |
up |
|
|
NASDAQ |
19,310.79 |
19,621.68 |
(0.5)% |
1.6% |
up |
up |
up |
|
|
S&P/TSX Composite |
24,796.40 |
25,073.54 |
1.1% |
1.4% |
up |
up |
up |
|
|
S&P/TSX Venture (CDNX) |
597.87 |
623.29 |
4.3% |
4.3% |
up |
up |
neutral |
|
|
S&P 600 (small) |
1,408.17 |
1,422.22 |
0.4% |
1.0% |
up |
up |
up |
|
|
MSCI World |
2,304.50 |
2,301.37 |
(0.5)% |
(0.1)% |
down |
down |
up |
|
|
Bitcoin |
93,467.13 |
98,270.55 |
4.0% |
5.1% |
up |
up |
up |
|
|
|
|
|
|
|
|
|
|
|
|
Gold Mining Stock Indices |
|
|
|
|
|
|
|
|
|
Gold Bugs Index (HUI) |
275.58 |
284.73 |
2.2% |
3.3% |
down |
down (weak) |
up |
|
|
TSX Gold Index (TGD) |
336.87 |
349.50 |
3.5% |
2.8% |
neutral |
neutral |
up |
|
|
|
|
|
|
|
|
|
|
|
|
% |
|
|
|
|
|
|
|
|
|
U.S. 10-Year Treasury Bond yield |
4.58% |
4.60% |
(0.7)% |
0.4% |
|
|
|
|
|
Cdn. 10-Year Bond CGB yield |
3.25% |
3.26% |
(1.5)% |
0.3% |
|
|
|
|
|
Recession Watch Spreads |
|
|
|
|
|
|
|
|
|
U.S. 2-year 10-year Treasury spread |
0.33% |
0.31% |
3.3% |
(6.1)% |
|
|
|
|
|
Cdn 2-year 10-year CGB spread |
0.30% |
0.32% |
6.7% |
6.7% |
|
|
|
|
|
|
|
|
|
|
|
|
|
|
|
Currencies |
|
|
|
|
|
|
|
|
|
US$ Index |
108.44 |
108.92 (new highs) |
1.1% |
0.4% |
up |
up |
up |
|
|
Canadian $ |
69.49 |
69.22 (new lows) |
(0.3)% |
(0.4)% |
down |
down |
down |
|
|
Euro |
103.54 |
103.06 (new lows) |
(1.2)% |
(0.5)% |
down |
down |
down |
|
|
Swiss Franc |
110.16 |
110.04 |
(0.8)% |
(0.1)% |
down |
down |
neutral |
|
|
British Pound |
125.11 |
126.23 |
(1.1)% |
(0.7)% |
down |
down |
down (weak) |
|
|
Japanese Yen |
63.57 |
63.55 |
0.4% |
flat |
down |
down |
down |
|
|
|
|
|
|
|
|
|
|
|
|
|
|
|
|
|
|
|
|
|
|
Precious Metals |
|
|
|
|
|
|
|
|
|
Gold |
2,641.00 |
2,654.70 |
0.9% |
0.5% |
neutral |
up |
up |
|
|
Silver |
29.24 |
30.07 |
0.3% |
2.8% |
down |
neutral |
up |
|
|
Platinum |
910.50 |
948.30 |
1.4% |
4.2% |
down |
down |
down (weak) |
|
|
|
|
|
|
|
|
|
|
|
|
Base Metals |
|
|
|
|
|
|
|
|
|
Palladium |
909.80 |
922.50 |
1.2% |
1.4% |
down |
down |
down |
|
|
Copper |
4.03 |
4.07 |
(1.2)% |
1.0% |
down |
down |
neutral |
|
|
|
|
|
|
|
|
|
|
|
|
Energy |
|
|
|
|
|
|
|
|
|
WTI Oil |
71.72 |
73.96 |
4.8 |
3.1% |
up |
down (weak) |
down |
|
|
Nat Gas |
3.63 |
3.35 |
(0.9)% |
(7.7)% |
up |
up |
neutral |
|
Source: www.stockcharts.com
* New All-Time Highs
Note: For an explanation of the trends, see the glossary at the end of this article.
New highs/lows refer to new 52-week highs/lows and, in some cases, all-time highs.
GLOSSARY
Trends
Daily – Short-term trend (For swing traders)
Weekly – Intermediate-term trend (For long-term trend followers)
Monthly – Long-term secular trend (For long-term trend followers)
Up – The trend is up.
Down – The trend is down
Neutral – Indicators are mostly neutral. A trend change might be in the offing.
Weak – The trend is still up or down but it is weakening. It is also a sign that the trend might change.
Topping – Indicators are suggesting that while the trend remains up there are considerable signs that suggest that the market is topping.
Bottoming – Indicators are suggesting that while the trend is down there are considerable signs that suggest that the market is bottoming.
Disclaimer
David Chapman is not a registered advisory service and is not an exempt market dealer (EMD) nor a licensed financial advisor. He does not and cannot give individualised market advice. David Chapman has worked in the financial industry for over 40 years including large financial corporations, banks, and investment dealers. The information in this newsletter is intended only for informational and educational purposes. It should not be construed as an offer, a solicitation of an offer or sale of any security. Every effort is made to provide accurate and complete information. However, we cannot guarantee that there will be no errors. We make no claims, promises or guarantees about the accuracy, completeness, or adequacy of the contents of this commentary and expressly disclaim liability for errors and omissions in the contents of this commentary. David Chapman will always use his best efforts to ensure the accuracy and timeliness of all information. The reader assumes all risk when trading in securities and David Chapman advises consulting a licensed professional financial advisor or portfolio manager such as Enriched Investing Incorporated before proceeding with any trade or idea presented in this newsletter. David Chapman may own shares in companies mentioned in this newsletter. Before making an investment, prospective investors should review each security’s offering documents which summarize the objectives, fees, expenses and associated risks. David Chapman shares his ideas and opinions for informational and educational purposes only and expects the reader to perform due diligence before considering a position in any security. That includes consulting with your own licensed professional financial advisor such as Enriched Investing Incorporated. Performance is not guaranteed, values change frequently, and past performance may not be repeated.


