
“I’m not better than the next trader, just quicker at admitting my mistakes and moving on the next opportunity.”
—George Soros, Hungarian-American businessman, philanthropist, political activist, author, philosopher, founder of Soros Asset Management, Double Eagle which became the Quantum Fund, known as the man who broke the Bank of England as a result of a short sale of US$10 billion of pound sterling in 1992 earning a profit of US$1 billion; b. 1930
“Letting your emotions override your plan or system is the biggest cause of failure.”
—J. Welles Wilder Jr., American mechanical engineer, real estate developer, best known as a technical analyst who created several technical indicators, including Relative Strength Index (RSI) and Parabolic SAR; 1935–2021
“All there is to investing is picking good stocks at good times and staying with them as long as they remain good companies.”
—Warren Buffett, American business magnate, investor, philanthropist, CEO Berkshire Hathaway, known as the Sage of Omaha; b. 1930
Debt Ceiling Wars Again
The U.S. debt limit war plods on. While everyone puts on a good face, the reality is announcing “some progress” is in reality almost no progress at all. To date, there is no deal. But the warnings keep coming that the U.S. Treasury could run out of cash by June 1. That was then. Now they are saying June 5. Biden and McCarthy say they have a tentative deal. McCarthy now has to take it back to his rebellious caucus for a vote. Will it pass? On June 2 millions of Social Security cheques are supposed to go out. The clock ticks.
Money market rates due in the possible cash crunch period keep on rising. Some senators (Republican) have threatened to do everything in their power to impede a debt ceiling deal if it doesn’t contain all the budgetary cuts and reforms being demanded. As we and others have noted, raising the debt ceiling to ensure the smooth flow of government should be a no-brainer. But it has been turned into a political football. It’s a political problem, not an economic problem. It becomes an economic problem if the politics are not resolved.
The debt ceiling was created in 1917 during World War I as a means of raising debt to fight the war. After that, raising the debt ceiling was very much a routine matter. It was raised some 90 times in the 20th century. The debt ceiling was never reduced. The first real sign of trouble came in 1995 when the request for raising the debt ceiling under Democrat President Bill Clinton was put to Congress. The Republican-led Congress demanded a reduction in the size of the federal government. The budget wasn’t passed and, as a result, there were shutdowns of government in both 1995 and 1996. Eventually, however, all was resolved and the debt ceiling raised. During the presidency of George W. Bush (Republican), the debt ceiling was raised seven times with no problem.
Then came the showdown in 2011. Again, it became a political football with a Democrat president (Obama) and a Republican-led Congress. The debt ceiling was finally raised on July 31, 2011, two days before it was thought that the U.S.’s borrowing authority might be exhausted. The end result of the fractious debt ceiling debate was that the U.S.’s credit rating was downgraded by S&P from AAA to AA+ on August 5, 2011. Other rating agencies maintained their AAA rating, but now DBRS and Fitch have put the U.S. on negative watch. No word at this time from Moody’s. Nor is there any change in S&P’s rating. An actual default could put U.S. securities at D with treasury bills at CCC or C, as junk ratings.
But what did happen was the debt limit debacle, coupled with the S&P downgrade, sparked a sell-off in the stock markets. By August 9, 2011 the S&P 500 had fallen almost 15% from the end of July. The mini-bear of 2011 eventually saw the S&P 500 fall by 19.4% from the high that actually occurred on April 29, 2011. The final low did not come until October 4, 2011. Gold, on the other hand, rose about 5.5% in the same period that the S&P 500 was falling. Eventually gold topped out at all-time highs on September 6, 2011, a gain of 18% from July 31.
S&P 500 and Gold 2011
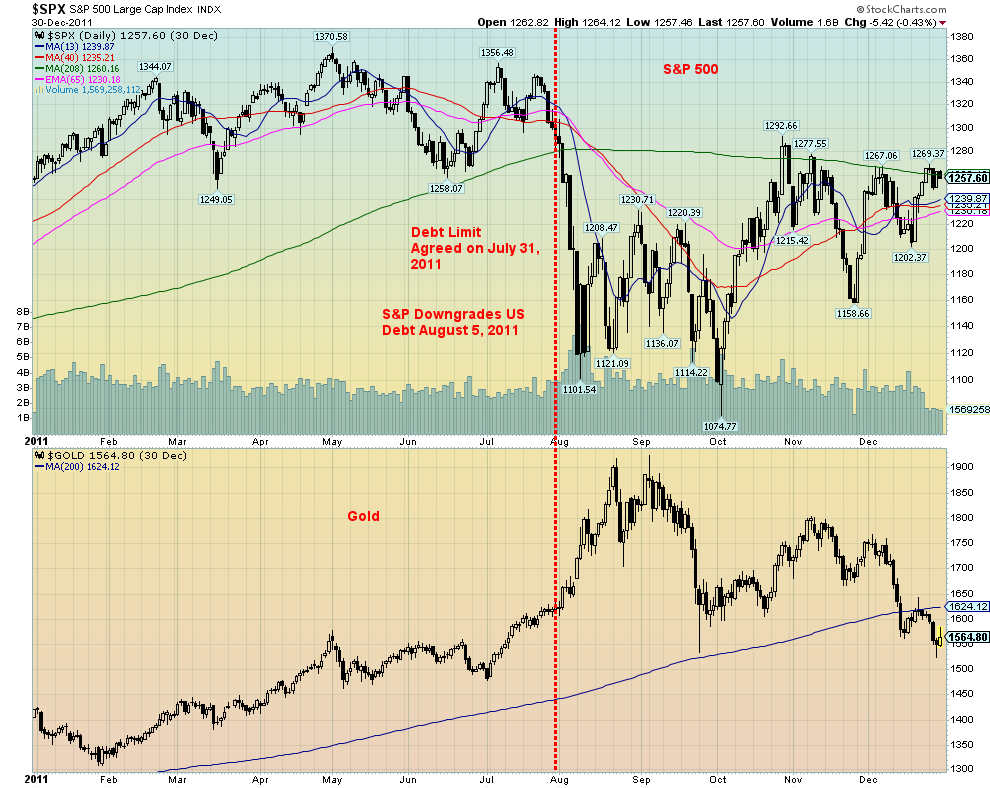
Source: www.stockcharts.com
That gold later topped and fell was due to other circumstances. However, the initial reaction after the debt limit debacle in 2011 was that gold rose while equities fell. Could a similar response come out of this year’s debt ceiling battle? The rating agencies are watching. Given that they have put the U.S. debt on negative watch, it raises the odds that the U.S. could suffer another debt downgrade.
Noteworthy was that once the debt ceiling was resolved on July 31, 2011, bond yields, as represented by the U.S. 10-year treasury note, fell from 2.77% to 1.72% by September 22. Meanwhile, the US$ Index started to rise although it didn’t really take off off until September. That helped contribute to gold topping and falling in September 2011.
There were more debt ceiling battles in 2013, 2014, and 2015. But mostly these resulted in suspensions and temporary measures that allowed things to continue. Under Republican President Trump there were also suspensions. During President Biden’s first half, a Democrat-controlled Congress and Senate allowed the debt ceiling to be raised to its current level of $31.4 trillion. The clock is ticking on this one. We hear word that a deal is imminent that would include capping federal spending for a couple of years. But will it be enough for the malcontents? For the record, some 69% of the U.S.’s budget is devoted to Social Security, Medicare/Medicaid, defense, and interest on the debt. The current debt/GDP is 120.5%. In 2000 it was 59%.
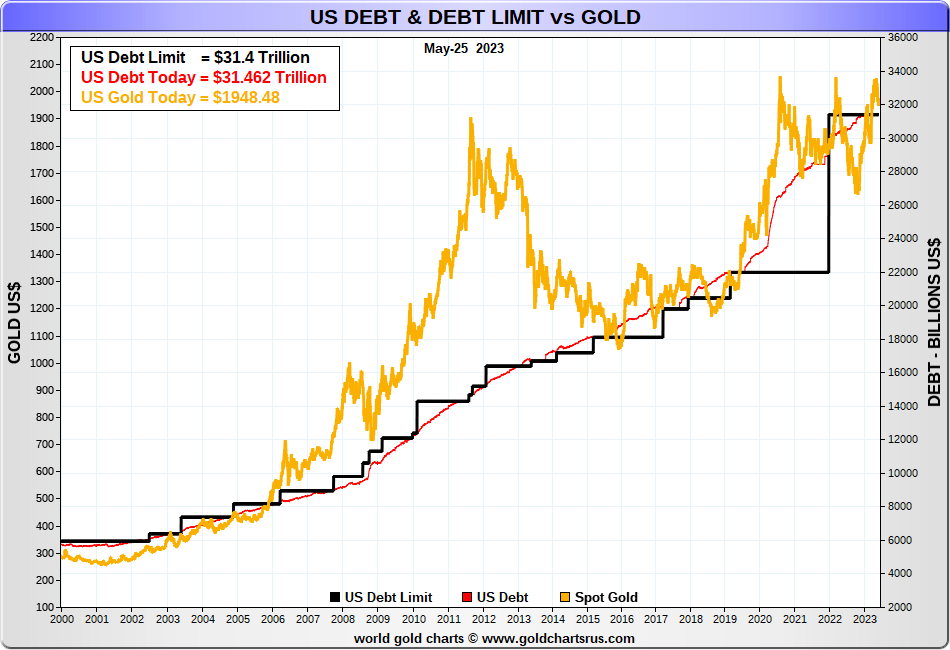
Source: www.goldchartsrus.com
It should also be noted that the debt ceiling war is not free. It is estimated that it is costing some $1 billion/day, thanks to higher interest rates, especially in the short end. A lot of funds have moved to money markets and away from treasury bills. But how safe are those funds? We have a tentatitive deal but it has to be voted on. We expect it to drag out into the coming week, regardless of signs of progress. Lack of a deal is negatively impacting the U.S.’s reputation and could negatively impact the U.S. dollar as the world’s reserve currency. There is the real risk of a debt downgrade. In the end there are no winners.
Recession or No Recession
Germany has entered an official recession. The German econonmy contracted 0.3% in Q1 following a 0.5% contraction in Q4 2022. The culprits? High inflation and rising interest rates. Germany’s inflation was last reported at 7.2% in April. The eurozone last reported inflation at 7.0% while the U.K. is the highest, last reported at 8.7%. Our chart shows inflation in five of the G7 countries. Italy and Japan have been left off. Italy last reported inflation at 8.2% and Japan at 3.5%. The high rate of inflation is causing problems for Japan where raising interest rates is a bit of a no-no. For the record, France last reported inflation at 5.9% while Canada is at 4.4%. The U.S. was last at 4.9%. It appears that Germany, along with the U.K., has an inflation problem.
Inflation Rates G5 2007–2023
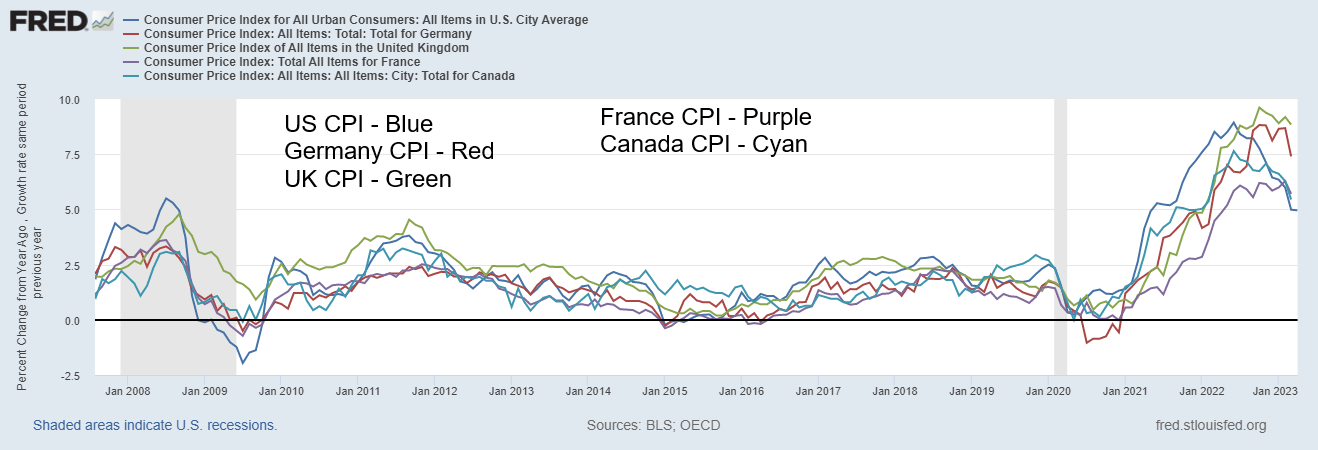
Source: www.stlouisfed.org
If Germany has gone into recession, can the others be far behind? Germany is the driver of the EU. Yet we still hear the mantra of how resilient the U.S. economy is. Many of the numbers that came out this past week continued to defy expectations. Weekly jobless claims were lower than expected as were continuing jobless claims; personal spending month-over-month (m-o-m) was higher than expected as the consumer just keeps on spending, even as personal income was as expected; durable goods orders were better than expected; and the Q1 GDP growth rate was also better than expected at 1.3%, when they expected 1.1%. The labour market has remained strong. But consumer confidence is at fifteen year lows despite the most recent a little better than expected. The next jobs report is not due out June 2, 2011. So far, the expectation is a gain between
180,000 and 193,000. April job growth was 253,000 above expectations. The unemployment rate is expected to rise to 3.5% from 3.4%.
The expectation is that inflation is going to stay higher for longer. Forecasts on Fed Funds have it at 4.82% by year end vs. the view just a few weeks ago that it would only be 4.2%. Even when the regional banks were blowing up, the expectation of Fed Funds was 3.7%. Core inflation hasn’t budged since January. The Fed’s closely-watched PCE price index was 4.4% for April, higher than March’s 4.2%. It was also above the forecast of 4.1%. Nonetheless, the expectation of 5.3% inflation for June is a far cry from the Fed’s 2% target.
U.S. GDP Growth Rate vs. Germany GDP Growth Rate 2013–2023
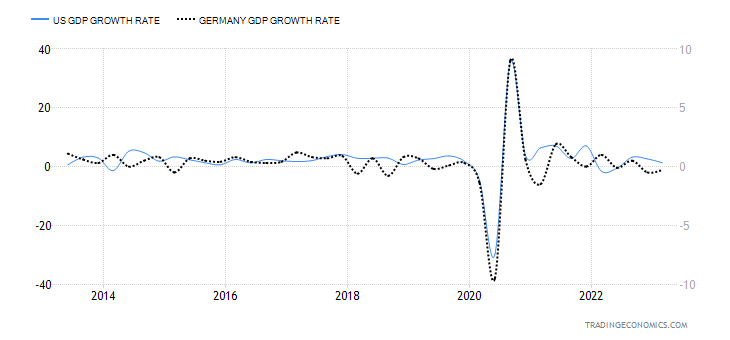
Source: www.tradingeconomics.com, www.bea.gov, www.destatis.de
All appears to be quiet on the regional bank front right now; however, our outlook is that the problem is not over. But problems keep popping up in the commercial real estate market. Nationwide, the office vacancy rate is 20%. In Canada, it was last reported at 17.7%. In the U.S., there are some $11 trillion in real estate loans outstanding. Some $1.5 trillion is due for repayment by the end of 2025. Some $270 billion is due in 2023.
Could the commerical real estate markets get worse? Yes, it could. It is being reported that there is a new variant of COVID emerging in China called XBB. It is now being estimated it could impact up to 65 million into June 2023. If that’s correct, what if it spread to North America once again? What would be the impact? This comes barely six months after China went through an earlier bout where they had huge lockdowns that sparked social unrest and disrupted supply chains. It also put huge stress on their hospitals and crematoriums.
Consumer debt is also a problem and deliquencies for credit card and car loans are rising in both the U.S. and Canada. Mortgages are also under stress. Canada has one of the highest consumer debt/GDP ratios in the world, last reported in December 2022 at 103%. It could be higher now. Switzerland has the highest rate at 129% while the U.S. is at 75.2%, below where it was in 2008 when it hit just under 100%.
Banks are reporting lower than expected results while upping their reserves for loan losses. Banks face pressure, not only because of consumer debt (credit cards, lines of credit, car loans, and mortgages) but also commercial real estate debt.
None of this has been good for corporate credit quality. Credit quality continues to deteriorate. Some 69% of U.S. corporate debt is reported at BBB or lower. And that’s an old number. It may be higher now. Some $1.9 trillion BBB rated debt is due in 2023 and the BBB market totals at least $3 trillion. As one pundit put it, some segments of the market are not just junk; they will soon be just garbage.
In listening to different Fed officials, support for a rate pause at the June 13–14 FOMC is not unanimous just yet. Could the Fed hike once again? The current Fed rate is 5.00%–5.25%. The current effective Fed Funds rate is 5.08%. Canada is also facing a similar dilemma as to whether to raise rates once again when things are already looking shaky. But inflation is persisting and high rates are here to stay. The trouble was that rates were held artificially low for far too long and now we are paying the price. As well, rounds of liquidity and quantitative easing (QE) did not do the economy any favours, even as they held the stock markets up. A recession is still coming and forecasts are for Q3. The unknown is the debt ceiling. It’s widely expected that they will compromise enough to raise the debt level for next year or two. Will they?
Chart of the Week
Source: www.goldchartsrus.com
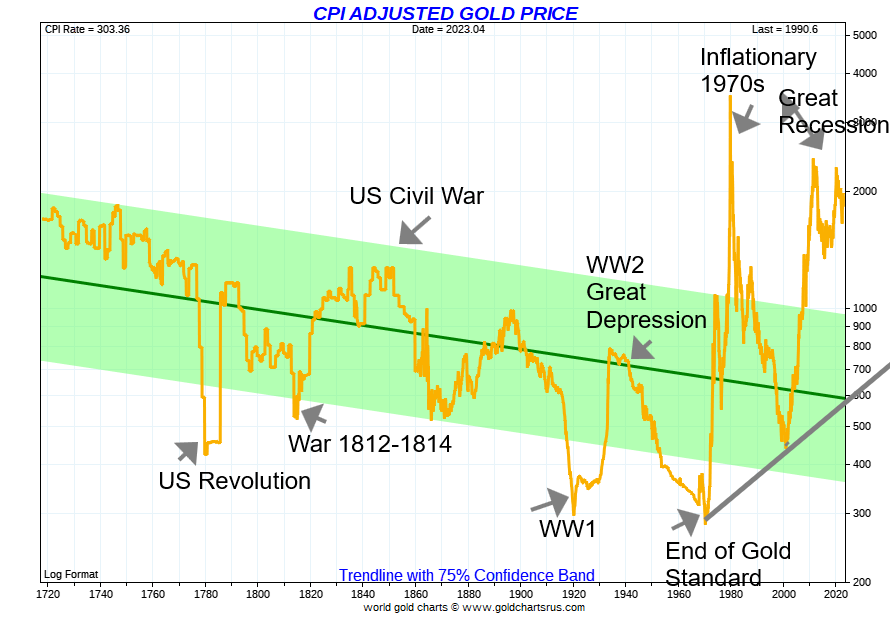
Last week we showed a long-term chart of the Dow Jones Industrials (DJI), CPI-adjusted. This week, here is a chart of gold dating back some 300 years, CPI-adjusted. It is as one would expect, this is a different picture than what one sees from a nominal chart of gold. While gold was a fixed price for most of the 300 years, the fluctuating rate of inflation repriced gold. Depending on what was happening, gold prices adjusted for CPI actually rose and fell numerous times.
For centuries, gold was a fixed price. Britain set a gold price as an ounce at 0.89 pounds in 1257. They raised it a mere one pound each century thereafter. Even after the American Revolution, the U.S. continued to use the price of gold set by the British standard. The 1800s were the century of the gold standard where countries backed their paper currencies with gold. Britain had set the price of an ounce of gold at 4.25 pounds from 1717 and it remained that way until Bretton Woods in 1944. The U.S. had set the gold price at $20.67 and it stayed that way until the revaluation of 1934 when it was raised to $35 at the height of the Great Depression. It was, at the time, a defacto devaluation of the U.S. dollar.
Bretton Woods (1944) agreed to set their currencies against the U.S. dollar as at the time the U.S. owned most of the world’s gold. The U.S. dollar was convertible into gold at $35/ounce. It remained that way until August 1971 when President Richard Nixon took the world off the gold standard, primarily due to the demand for converting U.S. dollars to gold that had seen the U.S. gold reserves decline from over 20,000 metric tonnes in 1950 to just over 8,000 metric tonnes by 1970. The U.S. feared losing all its gold so in effect they defaulted. Within a few years, Bretton Woods was completely dead as currencies were set free to float against the U.S. dollar.
That’s where we’ve been ever since. The result is debt exploded as it was no longer constrained by a gold standard. Currencies were fiat, meaning they became merely government I.O.U.s. It is noteworthy that every previous attempt at fiat currencies failed. China first started a fiat currency around 1,000 AD. Others followed but all failed. Until now. Note how it wasn’t until the end of the gold standard that gold finally broke out of its 75% confidence band. It has largely remained there ever since. It may be creating a new band but one that tilts upward.
Source: www.cycles.org, www.goldchartsrus.com
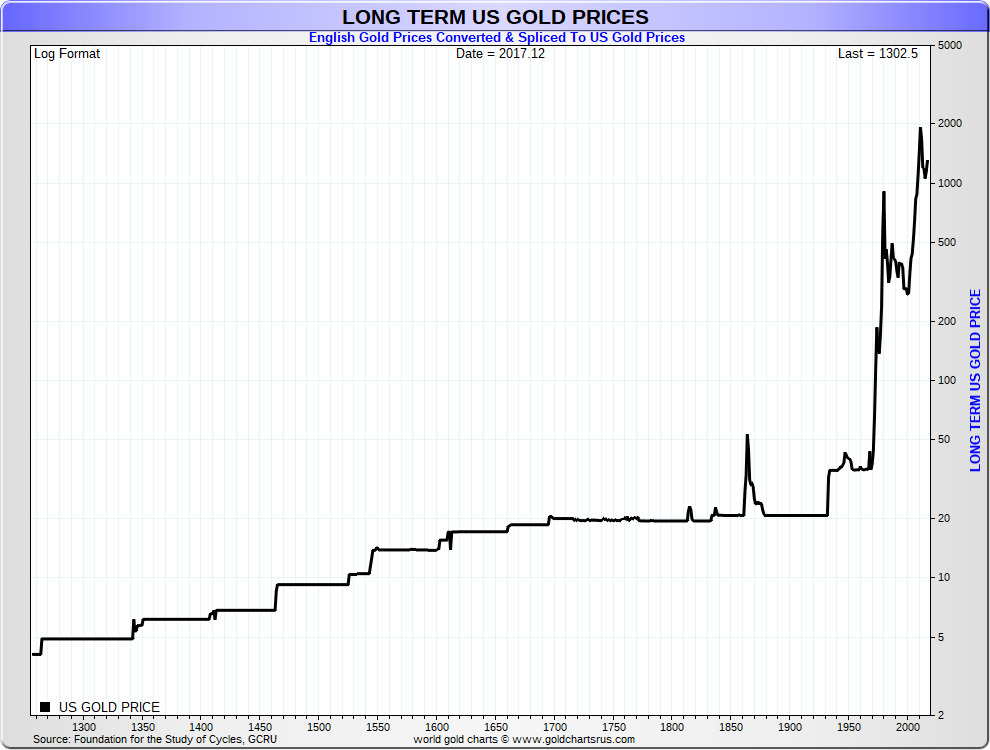
Above is an interesting chart of 700 years of gold prices. The chart, while priced in U.S. dollars, reflects the price of gold as set in Britain. The stair-step rise reflects Britain raising the price of gold/ounce by one pound every century until the 17th century, when it was kept steady for years. Because of shortages there was a spike in gold prices during the period of the U.S. Civil War in 1861–-1865. The above chart isn’t quite current (it only goes to December 2017) as gold prices are currently near US$2,000. But the picture remains the same.
We could go back and note prices as set during Greek and Roman times. The fact remains that gold, and to a lesser extent silver, have been currency for some 3,000 years—some believe even longer. That the latest experiment in fiat currencies continues, many believe we’ll eventually have to go back to some sort of gold standard. After all, money has to be worth more than the paper it is printed on. In reality, that’s all it is today. What that says about digital currencies is not yet known. Not worth the blinks on the screen?
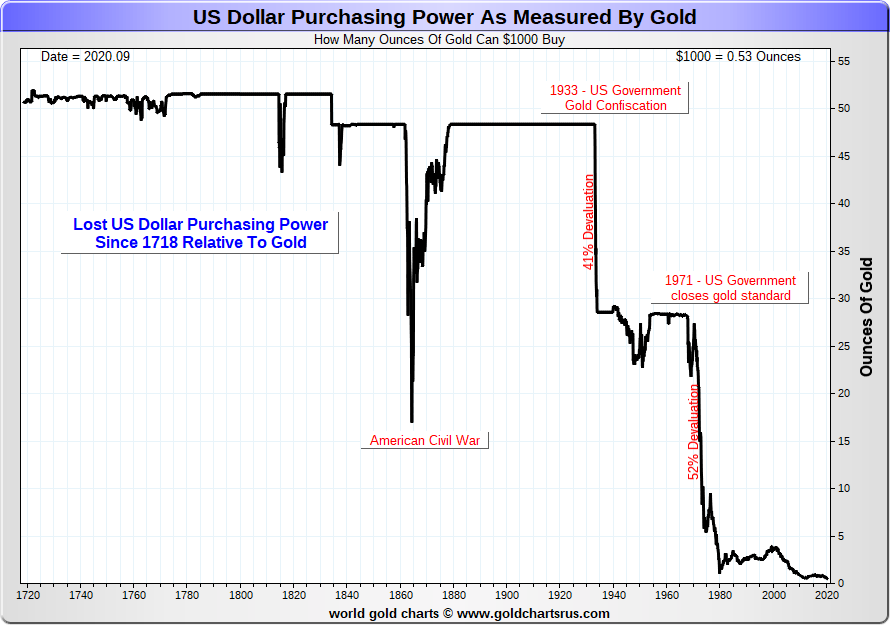
And, oh yes, the U.S. dollar, as have all currencies, have lost purchasing power relative to gold. Today US$1,000 will buy you just over 0.50 ounces of gold. Before the end of the gold standard in August 1971, US$1,000 would get you 28.6 ounces of gold. How times have changed.
Source: www.goldchartsrus.com
Special Chart
Source: www.bloomberg.com, www.genuineimpact.substack.com, Courtesy of James Wong GaoTeng Global Asset Management Ltd., Hong Kong www.gaotengasset.com
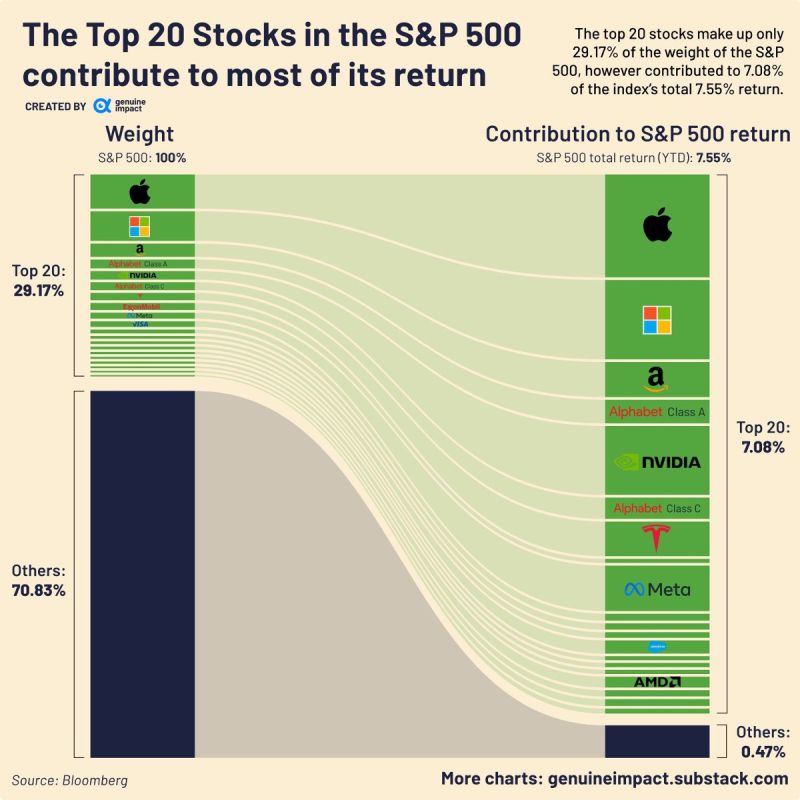
We’ve often noted the narrowness of the recent stock market rally. This chart now confirms it. Just some 20 stocks have been primarily driving the S&P 500 (and NASDAQ) this year. One of the biggest has been Nvidia. AI is the reason. But note that besides Nvidia on the list it also has Apple, Microsoft, Amazon, AMD (Advanced Micro), Meta, and Alphabet (Google). Nvidia is the most valuable chip maker in the U.S. No wonder the NY FANG Index is up 60% in 2023 vs. 9.5% for the S&P 500. Nvidia the star is up 166% in 2023 so far.
These 20 stocks make up only 29% of the S&P 500 but have contributed some 94% of the return. AI and ChatGPT have become the hot words of 2023. Could it be just like crypto and Bitcoin were before? Euphoria is here once again? But we know how crypto ended. Does the same fate wait for the soaring high-tech stocks? Risk on. As we’ve noted many times before—we’ve never seen a bubble end well. This time is not different.
The rest of the page is blank
Markets & Trends
|
|
|
|
% Gains (Losses) Trends
|
|
||||
|
|
Close Dec 31/22 |
Close May 26/23 |
Week |
YTD |
Daily (Short Term) |
Weekly (Intermediate) |
Monthly (Long Term) |
|
|
Stock Market Indices |
|
|
|
|
|
|
|
|
|
S&P 500 |
3,839.50 |
4,205.45 |
0.3% |
9.5% |
up |
up |
up (weak) |
|
|
Dow Jones Industrials |
33,147.25 |
33,093.34 |
(1.0)% |
(0.2)% |
down |
neutral |
up (weak) |
|
|
Dow Jones Transport |
13,391.91 |
13,903.42 |
flat |
3.8% |
down (weak) |
neutral |
neutral |
|
|
NASDAQ |
10,466.48 |
12,975.69 |
2.5% |
24.0% |
up |
up |
neutral |
|
|
S&P/TSX Composite |
19,384.92 |
19,920.31 |
(2.1)% |
2.8% |
down |
neutral |
up (weak) |
|
|
S&P/TSX Venture (CDNX) |
570.27 |
604.09 |
(1.4)% |
5.9% |
down |
neutral |
down |
|
|
S&P 600 (small) |
1,157.53 |
1,146.48 |
0.2% |
(1.0)% |
neutral |
down |
neutral |
|
|
MSCI World Index |
1,977.74 |
2,132.99 |
(0.7)% |
7.9% |
down |
up |
up (weak) |
|
|
Bitcoin |
16,535.23 |
26,839.18 |
0.1% |
62.3% |
down |
up |
neutral |
|
|
|
|
|
|
|
|
|
|
|
|
Gold Mining Stock Indices |
|
|
|
|
|
|
|
|
|
Gold Bugs Index (HUI) |
229.75 |
239.84 |
(5.0)% |
4.4% |
down |
up |
neutral |
|
|
TSX Gold Index (TGD) |
277.68 |
291.82 |
(4.6)% |
5.1% |
down |
up |
up (weak) |
|
|
|
|
|
|
|
|
|
|
|
|
% |
|
|
|
|
|
|
|
|
|
U.S. 10-Year Treasury Bond yield |
3.88% |
3.81% |
3.5% |
(1.8)% |
|
|
|
|
|
Cdn. 10-Year Bond CGB yield |
3.29% |
3.33% |
6.1% |
1.2% |
|
|
|
|
|
Recession Watch Spreads |
|
|
|
|
|
|
|
|
|
U.S. 2-year 10-year Treasury spread |
(0.55)% |
(0.76)% |
(26.7)% |
(38.2)% |
|
|
|
|
|
Cdn 2-year 10-year CGB spread |
(0.76)% |
(0.98)% |
(12.6)% |
(29.0)% |
|
|
|
|
|
|
|
|
|
|
|
|
|
|
|
Currencies |
|
|
|
|
|
|
|
|
|
US$ Index |
103.27 |
104.14 |
1.0% |
0.8% |
up |
down (weak) |
up |
|
|
Canadian $ |
73.92 |
73.48 |
(0.8)% |
(0.6)% |
down |
down (weak) |
down |
|
|
Euro |
107.04 |
107.29 |
(0.7)% |
0.2% |
down |
down |
down (weak) |
|
|
Swiss Franc |
108.15 |
110.49 |
(0.6)% |
2.2% |
down |
up |
up |
|
|
British Pound |
120.96 |
123.49 |
(0.8)% |
2.1% |
down |
up |
down (weak) |
|
|
Japanese Yen |
76.27 |
71.14 |
(1.9)% |
(6.7)% |
down |
down (weak) |
down |
|
|
|
|
|
|
|
|
|
|
|
|
|
|
|
|
|
|
|
|
|
|
Precious Metals |
|
|
|
|
|
|
|
|
|
Gold |
1,826.20 |
1,944.30 |
(1.9)% |
6.5% |
down |
up |
up |
|
|
Silver |
24.04 |
23.36 |
(2.9)% |
(2.8)% |
down |
up (weak) |
up (weak) |
|
|
Platinum |
1,082.90 |
1,028.10 |
(4.4)% |
(5.1)% |
down |
up |
up |
|
|
|
|
|
|
|
|
|
|
|
|
Base Metals |
|
|
|
|
|
|
|
|
|
Palladium |
1,798.00 |
1,426.10 |
(6.4)% |
(20.7)% |
down |
down |
down |
|
|
Copper |
3.81 |
3.68 |
(1.3)% |
(3.4)% |
down |
down |
neutral |
|
|
|
|
|
|
|
|
|
|
|
|
Energy |
|
|
|
|
|
|
|
|
|
WTI Oil |
80.26 |
72.69 |
1.4% |
(9.4)% |
down |
down |
neutral |
|
|
Nat Gas |
4.48 |
2.42 |
(6.6)% |
(46.0)% |
up |
down |
down |
|
Source: www.stockcharts.com
Note: For an explanation of the trends, see the glossary at the end of this article.
New highs/lows refer to new 52-week highs/lows and, in some cases, all-time highs.
Source: www.stockcharts.com
Does it get lonely at the top? We’ll have to wait to find out, but this past week the markets were decidedly mixed to down. However, a few stuck out with gains, diverging with others. This past week the S&P 500 gained 0.3%, thanks to the surging AI stocks led by Nvidia. The NASDAQ was also up on the week, gaining an even better 2.5%. But the Dow Jones Industrials (DJI) was down 1.0% while the Dow Jones Transportations (DJT) was flat. The S&P 400 (Mid) lost 0.5% while the S&P 600 (Small) was up a small 0.2%. The really big index known as the Wilshire 5000 gained 0.3%. As we point out next, the divergence between the NASDAQ and the DJI is not an everyday occurrence and the last time we really saw that was in 2000 at the end of the high tech/dot.com bubble. The markets fell hard after.
In Canada, the TSX Composite lost 2.1% and the TSX Venture Exchange (CDNX) dropped 1.4%. In the EU, the London FTSE fell 1.7%, the EuroNext was also off 1.7%, the Paris CAC 40 dropped 2.3%, and the German DAX was off 1.8%. The EU doesn’t seem as confident as the U.S. markets. In Asia, China’s Shanghai Index (SSEC) fell
2.2% while the soaring Tokyo Nikkei Dow (TKN) hit new highs again, up 0.4%. The Hong Kong Hang Seng (HSI) fell 3.6% and has been the worst-performing Asian index. Taiwan hit new highs up 2.0%, India’s Nifty Fifty is
near all-time highs, gaining 1.6% this past week, and while Singapore Straits gained 0.2% it is nowhere near its highs. The MSCI World Index fell 2.5%. Oh yes, and Bitcoin gained about 0.1% but stayed under 27,000.
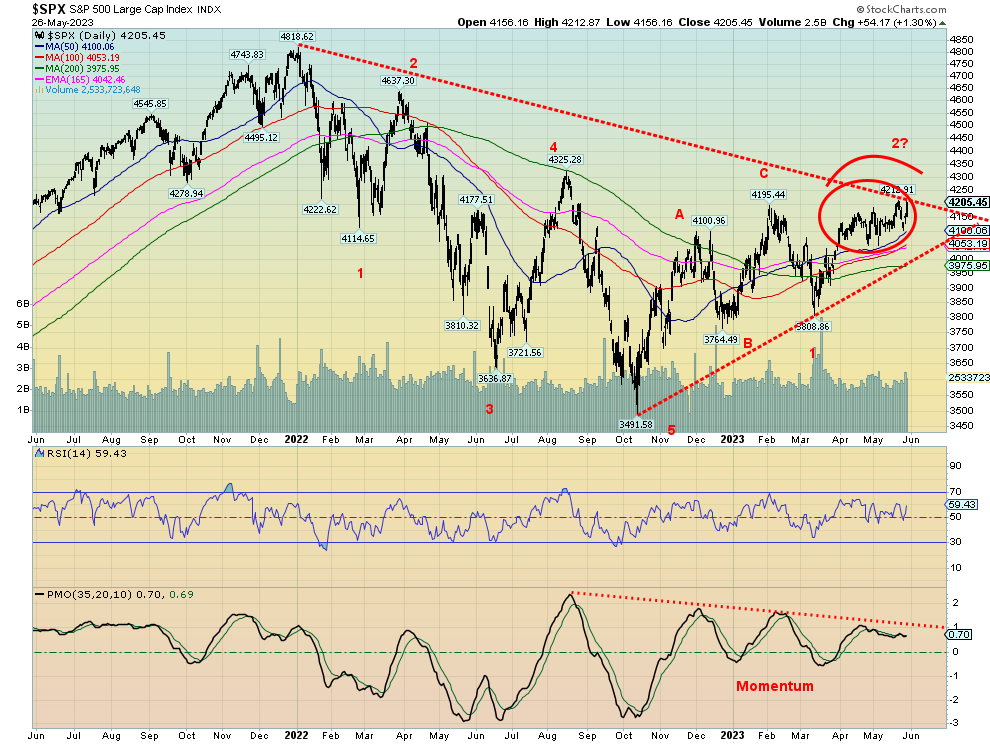
For the S&P 500, 4,200 remains a potential breakout point. No denying it could do it. But with so many divergences abounding, we wouldn’t put huge confidence in it. Momentum just keeps on falling, even as the SPX rises. And it all seems to be a one-trick pony with the AI stock leading the way. Once the bloom comes off the AI stocks, just as they did with the dot.com stocks in 2000, this market could fall—hard. 4,000 remains a potential breakdown point and under 3,900 the drop could really get under way.
The stock markets seem to believe that a debt ceiling deal will be done. And it makes sense that it should happen. But what if they are wrong? What if it’s a deal but the rating agencies lower the U.S.’s credit rating as they did in 2011? That time, the markets fell. Is this time different?
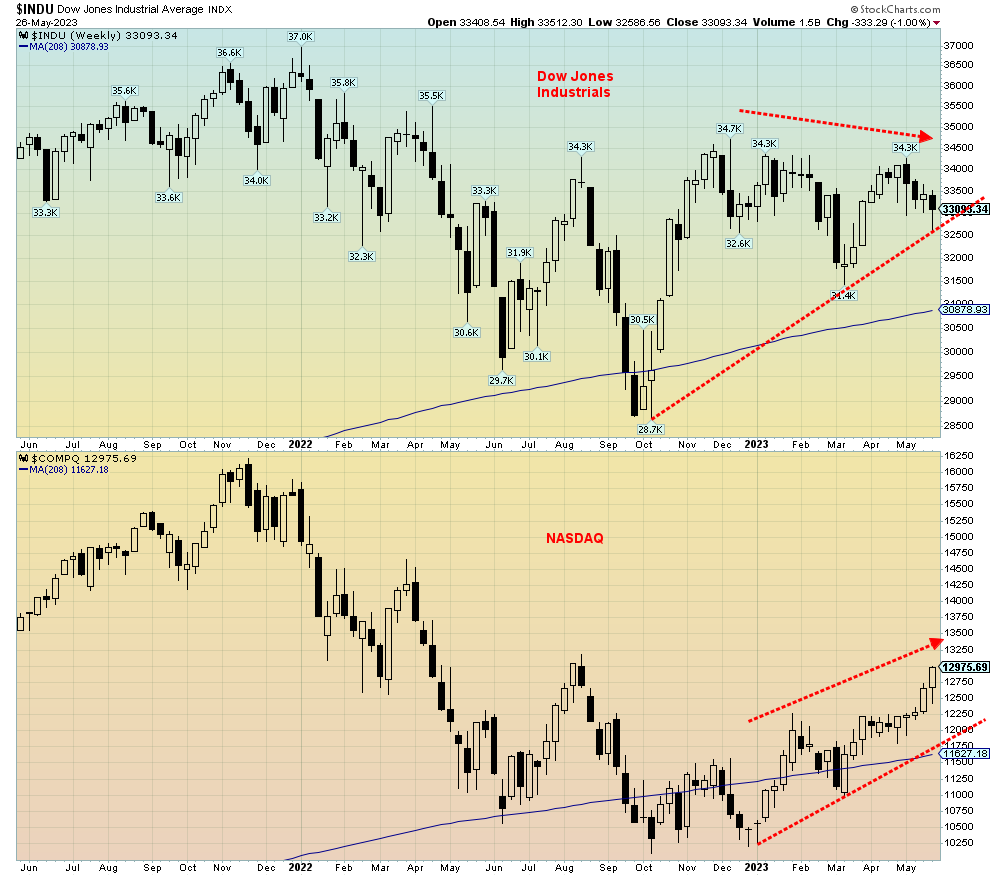
Dow Jones Industrials and NASDAQ 2021–2023
Source: www.stockcharts.com
We’ve shown numerous divergences in the market of late. Here’s another one. The Dow Jones Industrials (DJI) is declining, even as the NASDAQ is rising. The DJI fell this past week, while the NASDAQ rose—a divergence. The DJI completed what may have been its bear market rally back in December 2022. The NASDAQ has long surpassed its December high and its August high. The DJI is back below its August high. The DJI is down roughly 4% from its December high. The NASDAQ is up nearly 6% from that December high. The S&P 500 is roughly flat with its December high while the Dow Jones Transportations (DJT) is down 6% from its December high and
down over 12% from a January high. The Dow Jones Utilities (DJU) is down almost 12% from its December high. What’s key here is this is a significant divergence of non-confirmation. It is noted that in 2000 the DJI made its high in January, but both the NASDAQ and the S&P 500 made their high in March. At the time the DJI was well off its January high. The result of these divergences was the markets fell in 2000 and, we suspect, are poised to fall again once the bloom comes off the AI/high-tech stocks.
Source: www.stockcharts.com
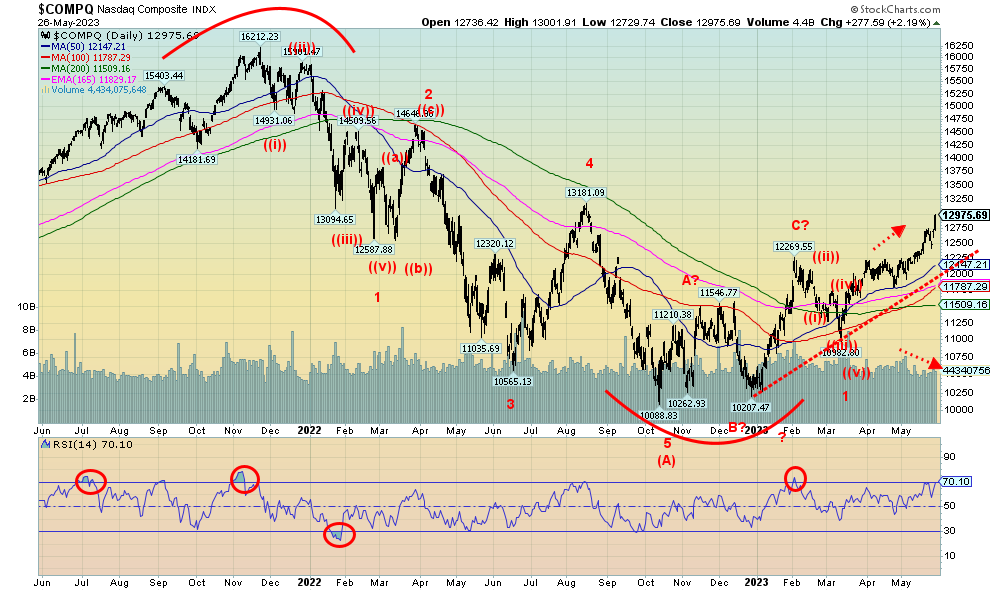
The NASDAQ is the star. But as we note, it’s a lonely one. All thanks to AI stocks led by Nvidia. Nvidia wasn’t the only one making new highs this past week. Joining the party were Meta, up 6.7%, Google, up a mere 1.8%, Microsoft, up 4.6%, and AMD, up 20%. Nvidia gained 24.5%. Were there any FAANG losers? Well, Snowflake got snowed, falling 15.2% and Alibaba (one of the Chinese FAANGs) dropped 3.6%. But everywhere else the FAANGs soared. The New York FANG Index was up 5.6% on the week but did not make new all-time highs, unlike Nvidia. The FAANGs are major components of both the NASDAQ and the S&P 500. We note that the NASDAQ’s RSI is now at 70, indicating overbought. However, we don’t deny that it could go even higher.
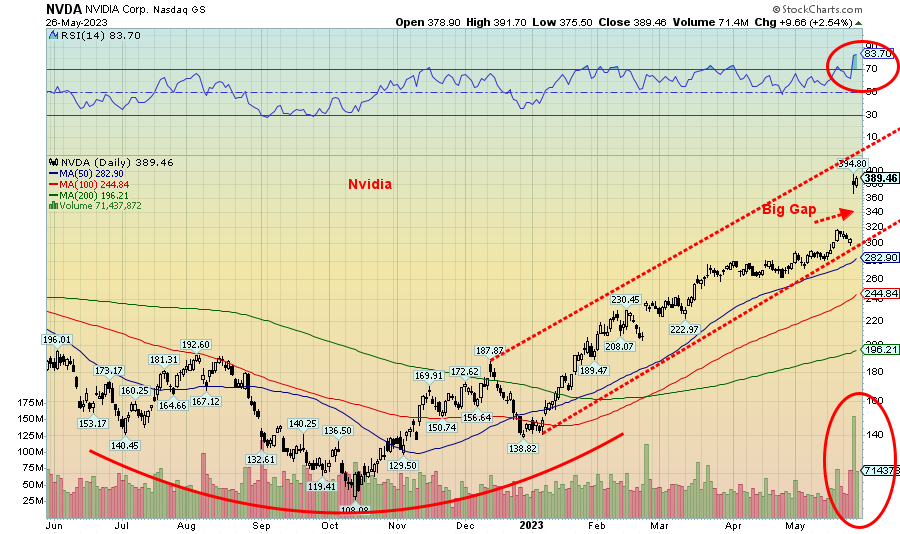
The AI Star – Nvidia
Source: www.stockcharts.com
Yes, here is the star—Nvidia. The big kahuna of the AI stocks. That’s a big gap to fill. Huge volume on the gap up. We may be overbought according to the RSI (at a lofty 83.7), but that doesn’t guarantee a fall tomorrow. As with all gaps of this nature, we look to see how it might fill the gap. Typically, it might go half-way. That could take it down to about $340. But if it broke under $320 and especially under $300, look out below. What goes up fast comes down even faster.
Source: www.stockcharts.com
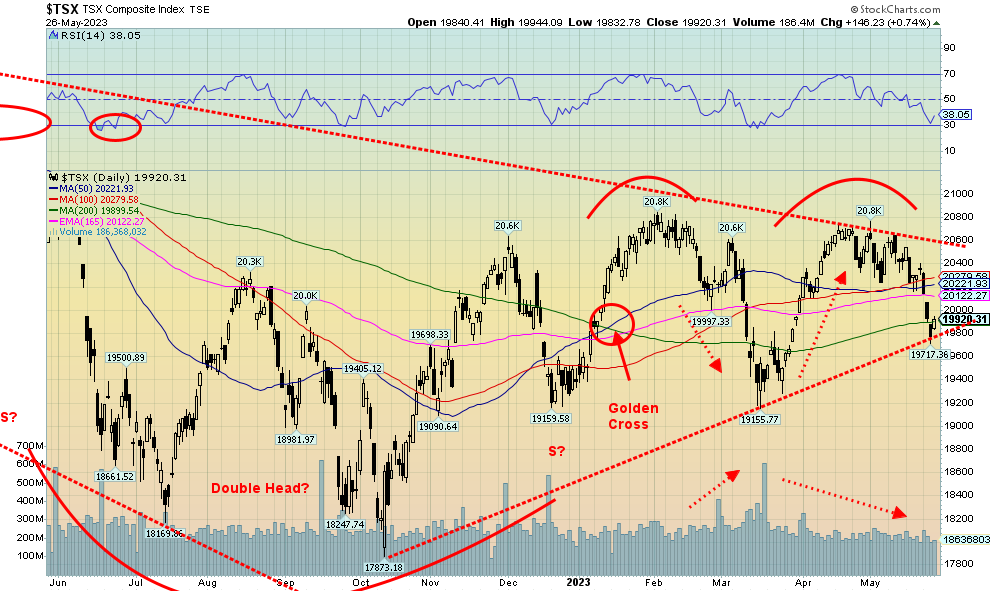
The TSX just doesn’t have the big high-tech names that the NASDAQ has. Unlike the NASDAQ and the S&P 500, the TSX Composite fell 2.1% this past week, thanks mostly to the weak commodity sectors. The junior TSX Venture Exchange (CDNX) also fell down 1.4%. Both, however, cling to gains in 2023 with the TSX up 2.8% and the CDNX up 5.9%. Nobody was spared this past week as every sub-index finished in the red, led by Materials (TMT), down 5.4%. Actually, Health Care (THC) was worse, down almost 6.0%, but then THC is the smallest component in the index. Other big losers included Golds (TGD), down 4.6%, Telecommunications (TTS), down 4.4%, Metals & Mining (TGM), off 3.3%, and Industrials (TIN), down 3.1%. Financials (TFS), the largest component, were not spared as they fell 1.6%, thanks to below expectations reporting by the big banks. The exception in beating expectations was the CIBC (CM). The TSX did rebound on Friday, bouncing seemingly off the uptrend line from the October 2022 low. But if 19,800 were to fall again and especially under 19,700, then the odds favour a decline to the March low of 19,155. Note the 200-day MA is at 19,900, which is about where the TSX closed on Friday. Between the 200-day MA and the uptrend line the TSX has held, at least for the moment. But we’d have to see a rebound back over 20,300 to convince us that a low might be in.
U.S. 10-year Treasury Bond/Canadian 10-year Government Bond (CGB)
Source: www.tradingeconomics.com, www.home.treasury.gov, www.bankofcanada.ca
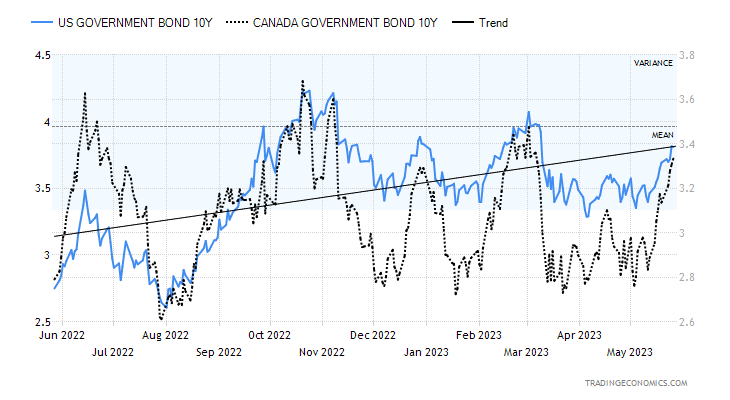
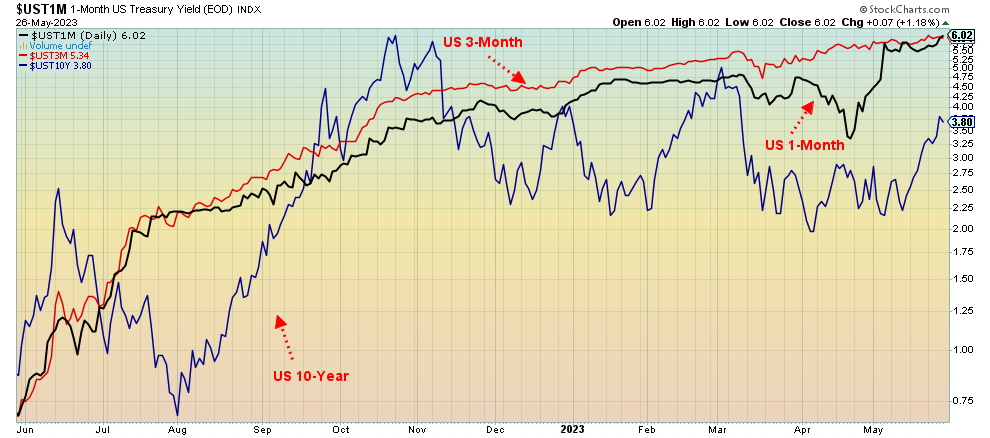
Interest rates are rising. The debt ceiling war may be putting a lot of upward pressure on interest rates. If they actually failed to raise the debt ceiling and defaulted, interest rates might soar through the roof. A rating agency downgrade might also do the same thing although the roof might stay on. This past week the U.S. 10-year treasury note rose to 3.81% up from 3.68% the previous week. Canada just seemed to follow as the 10-year Government of Canada bond (CGB) rose to 3.33% from 3.14%. But the real soaring of rates is coming in the one month and under market, which has the U.S. 1-month treasury bill sailing through 6%. The previous high for the U.S. 10-year was seen at 4.07% back in early March. If that should fall, then all bets are off for a big topping pattern. Instead, rates may rise further. The high point was 4.23% back in October 2022. The breakdown comes if the U.S. 10-year were to fall below 3.30%, but we’ve used 3% to confirm a breakdown under way. This past week a host of positive economic numbers, including weekly claims and PCE prices, helped push rates higher. Expectations were rising that maybe, just maybe the Fed might hike again at the June 13–14 FOMC, although the odds are still in favour of a pause. But it’s the debt ceiling wars that are making people nervous, even if it’s widely expected that they will come to a deal and not be so crazy as to actually default, risking a downgrade that may still happen anyway. Those high short-term rates are adding at least a $1 billion to interest costs. There is a price to pay for the political wars.
The big story for this week, besides the ongoing debt ceiling wars, are the job numbers due out on June 2. The market is looking for a gain of 195,000 jobs, after the above-expectations gain of 253,000 in April. The
unemployment rate is expected to rise to 3.5% from 3.4%. A number of ISM manufacturing indices are also out this coming week. While the main ISM manufacturing index is expected to come in at 47, the services index is expected to remain above 50. Readings under 50 signal a recession.
1- and 3-month U.S. treasury bills and the U.S. 10-year treasury note
Source: www.stockcharts.com
Source: www.stockcharts.com
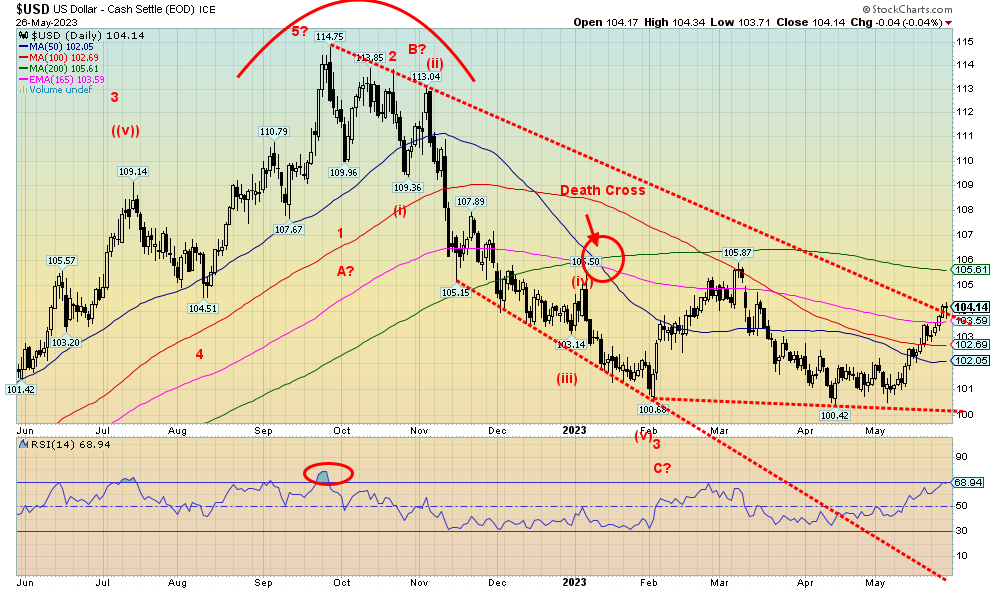
Is the US$ Index breaking out? It appears to be wiggling over that downtrend line from the September 2022 high. If that’s correct, its next move could be that 200-day MA near 105.60. A rising US$ Index is not positive for gold but is generally positive for gold in other currencies. This past week the US$ Index rose 1.0%, the euro fell 0.7%, the Swiss franc was off 0.6%, the pound sterling dropped 0.8%, while the Japanese yen continued its recent woes, down 1.9%. The yen has been the worst performer. The Cdn$ wasn’t spared as it fell 0.8%.
The US$ Index’s RSI is now at 68. So, a push higher could put it over 70 and into overbought territory. We haven’t had that since the September 2022 high. Our long-term support line remains near 100. The current rally continues to appear as a countertrend as the decline from the September high appears to have fallen in five waves, suggesting this is a primary move. The death cross remains in force despite the recent rebound. No doubt the US$ Index could push higher towards 105.60 and the 200-day MA, but given the index is becoming overbought, the odds favour an eventual decline once again. Breaking 100 would confirm it and send the US$ Index to new lows.
Source: www.stockcharts.com
It was another poor week for gold as it fell 1.9%. Silver was worse, down 2.9%, and platinum dropped even more, off 4.4%. As for the near precious metals, palladium dropped 6.4% and copper fell 1.3%. The woes continued over to the gold stocks as the Gold Bugs Index (HUI) dropped 5.0% and the TSX Gold Index (TGD) fell 4.6%. No joy, especially when everyone was forced to watch Nvidia soar 24.5% on the week. AI trumps hard assets.
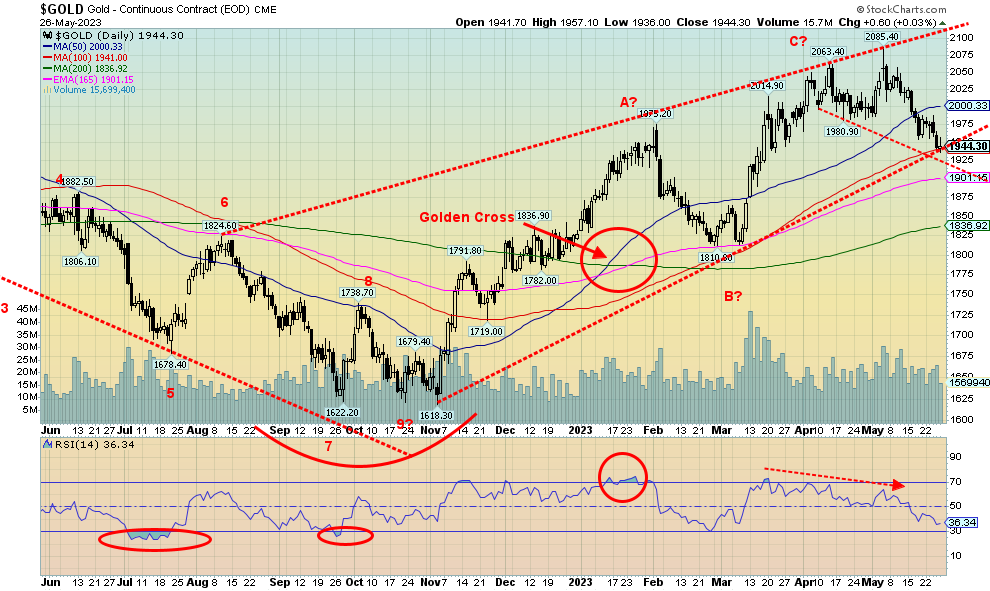
We have noted what appears to be some sort of broadening pattern for gold. That line is now down around $1,925. Gold did find support at the uptrend line from the November low at $1,618. As well, gold hit the 100-day MA on Friday. As long as we continue to hold support down to around $1,920, we should be okay. Under that level we could then bust $1,900 and that would be more negative as in theory that could trigger a decline to around $1,835 and the 200-day MA. Overall, gold is down about 7% from its high at $2,085, but we are up 20% from that November 2022 low. At $1,944 we remain at historically high levels. We are also reminded that gold has made new all-time highs but silver is well off its all-time high seen in April 2011 near $50. An unresolved divergence.
The RSI had been sliding for weeks since peaking in March. That was also a negative divergence. To start to confirm a low we need to regain back above $2,000. A move over $2,025 would confirm that a low is in. Gold has been the best performer of all the metals and has outperformed even the gold stocks. Since 2000 gold has
outperformed almost everyone including silver, the TSX, and the S&P 500. Yet it remains the least talked-about on the business channels. Almost invisible.
However, gold is the go-to asset in times of financial and geopolitical stress and loss of confidence in government. Central banks have been significant buyers of gold for years now as they diversify their assets away from the U.S. dollar. Are central banks gold bugs? Hardly. But they view gold as a key diversifier amongst their reserves. Yet gold for the most part remains grossly under-owned by most, with many dismissing it as—why bother even owning it when you can buy Nvidia?
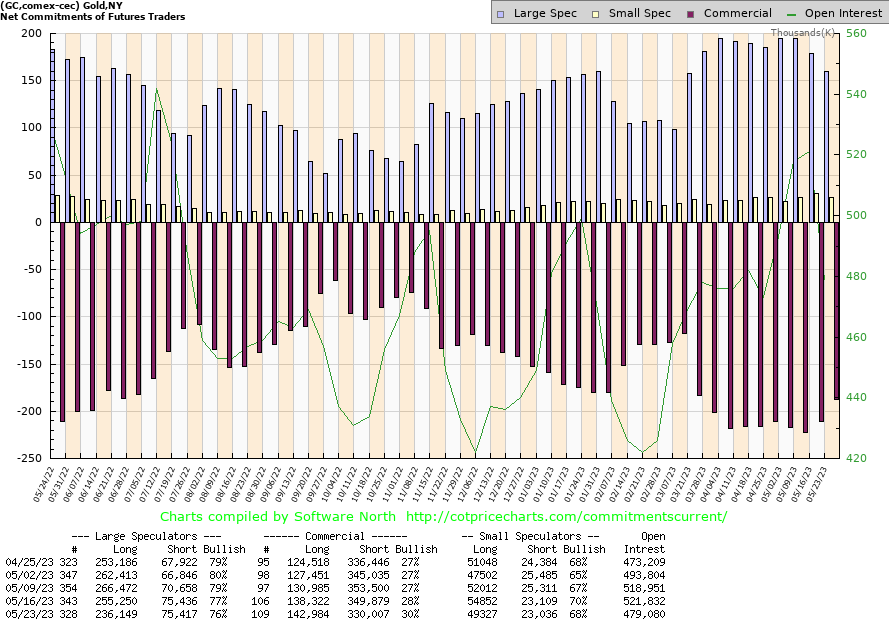
We continue to look for a possible June low. We can’t say we have hit our low. Only a move above $2,025 might convince us the low is in. We’re down some 7% from the recent high but we fell 8% in February. Fluctuations of 10% are not unusual. The longer trend remains up, even if we were to fall to the 200-day MA near $1,835. And the conditions for gold as a hedge remain positive. The COT has recently turned slightly in favour of gold as well. However, we need to see a few weeks of the COT improving to make our final low. So far, it has just been a couple of weeks. A rebound this coming week followed by another downside move would not be a surprise. The FOMC is June 13–14 and that might prove to be the catalyst for gold if the Fed announces a pause in their interest rate hikes, as we suspect. Passing the debt ceiling would most likely not be positive for gold. Or they could just suspend it and that would not be positive for gold, either.
Source: www.cotpricecharts.com
The gold commercial COT (bullion companies and banks) rose again to 30% from 28%, a positive development. Long open interest was up over 4,000 contracts while short open interest fell almost 20,000 contracts. The large speculators COT (hedge funds, managed futures, etc.) slipped to 76% from 77% as they dropped roughly 19,000 longs while holding their shorts steady. Overall, open interest was down over 42,000 contracts on a down week, suggesting the bulk of this was short covering. That’s a positive development.
Source: www.stockcharts.com
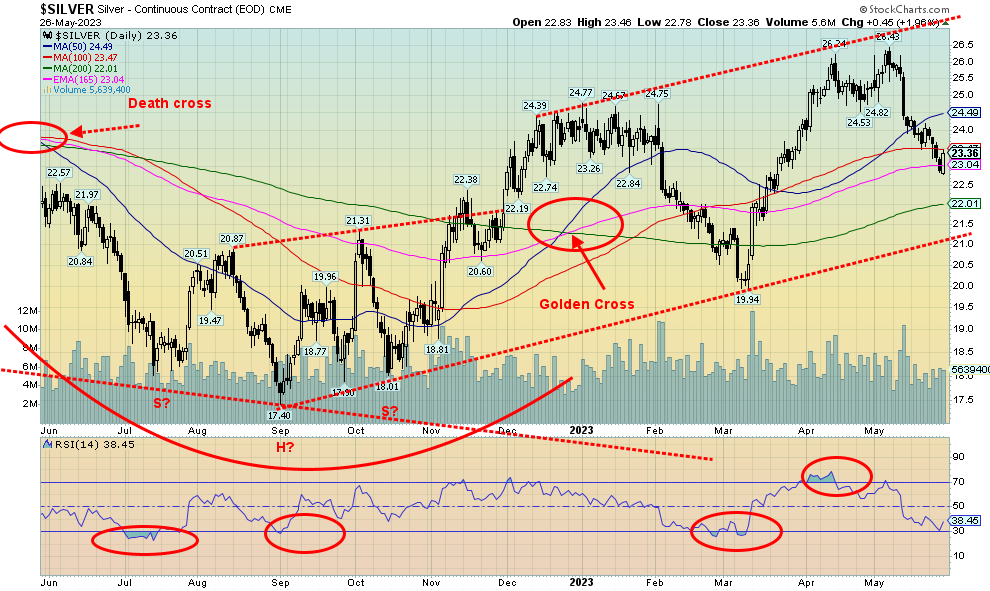
Silver continued its recent woes, losing 2.9% this past week and leaving silver down 2.8% on the year. The reasons for silver’s fall are much the same as gold, with the debt ceiling and fear of higher interest rates dominating the conversation. Silver has fallen almost 12% from a recent high in early May. The good news on Friday was silver had an outside day reversal, meaning silver made a new low for the current move and then reversed, taking out the high of the previous day and closing above the previous day. On that basis, Friday’s action was quite strong for silver. Has it bottomed? There was no significant uptick in volume to suggest that a bottom is in. We did find support at the 165-day EMA, but just below the 100-day MA. The RSI is currently at 38.5, above the 30 level that often defines oversold. We saw that in March at the lows. But the recent highs went above 70, suggesting overbought. So, the good comes with the bad.
We did get briefly under $23 which could have set up a decline to $22 and the 200-day MA. Rebounding back over $23 was positive. But the reality is we need to regain back above $24.50 to suggest to us that a low is in. Above $25.50, new highs become possible. For now, the low on Friday at $22.78 should hold and as long as it does the odds favour a return to the upside. Friday’s action saw silver leading the way and that’s what we need if we are going to come out of this hole. Long-term uptrend support is quite visible down at $21.00, so that is an absolute must to hold. We are still working on a positive golden crossover. Friday’s action doesn’t guarantee that the low is in, but the reversal action certainly helps. As well, the COT is somewhat friendly. Nonetheless, the final low may not be upon us until sometime in June.
Source: www.cotpricecharts.com
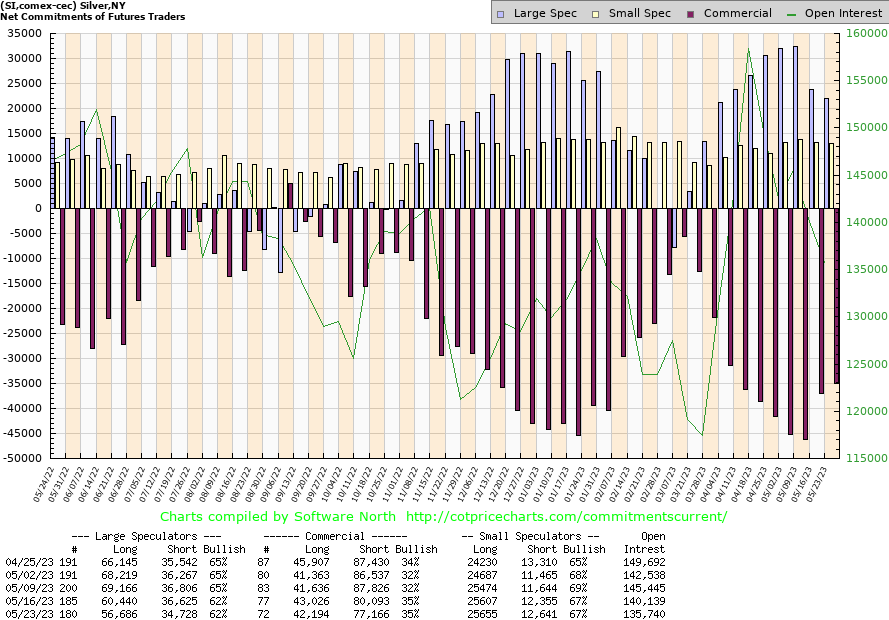
The silver commercial COT was unchanged this past week at 35%. Longs fell about 1,000 contracts while shorts were down about 3,000 contracts. The large speculators COT was also steady at 62%. But here too they trimmed longs by about 4,000 contracts while dropping shorts by about 2,000 contracts. Total open interest was off about 5,000 contracts on a down week for silver. We continue to hold that the silver COT appears at least somewhat friendly; however, a reading over 40% would go a long way to suggesting a low for silver.
Source: www.stockcharts.com
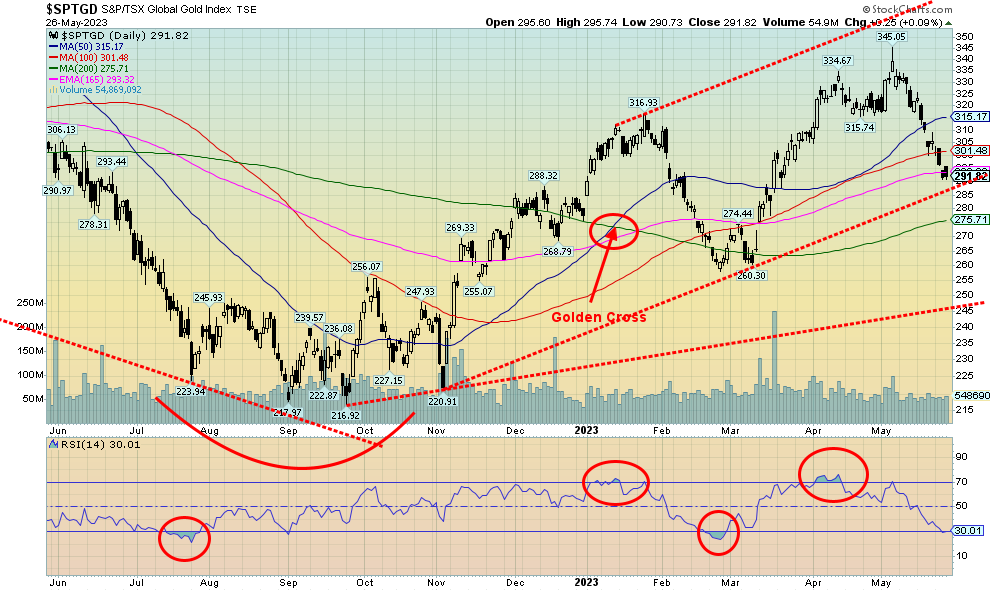
The gold stocks have been no fun for the past few weeks. Once again, with both gold and silver down, the gold stocks were pressured lower. This time the TSX Gold Index (TGD) was down 4.6% while the Gold Bugs Index (HUI) dropped 5.0%. Altogether, both the TGD and the HUI are down roughly 15% from their highs seen on May 4. None of this is unusual. We are reminded that during the great 2009–2011 bull market there were at least nine times when the gold stock indices fell 15% or more on their way to record highs. Since this rally started back in September at 217 for the TGD, this is the second time we’ve seen a drop of 15% or more. Overall, the TGD is up 34.5% from that September low. But we are reminded that the TGD is still down 36% from its all-time high in 2011. The HUI is even worse off, down almost 63% from that 2011 high. That’s the bad news. The good news is that the even the HUI is up almost 39% from its September 2022 low.
We now see we are approaching the uptrend line from that November low. That looks to be near 285, not far from where we are. The bad news is the long-term uptrend line is way down at 245. Given the RSI for the TGD is now at 30, we are approaching oversold levels that often give rise to buying opportunities. Friday saw a new low for the move, an outside day to the upside and a marginally higher close. A low? Can’t say. We note the 200-day MA is below as well, near 275. So, overall, we believe that it may be time to nibble on the gold stocks. As we keep reminding ourselves, gold stocks remain ultra-cheap as compared to gold. That position has been going on for years. Eventually the tide shifts. The conditions are certainly there.
Source: www.stockcharts.com
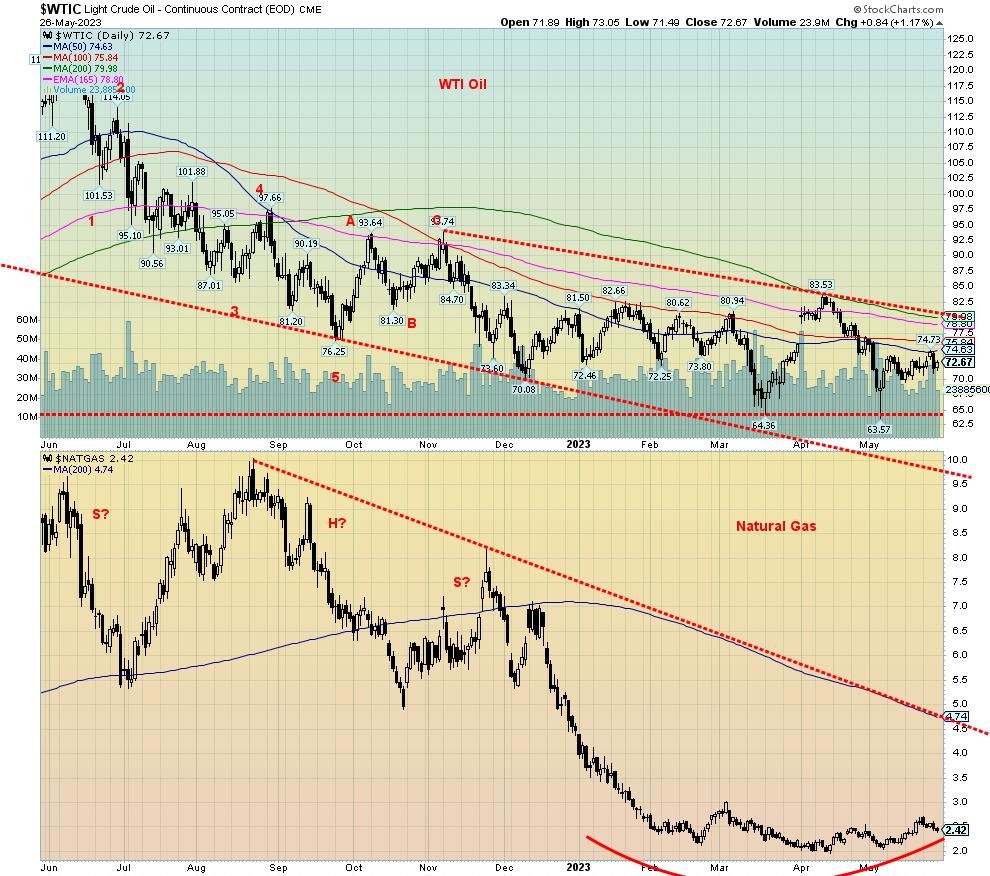
June 4 is the OPEC meeting and all eyes will be on it to see if OPEC votes to cut production further. The two biggest players, Saudi Arabia and Russia, have been sending out confusing signals as to their intentions. That’s probably deliberate. The result is WTI oil and Brent have been largely trading sideways of late, between $70 to $75. This past week WTI oil did rise 1.4% and Brent was up 0.4%. Natural gas (NG) at the Henry Hub did not fare as well, losing 6.6%, while EU NG at the Dutch Hub continues to fall, off 18.8%, back to where it was in 2021 before the war broke out.
The energy stocks were decidedly mixed this past week with the ARCA Oil & Gas Index (XOI) off 0.9% and the TSX Energy Index (TEN) down 0.8%. We suspect they are just confused as to the next move in oil and gas. When you get sideways movement that is a spark for confusion. NG, for example, has been rolling around for months now, never exceeding $3 while pushing at times down towards $2. Hence, that’s why we say we appear to be making a rounding bottom for NG. A firm breakout above $3 might start the next NG rally.
WTI is in the same position as it has spiked a couple of times down to around $63/$65, but it is never sustained. The result is, that appears to be a floor. The reality is WTI needs to firmly break above $80 and preferably above $82.50 to suggest to us that a new uptrend is under way.
The result of this is, we believe, the downside for both oil and gas appear limited but the upside could explode if something happened to spark it. The longer we remain in these trading ranges, the odds begin to shift to an upside breakout. The trouble is, seasonally, we will soon be entering the summer months when traditionally both oil and gas prices tend to be subdued. In the past, spikes in oil prices have tended to be event-driven such as the Arab oil embargo of the 1970s, the Iranian crisis of 1979, the Iraq war of 1990, the surge in Asian demand (China) during the 2000s, and the Russia/Ukraine war 2022.
Copyright David Chapman 2023
|
GLOSSARY Trends Daily – Short-term trend (For swing traders) Weekly – Intermediate-term trend (For long-term trend followers) Monthly – Long-term secular trend (For long-term trend followers) Up – The trend is up. Down – The trend is down Neutral – Indicators are mostly neutral. A trend change might be in the offing. Weak – The trend is still up or down but it is weakening. It is also a sign that the trend might change. Topping – Indicators are suggesting that while the trend remains up there are considerable signs that suggest that the market is topping. Bottoming – Indicators are suggesting that while the trend is down there are considerable signs that suggest that the market is bottoming. |
Disclaimer
David Chapman is not a registered advisory service and is not an exempt market dealer (EMD) nor a licensed financial advisor. He does not and cannot give individualised market advice. David Chapman has worked in the financial industry for over 40 years including large financial corporations, banks, and investment dealers. The information in this newsletter is intended only for informational and educational purposes. It should not be construed as an offer, a solicitation of an offer or sale of any security. Every effort is made to provide accurate and complete information. However, we cannot guarantee that there will be no errors. We make no claims, promises or guarantees about the accuracy, completeness, or adequacy of the contents of this commentary and expressly disclaim liability for errors and omissions in the contents of this commentary. David Chapman will always use his best efforts to ensure the accuracy and timeliness of all information. The reader assumes all risk when trading in securities and David Chapman advises consulting a licensed professional financial advisor or portfolio manager such as Enriched Investing Incorporated before proceeding with any trade or idea presented in this newsletter. David Chapman may own shares in companies mentioned in this newsletter. Before making an investment, prospective investors should review each security’s offering documents which summarize the objectives, fees, expenses and associated risks. David Chapman shares his ideas and opinions for informational and educational purposes only and expects the reader to perform due diligence before considering a position in any security. That includes consulting with your own licensed professional financial advisor such as Enriched Investing Incorporated. Performance is not guaranteed, values change frequently, and past performance may not be repeated.
About the author


Website: https://www.enrichedinvesting.com
Disclaimer: David Chapman is not a registered advisory service and is not an exempt market dealer (EMD) nor a licensed financial advisor. We do not and cannot give individualised market advice. David Chapman has worked in the financial industry for over 40 years including large financial corporations, banks, and investment dealers. The information in this newsletter is intended only for informational and educational purposes. It should not be considered a solicitation of an offer or sale of any security. The reader assumes all risk when trading in securities and David Chapman advises consulting a licensed professional financial advisor before proceeding with any trade or idea presented in this newsletter. David Chapman may own shares in companies mentioned in this newsletter. We share our ideas and opinions for informational and educational purposes only and expect the reader to perform due diligence before considering a position in any security. That includes consulting with your own licensed professional financial advisor.