
Possibly triggering Powell's pivot was the massive downward revision of nonfarm payrolls released on Thursday. Rounding out the three-hit week is the strike/lockout of Canada's railways. Despite being ordered to binding arbitration all signs are the strike/lockout could continue.
Our chart of the past week centers on one of the longest periods of time of an inverted yield curve we've ever seen. While many are expecting a soft-landing or even no-landing the long period of the inverted yield curve suggests to us that it could instead be a hard landing. What the trigger is we are not sure yet. But we believe at the center could be the world's massive debt where the U.S. holds the world's largest debt.
Markets responded to the positive vibes from Jerome Powel as stocks, bonds and gold all rallied this past week while the US$ Index fell. Lundin Gold Inc., a gold exploration and production company held in the Enriched Capital Conservative Growth Strategy,* for example, reported that strong grades, improved recoveries, eliminated debt, and high throughput underpinned increased revenue and income, strong cashflow, and a doubled dividend.* Gold once again hit new all-time highs and there are signs the gold market (silver and gold stocks too) has further to go.
Meanwhile, the wars continue and the most divisive U.S. election is now only 71 days away.
Have a great week!
DC
*Reference to the Enriched Capital Conservative Growth Strategy and its investments, celebrating a 6-year history of strong growth, is added by Margaret Samuel, President, CEO and Portfolio Manager of Enriched Investing Incorporated, who can be reached at 416-203-3028 or msamuel@enrichedinvesting.com
“The whole problem with the world is that fools and fanatics are always so certain of themselves, but wiser people are full of doubt.”
—Bertrand Russell, British mathematician, logician, philosopher, public intellectual, Nobel prize in literature, 1950, member of House of Lords 1931–1970; 1872–1970
“A good trader has to have three things: a chronic inability to accept things at face value, to feel continuously unsettled, and to have humility.”
—Michael Steinhardt, American billionaire, hedge fund manager, philanthropist, antiques collector, political activist, Chairman Wisdom Street Investments; b. 1940
“It’s not that I’m so smart; it’s just that I stay with problems longer.”
—Albert Einstein, German-born physicist, influential scientist, developed theory of relativity, world’s most famous equation E=MC2; 1879–1955
Revised Nonfarm Payrolls
Well, that was a bit of a surprise. Actually, not. Revising the nonfarm payrolls is regular and ongoing. The surprise was that the revision was a bit of a shocker. They were revised down by 818,000 jobs. That’s the largest downward revision since a downward revision of 489,000 jobs in 2019 and the second largest downward revision on record, the largest being 824,000 jobs in 2009. Yes, upward revisions can take place, the last time being in 2022. Overall, however, it is more often a downward revision. The surprise was that it was as large as it was and it is coming in an election year, making it fodder for some presidential camps.
The only reason it should not be a surprise is that many thought the job market was softer than what was being reported. The release of the July job numbers, which came in sharply lower than expected, made many suspicious. Unemployment has also been rising. The nonfarm payrolls come from the establishment survey carried out by the Bureau of Labour Statistics (BLS) (www.bls.gov). That survey canvasses businesses. What it doesn’t pick up is those who may be working two jobs. It’s the household survey that smooths that out. Then come the revisions. More accurate is the Quarterly Census of Employment and Wages also put out by the BLS.
But what this does is largely eliminate a lot of jobs that many thought were created. Instead of 218,000 jobs every month in 2023, it now drops to around 150,000. Most of the downward revisions were caused by the private sector where professional and business services took a hit, followed by leisure and hospitality, and manufacturing. Increases were seen in education and health care services.
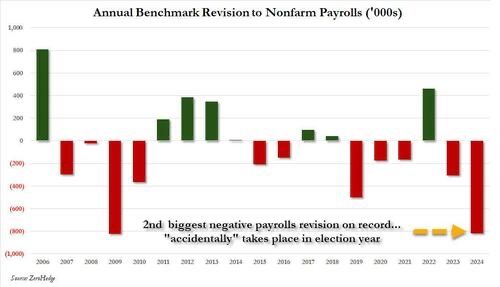
Source: www.zerohedge.com, Courtesy James W. Asia Fixed Income Portfolio Manager, Hong Kong
On the day of the release, markets suffered a minor heart attack and sold off sharply. But the next day Fed Chair Jerome Powell soothed the market at the annual Jackson Hole symposium. The market is now shifting its thoughts to a 50 bp cut in September. It does, however, confirm thoughts the Fed will shift from focusing on inflation to focusing on the labour market. Everyone still wants a soft landing. But, as our chart of the week shows with its focus on the inverted yield curve, instead of a soft landing we are pointed towards a hard landing. Some believe the Fed has waited too long to cut rates. That’s not surprising as they waited too long to hike rates. The Fed is reactive, not proactive, which explains the delays. A look at the weekly initial jobless claims reveals weakness but not a collapse.
The most recent weekly jobless claims were 232,000 vs. an expectation of 240,000 and the previous week’s 228,000. Jobless claims have generally been rising over the past few months. But they still haven’t reached levels seen even in 2023. For the most part, they have often come in under expectations. So that makes this revision that much more of a surprise. Effectively, all the payroll beats of the past year have been eliminated. And this coming in an election year.
Chart on next page
Initial Claims with 4-Week Moving Average 2021–2024
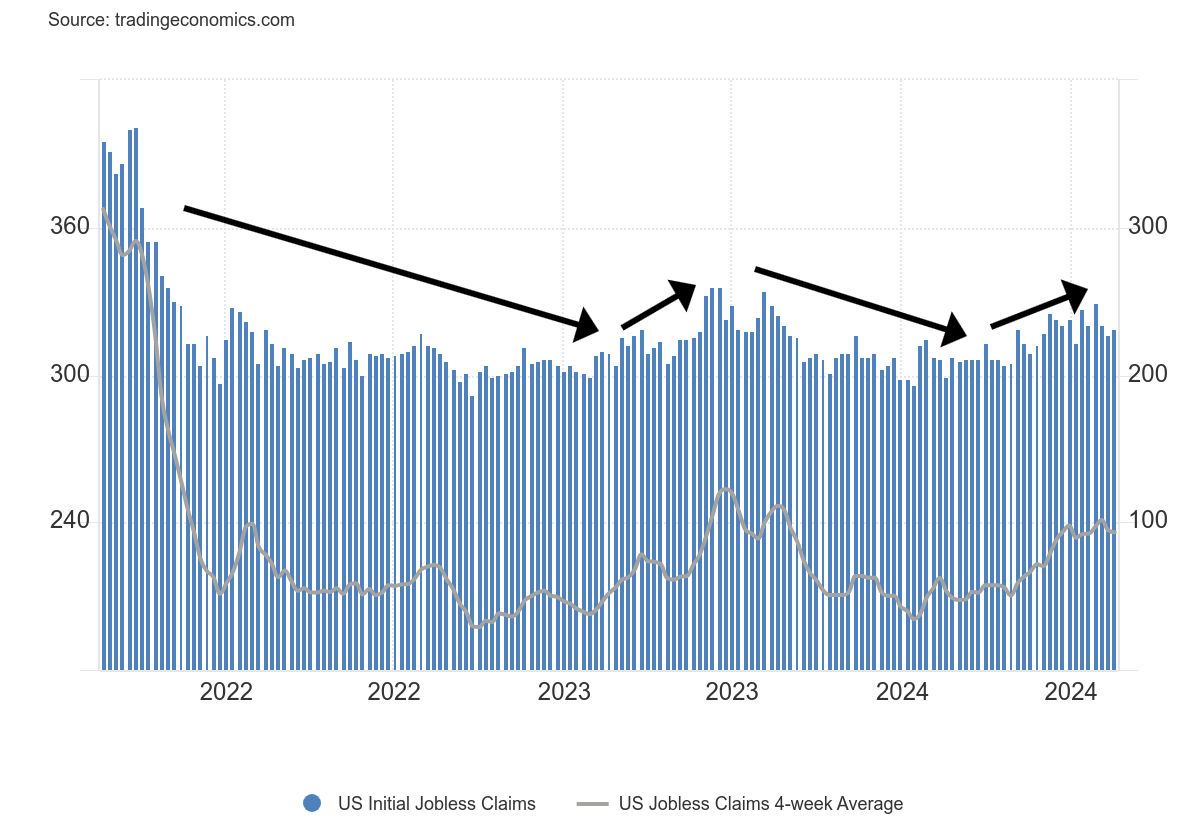
Source: www.tradingeconomics.com, www.dol.gov
Canada’s Rail Strike/Lockout
Canada’s two largest railways, Canadian National (CNR/TO) (CN) and Canadian Pacific Kansas City (CP/TO) (CPKC) are halted after the companies locked out some 9,300 workers, following failed negotiations with the Teamsters Canada Rail Conference. It’s the first time in Canadian history that there has been a railway shut down because of a work stoppage. That the government has now sent this binding arbitration does not mean everything now starts up again. Appeals are underway from the Union. There may be limited work resumptions. Irrespective it just doesn’t start up the next day as it could take more than a few days for things to restart. We’ve learned that the CN union has issued a new strike order while the CPKC union is continuing its strike at least for the moment.
A worse alternative to binding arbitration is back-to-work legislation. But for that to happen, two things must occur. Parliament would need to be recalled, given it is currently on summer vacation. Given the current
minority government at least one party must support any legislation. That is not a given. Nonetheless, even with binding arbitration, this could still have major economic ramifications, not just for Canada but also for the U.S. and even Mexico.
The big concern, of course, is supply disruptions. That’s something we’ve already experienced with the supply disruptions that occurred during the COVID-19 pandemic. Ultimately, it was inflationary. The railways transport some $1 billion of goods daily. As noted, it doesn’t impact just Canada but also the U.S. and even Mexico. There are two railway lines: Canadian National and Canadian Pacific Kansas City. Both have lines reaching into the U.S. and CPKC has lines reaching well down into Mexico.
It has also impacted public transit as GO Transit was shut down between Milton and Hamilton, two Ontario cities. It is also impacting commuter rail traffic in Quebec and B.C. Upwards of 32,000 commuters in Toronto (GTA), Montreal, and Vancouver could be impacted and while it is planned to restart there still could be a few days’ delay. It could also negatively impact ports, particularly the Port of Vancouver where goods are unloaded from ships before being placed on trains. Ships could be stuck at sea, unable to unload.
The list of goods impacted is numerous—food grains, where upwards of $50 million is shipped daily, thus impacting grain producers, fuel, chemicals, where many petrochemicals, petroleum, oil, and coal are shipped to the U.S. daily, lumber and timber, chlorine for cities, fertilizers, automobiles, and consumer goods, including electronics and food. Industry groups are obviously flummoxed by this strike. While many can survive for upwards of a week, the real danger is that the strike/lockout goes beyond that or that binding arbitration drags on with no return to work. Then it could start to have serious ramifications for the Canadian economy and the U.S. too. It could also have a major negative impact on jobs that are ancillary to the rail industry if this drags out. Some have suggested that a prolonged shutdown could cut $3 billion from Canada’s GDP.
We’ve already noted that the Freight Rails Services Price Index has begun to dip. Could it fall further? Statistics Canada notes that contained in the index, are rail shipments of autos, coal, forest products, grain and fertilizers, metals and minerals, and petroleum and chemicals. The impact is widespread and, as noted, it could be inflationary, particularly if the strike/lockout were to continue with a prolonged negotiation of binding arbitration.
Chart on next page
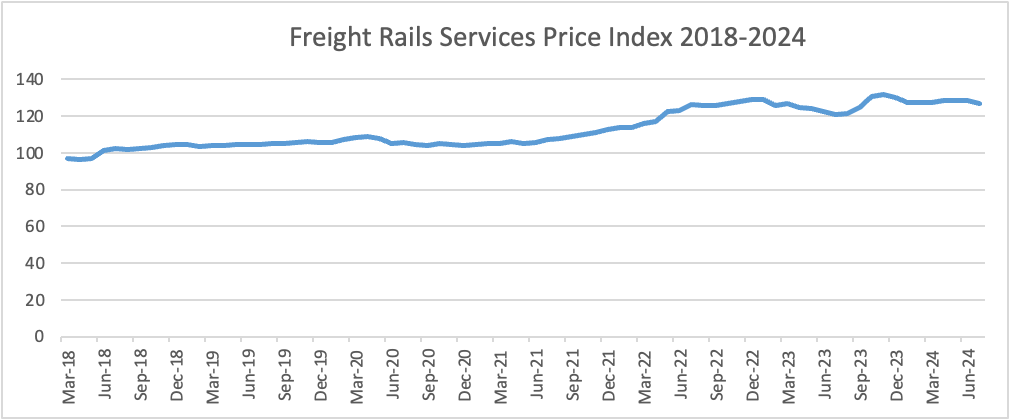
Source: www.statcan.gc.ca
Rest of page blank
Jackson Hole
Powell speaks. Markets rise. A Powell put? “We will do everything we can to support a strong labour market.” Has weakening in the jobs market gone far enough? Rate cuts are almost built-in for September. A 25 bp cut is built in, but will they cut 50 bp? Maybe. Still, some are calling for 100 bp by year-end. The Fed will be data-driven and the outlook measured against the balance of risks. There will not be any knee-jerk reactions. Sharp rate cuts could ignite inflation that sparked the rate rise in the first place. The economy continues to grow and the worst of the pandemic-related economic distortions are behind. The time has come for policy to adjust. They have brought inflation down and now the focus becomes the labour market. With a weakening labour market, it should not be a source of inflation.
U.S. 10-year treasury note, 2-year treasury note, Fed interest rate 2019–2024
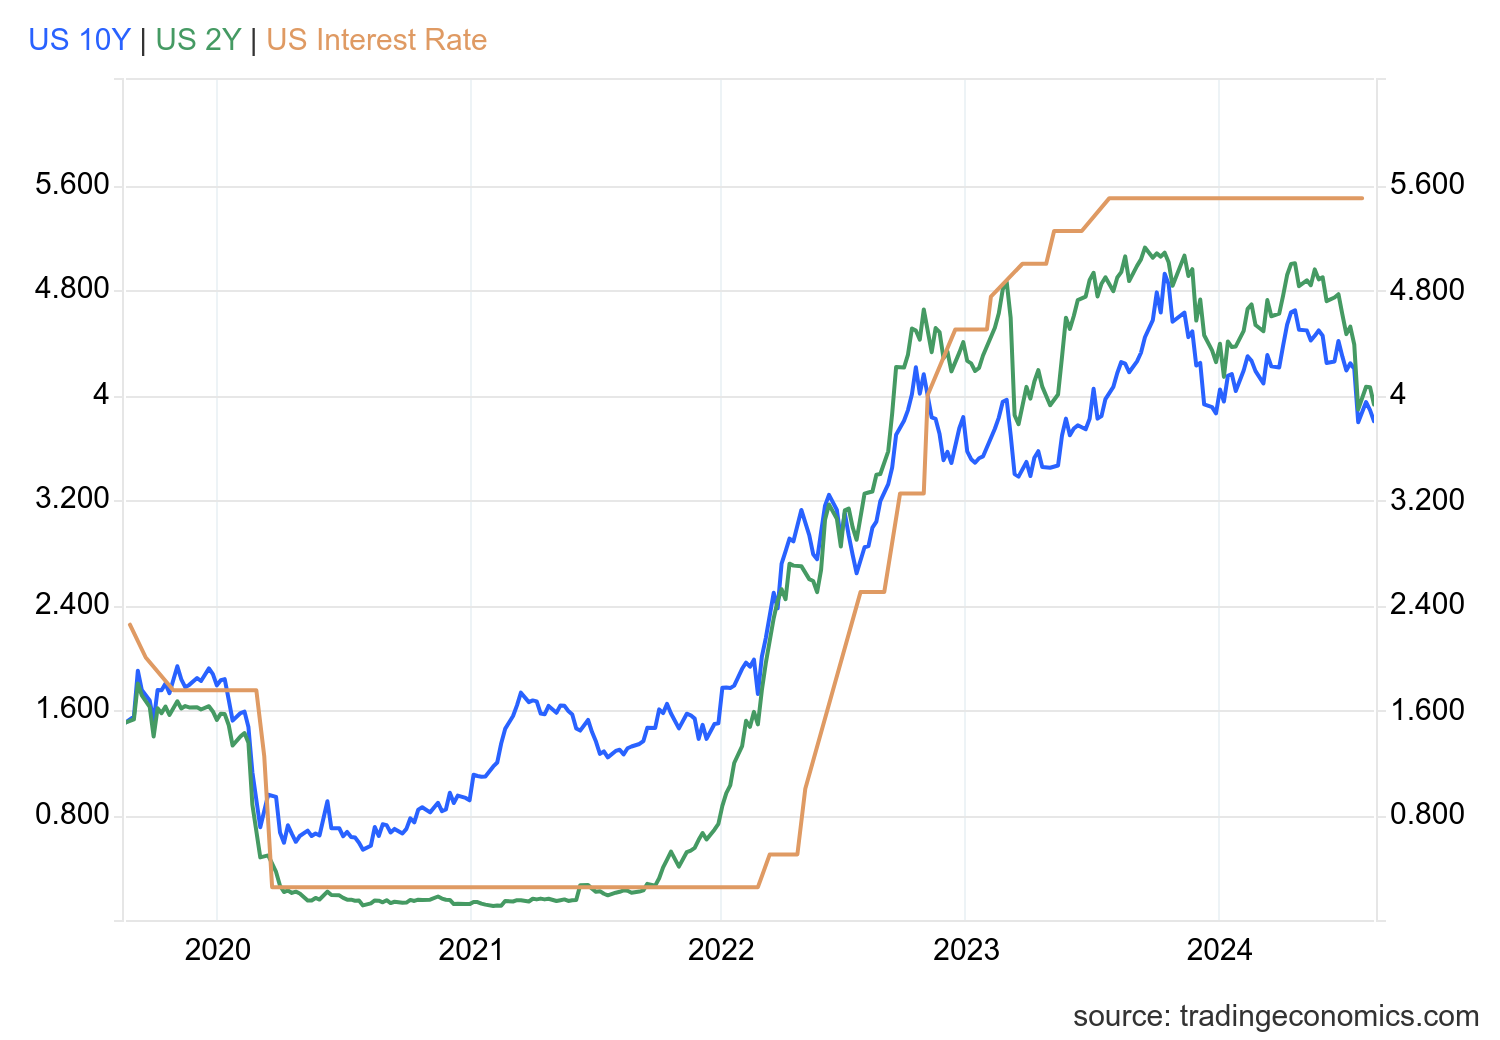
Source: www.tradingeconomics.com, www.federalreserve.gov
Markets cheered. Gold rose. Oil rose. Bond yields fell. The US$ Index fell. It was a love-in.
However, at no time was there any mention of the massive U.S. federal debt, which is now $35.3 trillion, the highest federal government debt in the world. Total U.S. debt (governments, corporations, households) is $101.7 trillion. It is almost one-third of all global debt. Lower interest rates will help lower interest payments. But it does nothing to lower the actual debt, which is estimated to reach $46.8 trillion by 2028. Other markets might be happy with lower rates. Mortgage rates might get cut. Corporations can borrow more cheaply. No wonder stock markets were celebrating. As we noted, was this Powell’s version of a put for markets?
Rest of page is blank
Chart of the Week
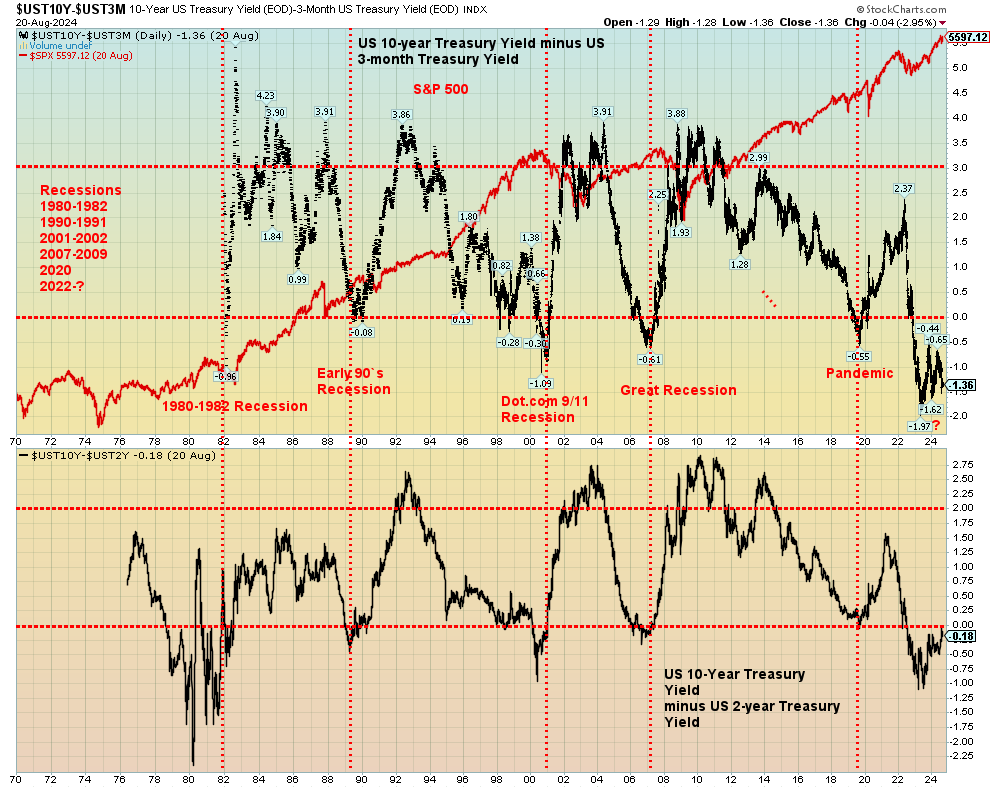
Source: www.stockcharts.com
The inverted yield curve has consistently predicted an oncoming recession since it started being more closely followed in the late 1970s. So far, we’ve had no recession despite an inverted yield curve that has carried on now for a good two years. We haven’t seen one that long since the late 1970s before the 1980 recession, followed by the 1981–1982 recession. That one lasted just under two years for the first iteration before the 1980 recession, followed by another period of one year before the 1981–1982 recession. In between, the yield curve returned to normal for roughly six months as the 1980 recession hit. At the time it was the steepest recession since the Great Depression. That is until the financial crisis recession (Great Recession) of 2007-2009.
There was a brief period of roughly 10 months before the 1990–1991 recession. The same happened in 2000 before the dot.com 9/11 recession officially hit in 2001, lasting into 2002. That period of an inverted yield curve lasted for one year 10 months. The inverted yield curve before the Great Recession lasted only 16 months, even as the recession didn’t get underway officially until eight months later. Before the pandemic recession of 2020, the inverted yield curve lasted only about a month before turning mildly positive once again.
Officially, this one has dragged on since turning inverted for good in August 2022. That makes the current period of an inverted yield curve two years, surpassing the one in the late 1970s. So, what does it all mean? That inverted yield curve period in the late 1970s resulted in the steepest recession since the Great Depression. Officially, it was broken up into two parts. The first part of the recession lasted six months from January to July 1980, triggering a drop of 2.2% in GDP and an unemployment rate of 7.8%. The second part lasted one year four months from July 1981 to November 1982 as the economy fell 2.7% while unemployment peaked at 10.8%. (Note: all these refer to the U.S. Canada experienced roughly the same magnitude of a recession).
However, today’s inverted yield curve is unprecedented in its longevity. Many are now expecting that any recession will at worst case be mild, a soft landing. Some even believe an official recession will not even happen. Fed Chair Paul Volcker raised rates to unheard-of heights in order to wrestle inflation down. Noteworthy was that the inflation had two spikes during the 1970s. The first tranche went from June 1972 to December 1976, peaking at 12.1%. The second lasted from December 1976 to August 1983, peaking at 14.6%. It was during that second bout of inflation that Volcker hiked the key Fed rate to 19% by June 1981 in order to bring down the rate of inflation. It also sparked the steep 1981–1982 recession.
Can history repeat itself? Or at least rhyme? So far, we are not seeing any resurgence of inflation. At least for the moment, all we can say is that the Fed (and the BofC) have wrestled inflation down without sparking a recession. Unemployment has been rising, but it’s not as yet at a level that raises considerable concern. The Fed and the BofC are shifting their focus to the labour market and away from inflation.
Given this unprecedented period of an inverted yield curve, it would be surprising that we escape with only a mild recession or even no official recession. However, for now, it is making those calling for a hard landing look like Cassandras.
One big difference between today and the 1970s is that there was no bubble back then. Fed funds never dipped below 3.30%. The stock market struggled throughout the 1970s. If there was any bubble, it was in commodities, led by gold which soared in a parabolic move in the late 1970s. Today we had Fed funds fall to almost zero for a prolonged period after the Great Recession of 2007–2009. The Fed and other central banks also embarked on quantitative easing (QE) that filled the financial system with liquidity and excessive quantities of money. That in turn sparked a borrowing frenzy, particularly from corporations and households. Government debt rose sharply to combat the effects of the recession.
That in turn created bubbles in almost everything, including the stock market, housing, and more. All debt has basically doubled since 2008, adding to the bubbles. Yes, percentage-wise, the debt increase from 1970 to 1983 was almost triple, but it started from a very low level. Dollar-wise, the increase of $50 trillion since 2008 paled the $4.4 trillion rise from 1970 to 1983. In Q1 1983 all debt to GDP was only 175%. Today it’s 350%.
The inverted yield curve is a harbinger. It’s never failed. The problem is interpreting what today means going forward.
Rest of page is blank
Markets & Trends
|
|
|
|
% Gains (Losses) Trends |
|
||||
|
|
Close Dec 31/23 |
Close Aug 23, 2024 |
Week |
YTD |
Daily (Short Term) |
Weekly (Intermediate) |
Monthly (Long Term) |
|
|
Stock Market Indices |
|
|
|
|
|
|
|
|
|
S&P 500 |
4,769.83 |
5,634.61 |
1.5% |
18.1% |
up |
up |
up |
|
|
Dow Jones Industrials |
37,689.54 |
41,175.08 |
1.3% |
9.3% |
up |
up |
up |
|
|
Dow Jones Transport |
15,898.85 |
15,970.45 |
1.9% |
0.5% |
up |
up |
up |
|
|
NASDAQ |
15,011.35 |
17,877.79 |
3.0% |
19.1% |
up |
up |
up |
|
|
S&P/TSX Composite |
20,958.54 |
23,286.06 (new highs)* |
1.0% |
11.1% |
up |
up |
up |
|
|
S&P/TSX Venture (CDNX) |
552.90 |
578.03 |
2.1% |
4.6% |
up (weak) |
up (weak) |
down |
|
|
S&P 600 (small) |
1,318.26 |
1,412.16 |
3.0% |
7.1% |
up |
up |
up |
|
|
MSCI World |
2,260.96 |
2,434.16 (new highs)* |
2.7% |
7.7% |
up (weak) |
neutral |
up |
|
|
Bitcoin |
41,987.29 |
63,583.02 |
6.6% |
51.4% |
neutral |
up (weak) |
up |
|
|
|
|
|
|
|
|
|
|
|
|
Gold Mining Stock Indices |
|
|
|
|
|
|
|
|
|
Gold Bugs Index (HUI) |
243.31 |
319.42 (new highs) |
2.4% |
31.3% |
up |
up |
up |
|
|
TSX Gold Index (TGD) |
284.56 |
368.70 (new highs) |
0.8% |
29.6% |
up |
up |
up |
|
|
|
|
|
|
|
|
|
|
|
|
% |
|
|
|
|
|
|
|
|
|
U.S. 10-Year Treasury Bond yield |
3.87% |
3.81% |
(2.1)% |
(1.6)% |
|
|
|
|
|
Cdn. 10-Year Bond CGB yield |
3.11% |
3.05% |
(1.3)% |
(1.9)% |
|
|
|
|
|
Recession Watch Spreads |
|
|
|
|
|
|
|
|
|
U.S. 2-year 10-year Treasury spread |
(0.38)% |
(0.13)% |
23.5% |
65.8% |
|
|
|
|
|
Cdn 2-year 10-year CGB spread |
(0.78)% |
(0.29)% |
(16.0)% |
62.1% |
|
|
|
|
|
|
|
|
|
|
|
|
|
|
|
Currencies |
|
|
|
|
|
|
|
|
|
US$ Index |
101.03 |
100.68 |
(1.7)% |
(0.4)% |
down |
down |
neutral |
|
|
Canadian $ |
75.60 |
74.03 |
1.2% |
(2.1)% |
up |
neutral |
down |
|
|
Euro |
110.36 |
111.93 |
1.5% |
1.4% |
up |
up |
up (weak) |
|
|
Swiss Franc |
118.84 |
117.98 |
2.2% |
(0.7)% |
up |
up |
up |
|
|
British Pound |
127.31 |
132.14 |
2.1% |
3.8% |
up |
up |
up (weak) |
|
|
Japanese Yen |
70.91 |
69.33 |
2.3% |
(2.2)% |
up |
up |
down |
|
|
|
|
|
|
|
|
|
|
|
|
|
|
|
|
|
|
|
|
|
|
Precious Metals |
|
|
|
|
|
|
|
|
|
Gold |
2,071.80 |
2,546.30 (new highs)* |
0.3% |
22.9% |
up |
up |
up |
|
|
Silver |
24.09 |
29.82 |
3.4% |
23.8% |
neutral |
up |
up |
|
|
Platinum |
1,023.20 |
966.10 |
0.4% |
(5.6)% |
down (weak) |
neutral |
down (weak) |
|
|
|
|
|
|
|
|
|
|
|
|
Base Metals |
|
|
|
|
|
|
|
|
|
Palladium |
1,140.20 |
942.50 |
(0.1)% |
(17.3)% |
neutral |
down |
down |
|
|
Copper |
3.89 |
4.20 |
1.5% |
8.0% |
neutral |
neutral |
neutral |
|
|
|
|
|
|
|
|
|
|
|
|
Energy |
|
|
|
|
|
|
|
|
|
WTI Oil |
71.70 |
74.83 |
(0.9)% |
4.3% |
down |
neutral |
down (weak) |
|
|
Nat Gas |
2.56 |
2.18 |
2.8% |
(14.8)% |
neutral |
neutral |
down |
|
Source: www.stockcharts.com
Note: For an explanation of the trends, see the glossary at the end of this article.
New highs/lows refer to new 52-week highs/lows and, in some cases, all-time highs.
- * New All-Time Highs
Source: www.stockcharts.com
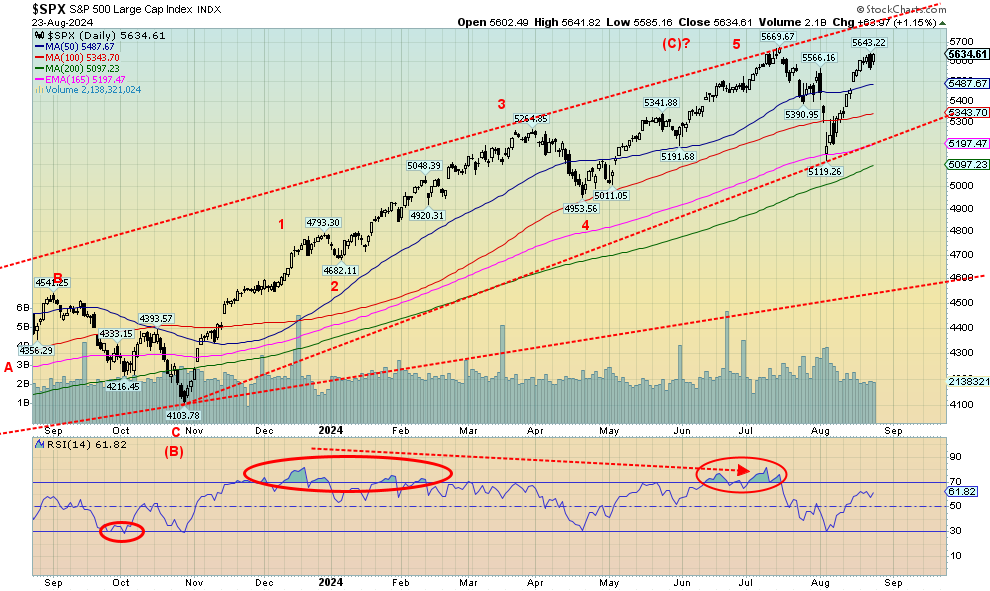
Thank you, Jerome Powell, whose soothing words on Friday at Jackson Hole allowed the stock markets to recover after they were hit hard on Thursday, August 22, following the sharp downward revision of nonfarm payrolls. The bounce-back on Friday allowed the S&P 500 to gain about 1.5% on the week. The Dow Jones Industrials (DJI) was up 1.3%, the Dow Jones Transportations (DJT) gained 1.9%, and the NASDAQ was up almost 3.0%. The S&P 400 (Mid) gained 2.8% while the S&P 600 (Small) was up 3.0%. The sharp gains seen for the Mid and the Small encouraged many to suggest that it was great news for the markets that are now poised to go higher. If they are buying the Mid and the Small, it’s a sign of a strong market. Or it’s a hook. The S&P 500 Equal Weight Index gained 2.0% to new all-time highs. Bitcoin recovered over $60,000, up 6.6%.
In Canada, the TSX Composite gained 1.0% to new all-time highs and the TSX Venture Exchange (CDNX) was up 2.1%. In the EU, the London FTSE was up about 0.3%, the EuroNext gained 0.8%, the Paris CAC 40 1.7%, as did the German DAX. In Asia, China’s Shanghai Index (SSEC) was off 0.9%, the Tokyo Nikkei Down (TKN) gained 0.8%, while Hong Kong’s Hang Seng (HSI) was up almost 1.0%.
As we have noted elsewhere, volume is not keeping up with the gains in the market. Volume has actually been sliding, suggesting to us that this could be a sucker’s rally. Yes, the RSI is only at about 62, suggesting we
could move higher. And yes, that could happen. But divergences are everywhere, particularly the ongoing non-confirmation between the DJI and the DJT. The averages must confirm each other and they are not even close.
With the S&P 500 (SPX) poised to possibly make new all-time highs, we need others to confirm. In looking at the others we just don’t see that happening. Numerous divergences are also visible between the SPX and key indicators such as the percentage of stocks trading over their 200-day MA and the advance/decline line. Admittedly, the AD line has made new highs but the SPX hasn’t, so far.
Despite the strong performance this past week for the Mid and Small that suggests a broadening of the rally, we remain suspicious. We are moving firmly into the down period for stocks. The question is, where will we top? In 1929, it was early September. In 2007, it held on until early October. Both resulted in devastating drops over the next two years.
Rest of page is blank
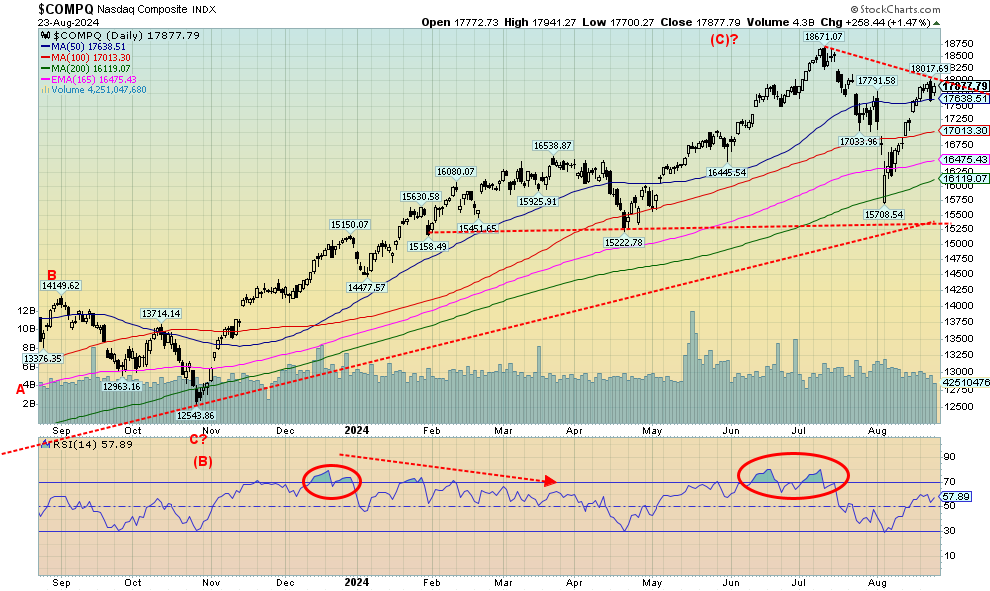
Source: www.stockcharts.com
The NASDAQ rose this past week, gaining almost 3.0%. But it remains short of new all-time highs. Others, including the S&P 500, are closer to new all-time highs than the NASDAQ. Its big driver, the Magnificent 7 and the NY FANG Index were not overly impressive this past week. The NY FANG Index was flat on the week. Of the Magnificent 7, there were all-time highs made by Meta and Netflix, but in the case of Meta, it was barely up on the week. Five of the Magnificent 7 gained on the week while two were down. The NY FANG Index has 10 components and Snowflake suffered a drop of 9.5%, dragging the index down. Snowflake makes up just over 9% of the index. The largest component is Tesla which constitutes 11.6%. Technically, the NASDAQ needs to break out over 18,000 to suggest new highs ahead. The high this week was 18,017, but the level didn’t hold. At least not yet. Support is easily seen down to 17,000 with major long-term support near 15,000.
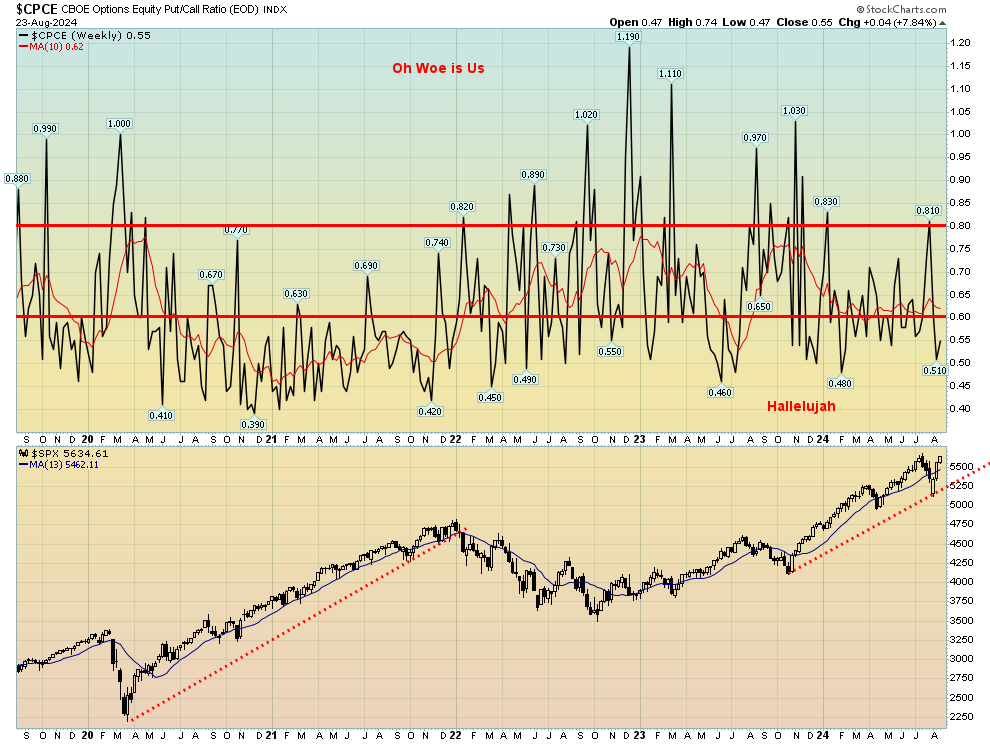
Source: www.stockcharts.com
Another sign of complacency in the markets is the CBOE put/call ratio. The ratio recently fell 0.51 which put it in the hallelujah camp. Even in the recent pullback during the yen carry trade mini-collapse, the ratio rose to only 0.81, failing to get into the super fear camp. Something to keep in mind going forward. The market is complacent. Not a good sign.
Source: www.stockcharts.com
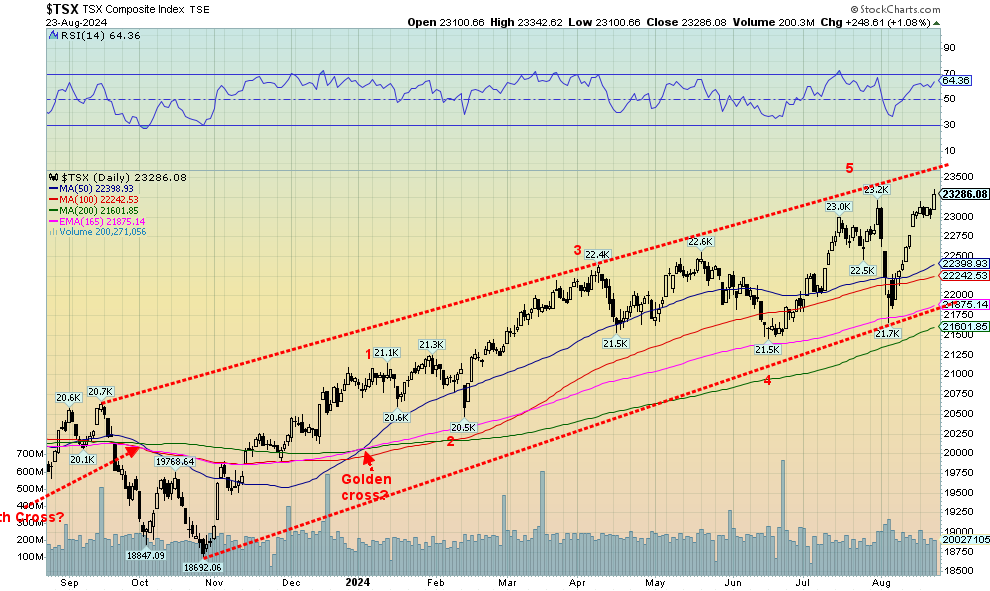
The TSX Composite followed the U.S. markets higher this past week, gaining 1.0% to new all-time highs, the only index to do so. The TSX Venture Exchange (CDNX) also rose, up 2.1%. Yes, there is life on the CDNX. Leading the way up was Real Estate (TRE), up 3.9%. It was followed by Income Trusts (TCM), up 3.4%. Both indices made fresh all-time highs. They rallied on the basis of further interest rate cuts in Canada, following strong hints that the U.S. will cut rates in September. On the week, of the 14 sub-indices 11 were up, one was flat (Health Care (THC), while two fell: Energy (TEN) and, surprisingly, Consumer Staples (TCS). The TEN fell 1.7% while TCS was off 1.1%. Both Financials (TFS) and Golds (TGD) made fresh 52-week highs. The TSX 60 also made new all-time highs. The TSX appears to have more room to rise in that bull channel. The top appears to be around 23,600. There is support down to 23,000, but better support is found at 22,200/22,400, then down to 22,000. Volume was a bit mediocre, making us suspicious of this rally. The RSI is at 64, suggesting we do have room to move higher.
U.S. 10-year Treasury Note, Canada 10-year Bond CGB
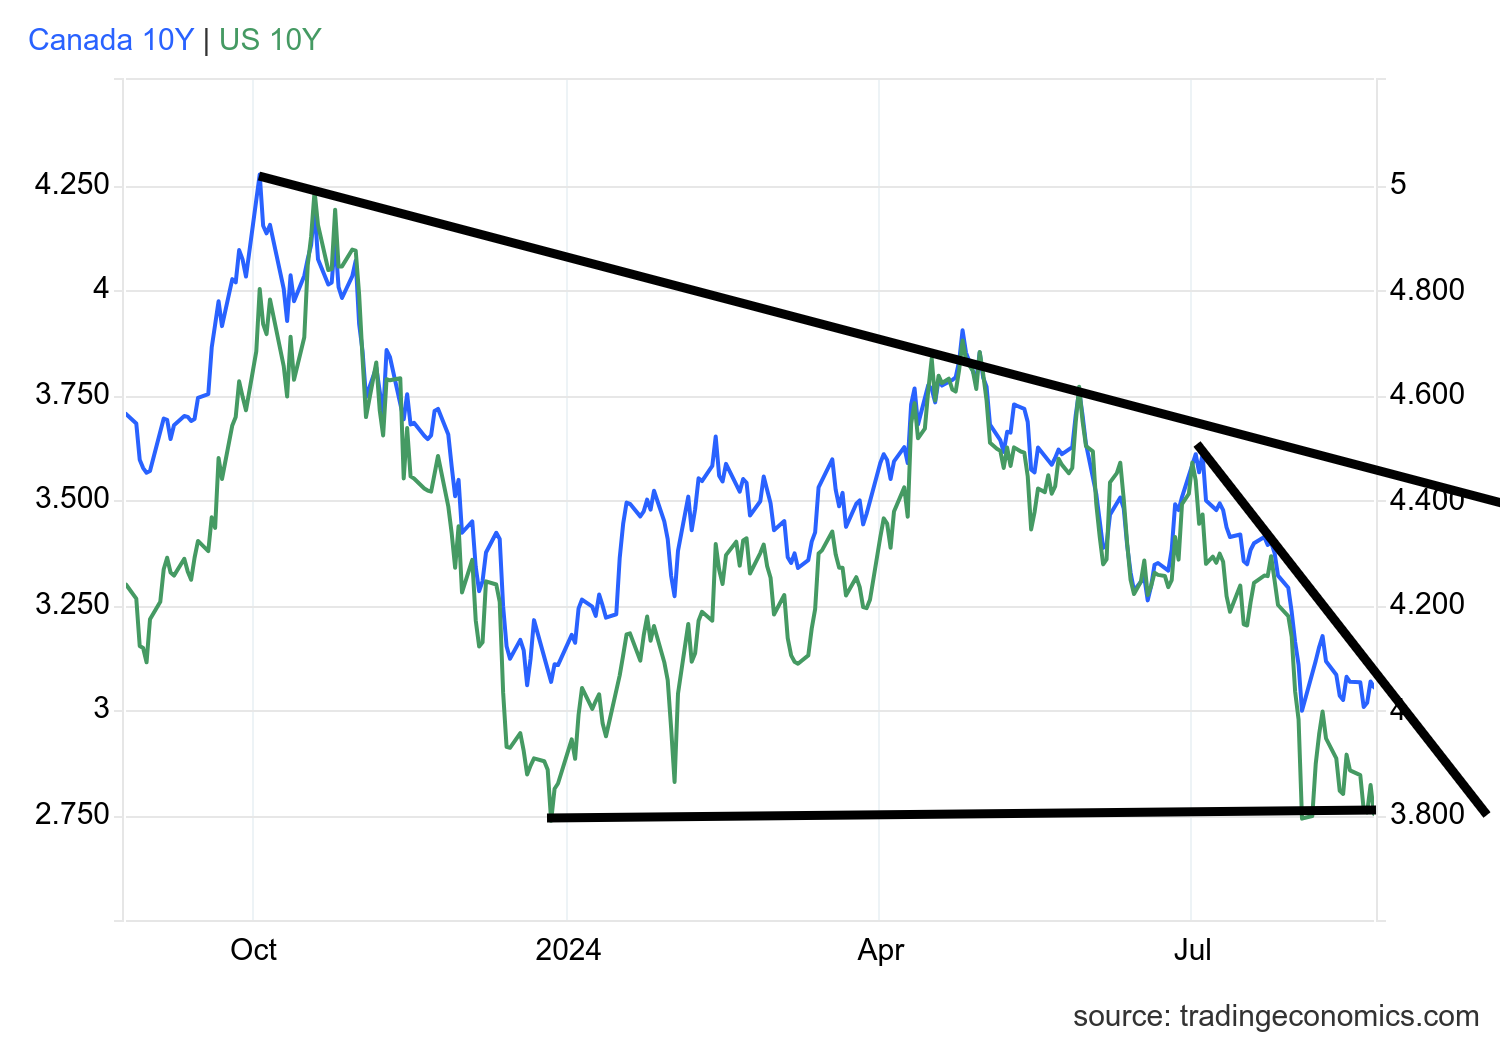
Source: www.tradingeconomics.com, www.home.treasury.gov, www.bankofcanada.ca
Bond yields fell this past week, thanks to the dovish statements of Fed Chair Jerome Powell and his “the time has come” to adjust policy from a focus on inflation to a focus on the labour market. The U.S. 10-year treasury note fell to 3.81% from 3.89% while the Canadian Government of Canada 10-year bond (CGB) fell to 3.05% from 3.09%. More rate cuts are also expected in Canada. The market is suggesting that U.S. rate cuts could be upwards of one full point (100 bp) by year-end. The U.S. 2-year treasury note fell 14 bp to 3.92%, while the 30-year treasury bond fell 5 bp. The 2–10 yield spread narrowed to negative 13 bp from negative 17 bp, while in Canada it actually rose slightly to negative 29 bp from negative 25 bp. It’s not that a recession in Canada is less likely than in the U.S. The rail strike could spark considerable damage to the Canadian economy as well as the U.S. The key for rate cuts could come with the August jobs report out on September 6. Next week we have the Conference Boards’ consumer confidence index, the second estimate of Q2 GDP and PCE prices. They are actually forecasting that Q2 GDP could jump to up 2.8% vs. the previous estimate of 1.4%. PCE prices are predicted to continue to fall. Nonetheless, the big news this week is the Fed pivot and expectations of a rate cut in September.
Source: www.stockcharts.com
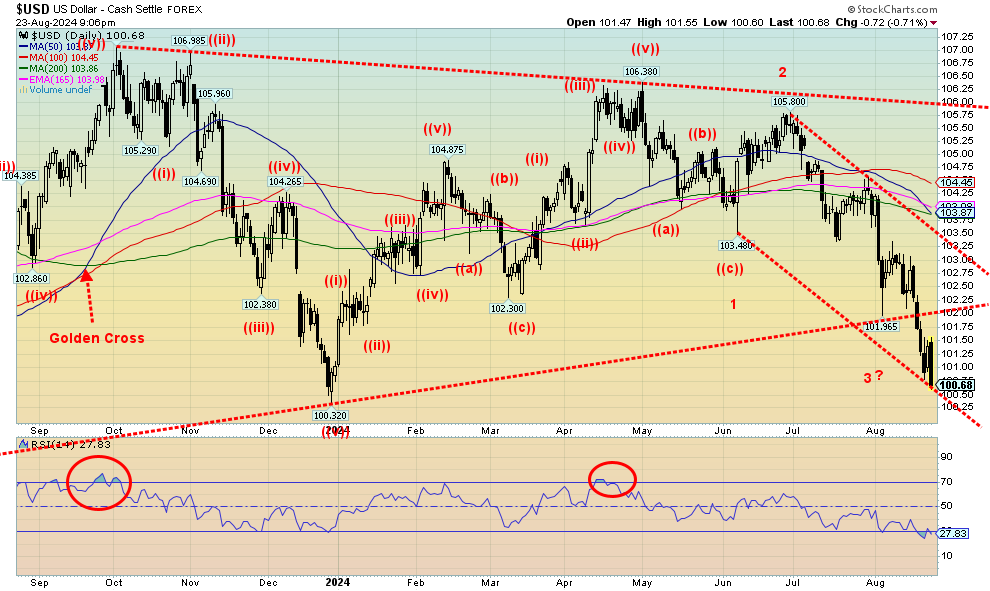
Dovish Fed. Divisive election. Unsettled world. China, Russia, and others dumping U.S.-denominated securities as there is concern about conflict and the massive U.S. debt. They buy gold. We broke support at 102 this past week, closing at the lowest level seen since December 2023. The odds favour that low being taken out in the coming weeks. Yes, we drew a support line down, suggesting we could be forming a down channel with the bottom here and resistance up to 102.25. Odds favour lower prices, not higher prices. A falling US$ Index is positive for gold, oil and commodities. The channel can just keep on falling with support down to around 100.25. The former support level of 102 now becomes resistance. This wave still has further downside capability, but it's recognized that a rebound could occur at any time.
Source: www.stockcharts.com
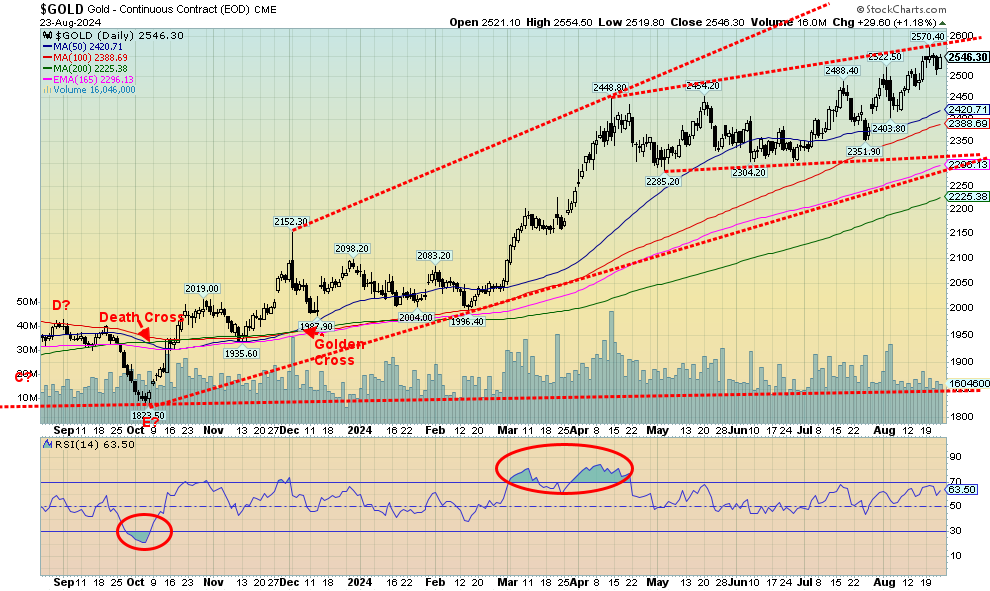
Thanks to Jerome Powell and thoughts of an interest rate cut coming, gold prices held $2,500 after hitting a new all-time high at $2,570. On the week, gold rose 0.3%. This continues what we believe is a stealth rally in gold. The pattern that formed after that high in March 2024 still appears as a rising or ascending triangle. That’s bullish. This past week silver led with a gain of 3.4%. That was also quite positive. Besides Powell signaling interest rate cuts, gold has been having a banner year, thanks to strong central bank buying, strong demand particularly out of Asia (India and China), and safe haven status thanks to geopolitical risk with the wars in Russia/Ukraine, Israel/Hamas (and others), and a potentially divisive U.S. election.
Besides gold and silver, platinum gained 0.4%. However, palladium fell 0.1% while copper regained $4.20, up 1.5%. Copper rising and potentially leading again is also positive for gold. But it was Powell’s rate cut musings that helped spark gold’s rise on Friday, as well as a rise for other commodities, including oil and copper. $2,600 is now in sight. Support is seen down to $2,500, but below that we have further support at $2,400 and even better down to $2,325. Not that we expect to fall that far on any pullback. We continue to have what we see as a stealth rally for gold and if funds started shifting more into the precious metals market, including the gold stocks, it is such a small market that it would only take about a 1% shift out of the broader market. As to the gold stocks, the Gold Bugs Index (HUI) gained 2.4% while the TSX Gold Index (TGD) was up 0.8% this past week. Both saw fresh 52-week highs earlier in the week.
The message is simple. Buy gold and gold-related products. Gold is preferred as, unlike gold stocks, it has no liability.
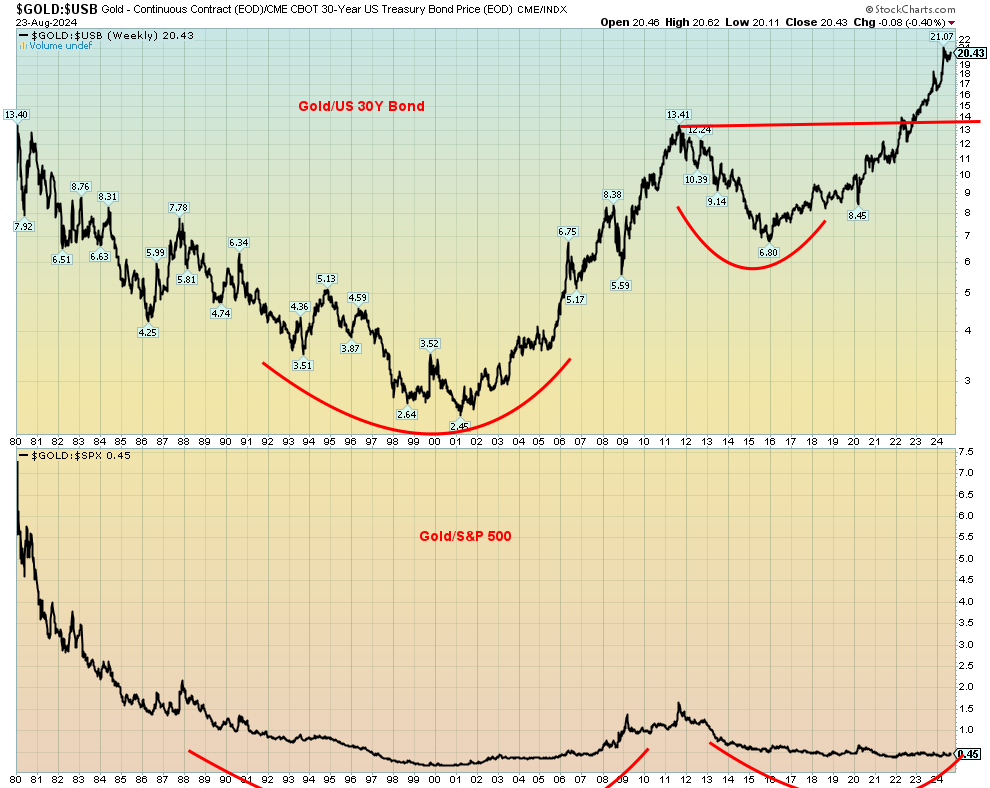
Gold/US 30Y Bond Ratio, Gold/S&P 500 Ratio 1980–2024
Source: www.stockcharts.com
Does one hold gold, bonds, or stocks? The chart above depicts the Gold/US 30Y Bond Ratio and the Gold/S&P 500 Ratio. In the first instance, gold has clearly broken away in its favour. Hold gold over bonds. Note what appears to be a multi-year cup and handle pattern. The first target at 20.02 has been seen and exceeded, suggesting we could move to the next target up to 24.10. The Gold/S&P 500 Ratio is somewhat unclear. However, we note a long period forming what appears to be a rounding bottom. That pattern broke out in 2007 and culminated in the gold top in 2011. The current pattern is not dissimilar to what was seen from 1990 to 2006 before it broke out in favour of gold. That it hasn’t is a testament to the strength of the U.S. stock market. Gold has kept pace, but neither has broken away from the other. The pattern, however, suggests it should break out in favour of gold. That gold is favoured over U.S. treasuries may be reflected in the action of central banks that have been unloading U.S. treasuries in favour of gold.
Source: www.stockcharts.com
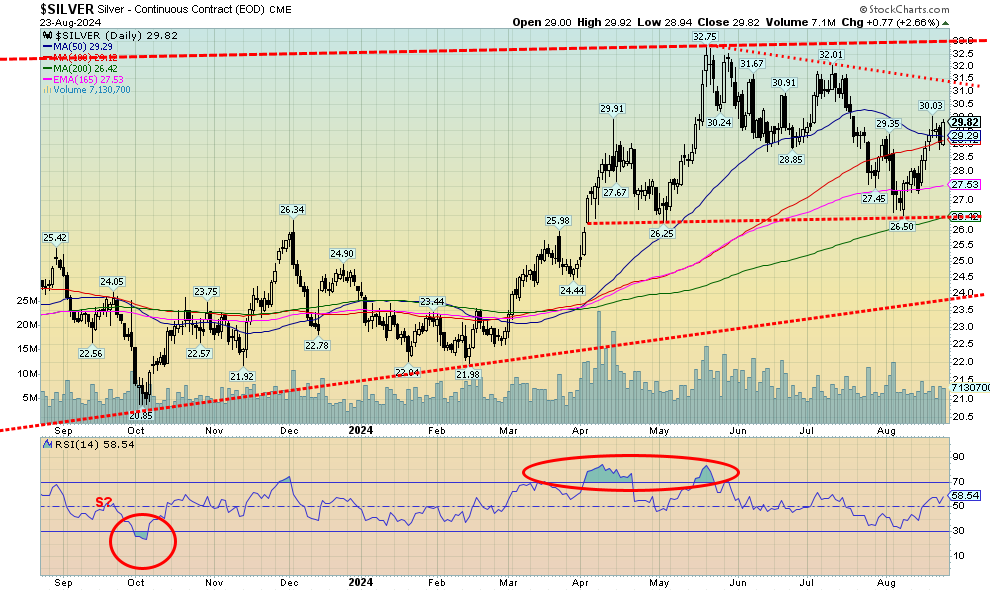
One good thing about silver’s action this past week is that it finally appears to be taking leadership among the precious metals. We have often noted that a really good rally won’t get underway until silver takes the lead. This past week silver gained 3.4% to gold’s 0.3%. It was the second week in a row that silver has led. But before we get too excited, silver still lags gold in a number of areas. Gold has been making all-time highs, while silver is not even close. Gold has broken out to new highs but silver has not, despite recent gains. We first need to get over $31 to suggest new highs above the recent high of $32.75 and we need to get over $33 to suggest we could now be on our way to targets up to $39/$40. There is support now at $29, but below that, we could then fall back to $27. Silver’s RSI is still only at 58.5, suggesting we have considerable room to move higher. While silver is responding to the same thing as gold, namely interest rate cuts, and a falling US$ Index, silver also remains in deficit supply even as demand has been rising, thanks to green energy projects. What we also need to see is a pickup in volume for silver, not dissimilar to what we saw last April 2024 and to a lesser extent in May 2024.
Source: www.stockcharts.com
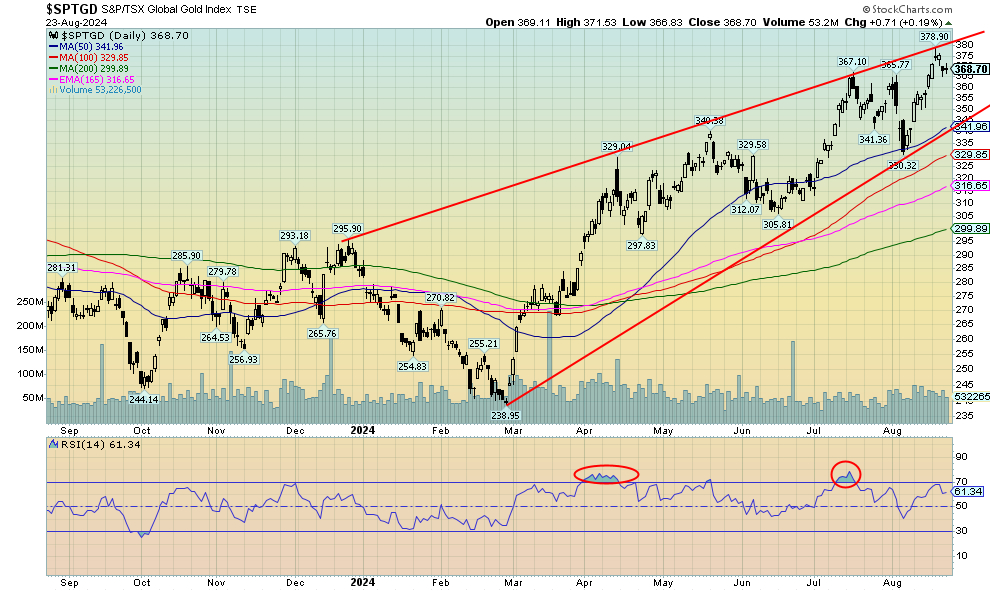
Gold stocks enjoyed an up week, but after hitting a high on Tuesday, August 20 the stocks pulled back on what may have been profit-taking. During the week, the TSX Gold Index (TGD) was up 0.8% while the Gold Bugs Index (HUI) gained 2.4%. Anglo Gold (AU) is not a component of the TGD and it enjoyed a strong up week, giving the HUI the edge. Nonetheless, both indices did make fresh 52-week highs on Tuesday before pulling back. We did hit the top of what may be a bull channel this past week. However, the breaking of what may have been a double top suggests to us that we are still poised to go higher. Potential targets are up to 404. The all-time high is 455 set back in 2011. At this point, we are still over 20% away from that high. The HUI has a lot more work as its high was 639 in 2011 vs. 319 today. That leaves the HUI needing to gain 100% from current levels to reach that high. For the TGD, there is support at 365, but below that good support doesn’t come in until 340/342. Below that level, the rally may be over. The index is still not overvalued here, nor is it overbought here with an RSI at 61.3. It still has considerable room to move higher.
Source: www.stockcharts.com
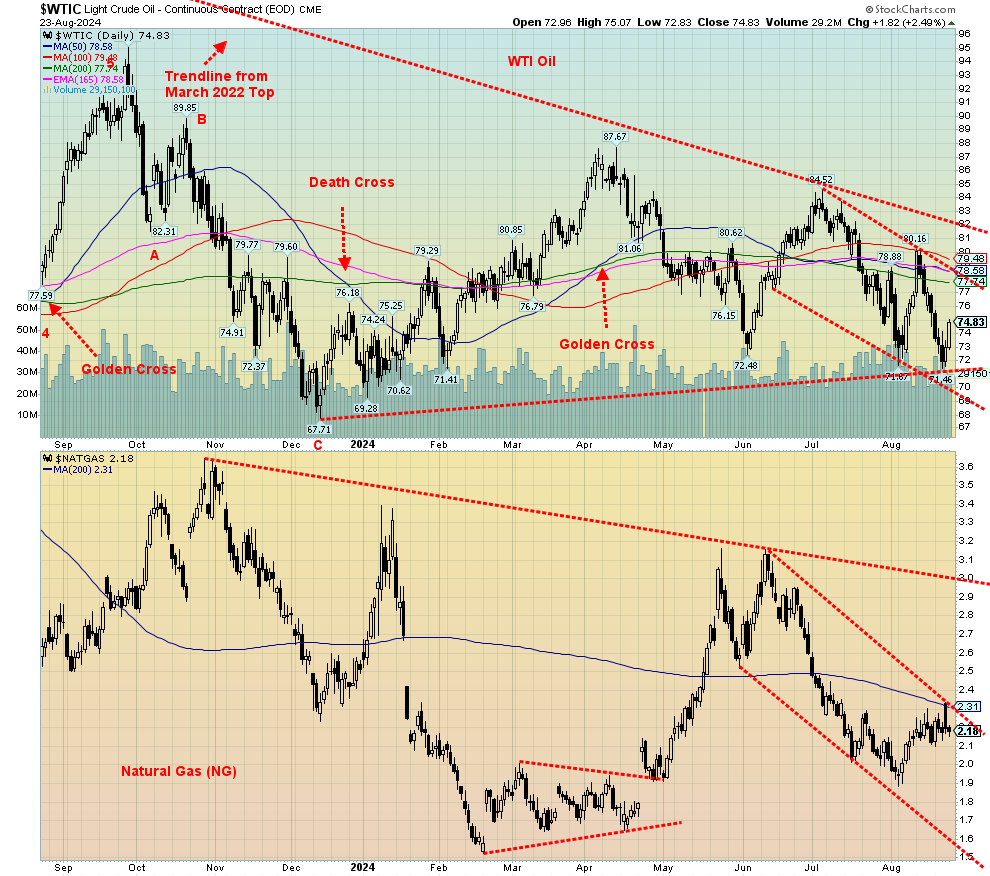
After demand concerns overwhelmed geopolitical concerns, oil prices have been falling. The low this past week surpassed the low seen in July. However, support near $72 appears to have held and on Friday, August 23 oil prices rebounded sharply, up 2.5% as the market was emboldened by Fed Chairman Jerome Powell’s hint that interest rate cuts were coming. Oil, gold, stocks, and bonds (price) all rose as the US$ Index fell. Naturally, oil is not out of the woods just yet as resistance up to $78 and $80 must be overhauled if we are to go higher. Over $82 oil prices break out. The expectation is that the economy will slowly improve if the Fed embarks on rate cuts, which could raise the demand for oil.
Natural gas (NG) also bounced back; however, a nascent rebound was snuffed out on Friday when it was learned that the EIA reported a better-than-expected storage increase at the Henry Hub. Full storage tanks and no further threat from the Russia/Ukraine war also pulled NG at the Dutch Hub back as well.
On the week, WTI oil was still down, losing 0.9%. Brent crude fell further, off 1.9%. NG held on to a 2.8% gain but lost almost 7% from the highs on Thursday. It was that kind of week. NG at the Dutch hub was down 7.2%. The energy stocks were also off, with the ARCA Oil & Gas Index (XOI) down 0.8% and the TSX Energy Index (TEN) off 1.7%. Friday’s rebound for WTI oil was encouraging, but there is a lot of work to be done before a significant breakout occurs. $72 appears to be the key support zone for now. Strong seasonals for both oil and gas don’t get underway until December. Geopolitical events (i.e., an Israel/Iran war) could also spark oil higher.
|
GLOSSARY Trends Daily – Short-term trend (For swing traders) Weekly – Intermediate-term trend (For long-term trend followers) Monthly – Long-term secular trend (For long-term trend followers) Up – The trend is up. Down – The trend is down Neutral – Indicators are mostly neutral. A trend change might be in the offing. Weak – The trend is still up or down but it is weakening. It is also a sign that the trend might change. Topping – Indicators are suggesting that while the trend remains up there are considerable signs that suggest that the market is topping. Bottoming – Indicators are suggesting that while the trend is down there are considerable signs that suggest that the market is bottoming. |
Disclaimer
David Chapman is not a registered advisory service and is not an exempt market dealer (EMD) nor a licensed financial advisor. He does not and cannot give individualised market advice. David Chapman has worked in the financial industry for over 40 years including large financial corporations, banks, and investment dealers. The information in this newsletter is intended only for informational and educational purposes. It should not be construed as an offer, a solicitation of an offer or sale of any security. Every effort is made to provide accurate and complete information. However, we cannot guarantee that there will be no errors. We make no claims, promises or guarantees about the accuracy, completeness, or adequacy of the contents of this commentary and expressly disclaim liability for errors and omissions in the contents of this commentary. David Chapman will always use his best efforts to ensure the accuracy and timeliness of all information. The reader assumes all risk when trading in securities and David Chapman advises consulting a licensed professional financial advisor or portfolio manager such as Enriched Investing Incorporated before proceeding with any trade or idea presented in this newsletter. David Chapman may own shares in companies mentioned in this newsletter. Before making an investment, prospective investors should review each security’s offering documents which summarize the objectives, fees, expenses and associated risks. David Chapman shares his ideas and opinions for informational and educational purposes only and expects the reader to perform due diligence before considering a position in any security. That includes consulting with your own licensed professional financial advisor such as Enriched Investing Incorporated. Performance is not guaranteed, values change frequently, and past performance may not be repeated.
About the author


Website: https://www.enrichedinvesting.com
Disclaimer: David Chapman is not a registered advisory service and is not an exempt market dealer (EMD) nor a licensed financial advisor. We do not and cannot give individualised market advice. David Chapman has worked in the financial industry for over 40 years including large financial corporations, banks, and investment dealers. The information in this newsletter is intended only for informational and educational purposes. It should not be considered a solicitation of an offer or sale of any security. The reader assumes all risk when trading in securities and David Chapman advises consulting a licensed professional financial advisor before proceeding with any trade or idea presented in this newsletter. David Chapman may own shares in companies mentioned in this newsletter. We share our ideas and opinions for informational and educational purposes only and expect the reader to perform due diligence before considering a position in any security. That includes consulting with your own licensed professional financial advisor.