
“A man is robbed on the stock exchange, just as he is killed in a war, by people whom he never sees.”
—Alfred Capus, French journalist and playwright, editor of Figaro 1914; 1858–1922
“Gold and silver are money…Everything else is credit.”
—J.P. Morgan, American financier, investment banker, dominant on Wall Street during the “Gilded Age” (1870–1900), head of banking firm that became J.P. Morgan & Co.; 1837–1913
“Masses are always breeding grounds of psychic epidemics.”
—Carl Jung, Swiss psychiatrist, psychoanalyst, founder of analytical psychology; worked with Sigmund Freud, founder of psychoanalysis; 1875–1961
“Inflation is as violent as a mugger, as frightening as an armed robber, and as deadly as a hit man.”
—Ronald Reagan, 40th president of the United States 1981-1989, member Republican Party, 33rd governor of California 1967–1975, Hollywood actor and union leader, president of the Screen Actors Guild 1947–1952, 1959–1960; 1911–2004
What to make of what is going on today? We know history doesn’t repeat itself, but it does rhyme. And we know we are now into an extremely exceptional period. Many of us have never experienced what we are going through today. And that is a prime reason we tend to make the same mistakes over and over again, but with a new generation.
Inflation has reared its ugly head. For the past forty years inflation has been on a downward tilt and largely not a factor—ideal conditions for a strong stock market. The U.S. reported this week the highest rate of inflation since 1981. But back then inflation was on a downward trajectory. Now inflation is on an upward trajectory. Prices may be rising, but wages so far are not keeping up. To combat inflation, the central banks are going to hike interest rates. Bank of Canada (BofC) did it this week with a 50 bp hike. However, hiking interest rates risks tipping the stock markets into a downtrend and the economy into a recession.
Inflation is a problem that we haven’t had to deal with since the 1970s. It was wrestled to the ground back then by hiking interest rates above the rate of inflation. It sparked the steep 1980-1982 recession when GDP fell 2.7% and unemployment (U3) soared to 10.8%. Contributing to the recession was the 1979 Iranian crisis that spiked oil prices to record highs. Unemployment remained elevated for years even as the worst of the recession passed. While GDP didn’t quite fall as much as it did during the 1973–1975 recession, the unemployment rate was the steepest since the recession (depression?) of 1937–1938. Unemployment didn’t exceed that level until the pandemic recession of 2020 and GDP didn’t exceed that level to the downside until the Great Recession of 2007–2009.
Note the chart below. Are we in the early 1970s rise for inflation? Or are we in the late 1970s inflationary rise? We believe it could be the former. That suggests to us that we could be experiencing a decade of 1970s-type inflation with ups and downs.
U.S. CPI and Core CPI Year-Over-Year % Change 1957–2022
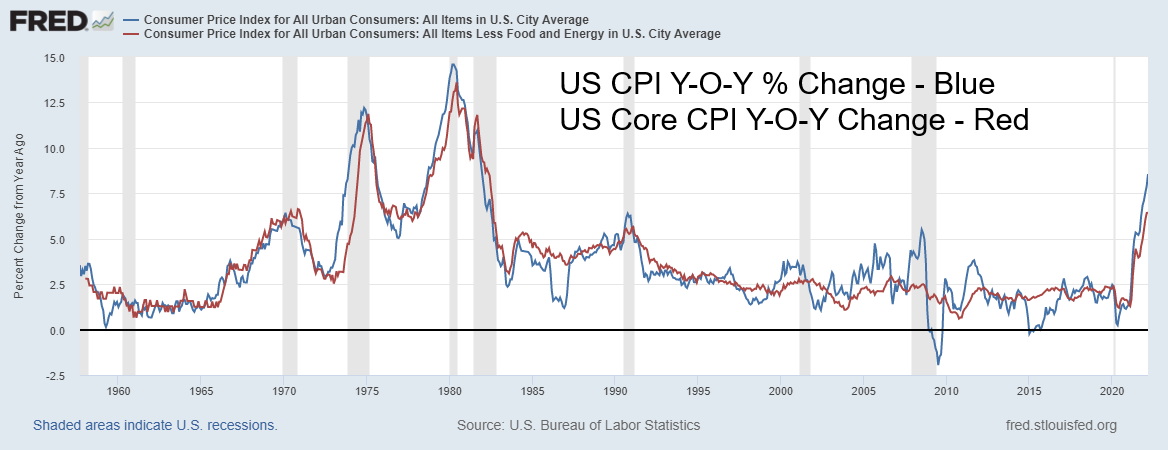
Source: www.stlouisfed.org,
However, inflation is not just a problem for the U.S. It is rising everywhere due to supply disruptions, contracting global trade, an energy crisis, and a growing food crisis sparked by the war in Ukraine. But that’s just an add-on. Energy and food prices were already rising before war broke out as a result of supply disruptions and demand shortages. Our table below for the G7 outlines how this is a growing problem with inflation rates exceeding growth rates and interest rates.
|
G7 Countries |
Current Rate of Inflation Y-O-Y % Last |
GDP Growth Y-O-Y % Last |
Current Bank Rate % |
Current 10-year Bond Rate % |
|
U.S. |
8.5 |
5.5 (Q4) |
0.25 |
2.67 |
|
Canada |
5.7 |
3.3 (Q4) |
1.00 |
2.61 |
|
Germany |
7.3 |
1.8 (Q4) |
(0.88) |
0.77 |
|
France |
4.5 |
5.4 (Q4) |
0.68 |
1.27 |
|
U.K. |
7.0 |
6.6 (Q4) |
0.75 |
1.81 |
|
Italy |
6.7 |
6.2 (Q4) |
1.72 |
2.38 |
|
Japan |
0.9 |
0.7 (Q4) |
(0.1) |
0.25 |
Source: www.tradingeconomics.com
As can be seen, the current rate of inflation in the G7 countries exceeds the last reported growth rate (GDP), the current central bank rate, and the current 10-year bond rate. Forecasts suggest that Q1 2022 GDP growth will be well below Q4 2021 GDP growth. That suggests to us that we are already experiencing stagflation. As in
the past, bank rates will have to exceed the inflation rate and possibly the 10-year too to bring inflation back down again. The result should be that growth falls and even turns negative, as happened in the past. In 1981 the Fed raised the Fed Funds rate to 20% to bring down the inflation rate that was running at around 14% at the time.
Energy and food inflation are both already causing problems with growing unrest in a number of countries, especially over sharply rising food prices. That’s what happens when Russia/Ukraine produce upwards of 30% of wheat but also significant yields of corn and barley. Ukrainian farmers are going to miss crucial planting and harvesting seasons. Fertilizers are also threatened. It has been noted that this is unprecedented since World War II. Already we are reading of unrest in a number of countries in the Middle East, South Asia, and Africa. Expectations are that could heighten into the summer.
But that is only one part of the growing instability. The war in Ukraine has created the biggest crisis since World War II. While the physical war is between Ukraine and Russia, the real war is an economic one between the U.S./Russia/China with the EU as a supporting cast. It is an economic war that is being waged between the U.S./EU/Russia, but with China distinctly in the background. It is disrupting the global political and economic environment. It is unpredictable as to where it will go.
Ultimately, it could lead to World War III. Economic warfare has preceded every major war and economics is usually at the heart of war in the first place. It has disrupted the political environment in the West as well, particularly in the U.S. and the EU where extreme right-wing parties have been in the ascendent for years, even before the outbreak of hostilities between Ukraine and Russia. In many respects this is not a lot different than the 1930s, which brought the Nazi party to power in Germany. Once again, we are seeing in France an election run-off between the current ruling centrist party and an extreme right-wing party. We have the same going on in numerous other Western countries including the U.S. and Germany. What we are witnessing is unprecedented for most of us alive today. We have entered an era where globalization is shrinking and culture wars are breaking out as seen with the rise of populist xenophobic nationalist political parties. And we haven’t even noted the other elephant in the room—climate change.
While the military clash is currently between the U.S. and Russia, the real war as we note is an economic war between the U.S., Russia, and China. As fans and readers of George Friedman’s Geopolitical Futures (www.geopoliticalfutures.com) know, Friedman notes that Russia has been preparing for some time to challenge and confront the Western socio-economic model. In many respects Friedman predicted this years ago in his book The Next 100 Years: A Forecast for the 21st Century (2009), Chapter 8, “Russia 2020: Rematch.” Russia has had long strategic interest in Ukraine as a buffer between the West and Russia and to ensure Russia’s access to the Black Sea. Russia views the West’s eastern expansion by NATO as a stealth invasion.
Russia set out to counter it in a few ways. One was to establish links and ties with the European continent and particularly Germany to Russia. This was accomplished through energy. The EU needs Russia’s oil and gas. Second, Russia lobbied and joined the World Trade Organization (WTO), allowing it to benefit from foreign investment without giving away Russia. China, was also doing the same. The one difference was China’s growing dependence on the U.S. market. Russia built up trading blocs, not just with the EU but with Asia as well. Both Russia and China deliberately set about to build up their arsenal, not just military but financial weapons as well with their foreign reserves and their ability to withstand any economic shocks including, as it may turn out, economic sanctions.
Broad-based sanctions such as those placed on Russia, Iran, Cuba, etc. are an economic weapon akin to an embargo or trade sanction. But they are not foolproof. There are workarounds and they could result in blowback. Workarounds for Russia mean tighter ties with China and more ties with Eurasian countries not party to the U.S.’s sanctions. Russia also has influence in the Middle East and Africa. But as it is now, everyone loses as world trade contracts and prices soar. How long will the West hold out to convince their people that paying $10/gallon for gasoline is to help defeat Russia? Not long, we would bet. The alternative means World War III with potentially nuclear weapons threatening the entire world. Our generation has never known anything like this. How we solve it will resonate for decades.
The U.S. is even pushing Russia into a technical default on their debt. S&P has already downgraded Russia to default on its foreign debt. Total external debt of Russia is $478 billion. Numerous credit default swaps could blow up. Who loses? Will this cause contagion? Could this spark a debt crisis similar to the Russian ruble/LTCM crisis of 1998? We don’t know, but it is unprecedented that one country would cause another to default on their debt by blocking them from payment.
The S&P 500 and other stock indices are now into their fourth month with no new highs. If we are entering a bear market as we suspect, then we could go on for months before new highs would be seen. Since 2000 we have seen four occasions when the stock market (represented here by the S&P 500) went through a number of months before making new highs. They are as below:
- The S&P 500 topped in March 2000 and did not exceed that high until October 2007, but barely. The Dow Jones Industrials (DJI) exceeded its high by a considerable margin at the time. The TSX Composite did the same. But the NASDAQ was nowhere near its former 2000 high.
- The top for the S&P 500 in October 2007 was not exceeded until April 2013 a period of five and half years. It was the same for the DJI. The TSX Composite exceeded their 2007 high in 2014. The NASDAQ finally exceeded its 2000 high in 2015 but not fully until 2016.
- The top for the S&P 500 in May 2015 was exceeded quickly in July 2016. By that time all of the indices were making new highs. A period of just under a year.
- The top for the S&P 500 in February 2020 was quickly exceeded by August 2020, a period of only six months. All indices followed.
Stock markets this past week continued to fall with the S&P 500 losing 2.1% and the Dow Jones Industrials (DJI) down 0.8%, although the Dow Jones Transportations (DJT) did jump 2.6%. The NASDAQ lost 2.6% while the TSX Composite was off 0.1%, but the TSX Venture Exchange (CDNX) gained 0.5%. Small caps also performed well with the S&P 600 up 0.9%. TSX sectors that continue to look good from our perspective are Golds, Metals, Materials, Energy, Telecommunications, Consumer Staples, and Utilities.
The S&P 500 continues in a downtrend. The short-term trend has turned down and the intermediate trend has also turned down although it is still weak. The index is trading under its 200-day MA as are the others. Breadth indicators remain to the downside. More stocks are trading under the 200-day MA than over. The put/call ratio remains surprisingly bullish. That alone tells us that too many are still expecting the market to rise going forward, even though indicators are saying down. There are few if any divergences showing up in the indicators.
On the year the S&P 500 is down 7.8%, the DJI 5.2%, the DJT 9.9% and the NASDAQ 14.7%. Small caps as represented by the S&P 600 is down 8.4%. The TSX Composite is one of the few major stock market indices bucking the trend as it is up 3.0% but the small cap TSX Venture Exchange (CDNX) is down 5.0%. The London FTSE is one of the few international indices bucking the trend up 3.1% so far in 2022. But others are down including the Paris CAC 40 down 7.9%, the German DAX -10.8%, China’s Shanghai Index (SSEC) -11.4% and the Tokyo Nikkei Dow (TKN) -5.6%.
Gold and the gold stocks continue to look very positive as gold rose this past week 1.5% while silver was up 3.6%. Gold broke out of its recent trading pattern and is now suggesting that we should soon clear $2,000 and make new highs. The Gold Bugs Index (HUI) hit fresh 52-week highs, up 2.6% while the TSX Gold Index (TGD) fell just short of new highs but up 2.3%. All this is despite the US$ Index once again hitting new 52-week highs, up 0.6%. The euro finally hit new 52-week lows, confirming the US$ Index as it was down 0.4%. The Japanese yen continues to sink down 1.2% as Japan refuses to budge on interest rates. Oil is soaring once again as threats to sanction Russian oil by the EU grow. However, the sanctions won’t take place immediately. WTI oil gained 8.8% to $106.95. Natural gas (NG) continues to soar up 16.2% to new 52-week highs. The energy indices also hit new 52-week highs although the ARCA Oil & Gas Index (XOI) lost a small 0.1%, but the TSX Energy Index (TEN) gained 2.5%. All in all, it was a negative week unless you own golds, metals, and energy.
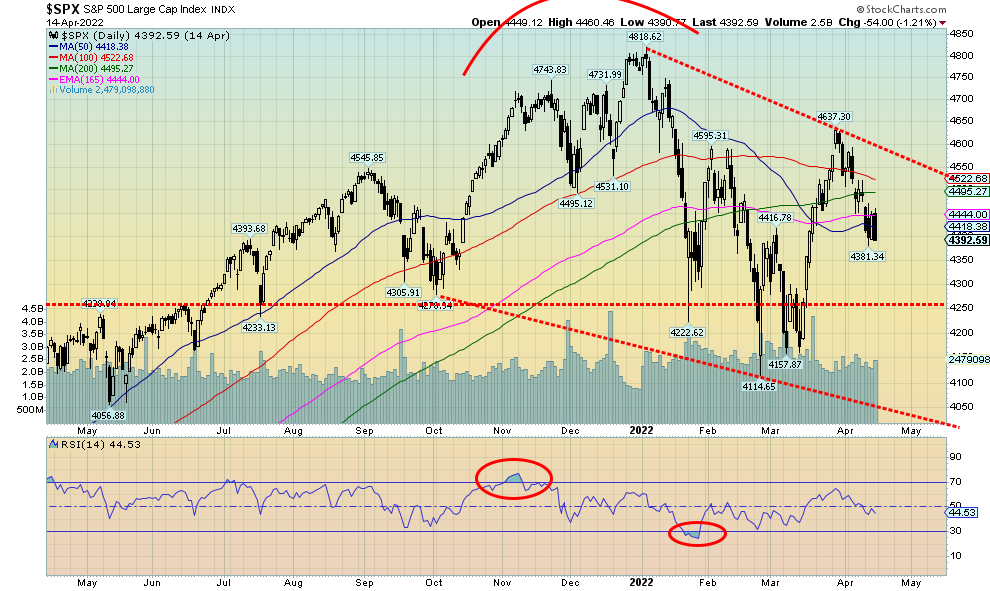
Source: www.stockcharts.com
The global situation is deteriorating. We live in unprecedented times. None of us have had much experience with what is happening today. One can only say that this is not a warm and fuzzy feeling.
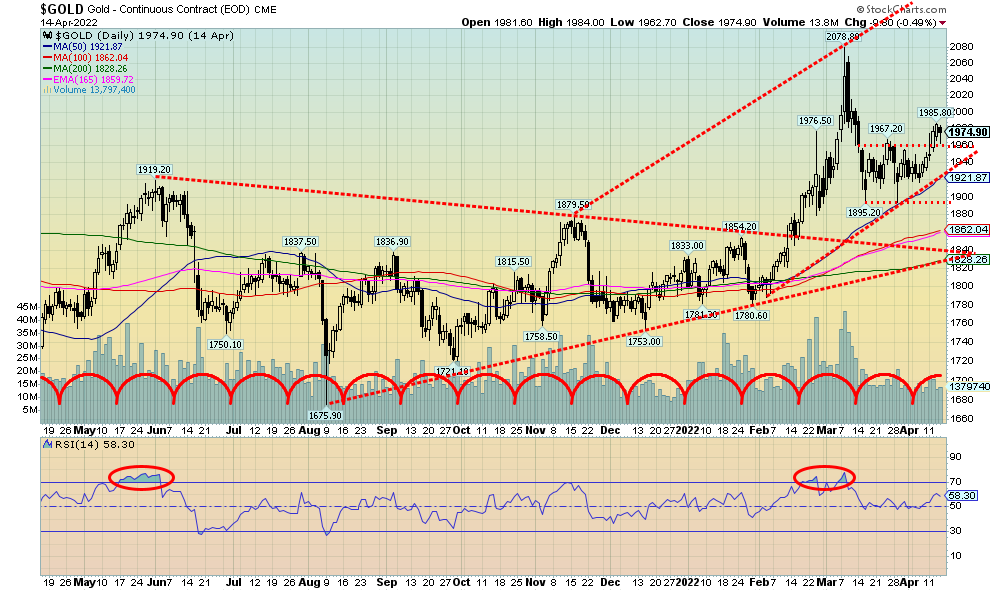
Source: www.stockcharts.com
MARKETS AND TRENDS
|
|
|
|
% Gains (Losses) Trends
|
|
||||
|
|
Close Dec 31/21 |
Close Apr 14/22 |
Week |
YTD |
Daily (Short Term) |
Weekly (Intermediate) |
Monthly (Long Term) |
|
|
Stock Market Indices |
|
|
|
|
|
|
|
|
|
S&P 500 |
4,766.18 |
4,392.59 |
(2.1)% |
(7.8)% |
neutral |
down (weak) |
up |
|
|
Dow Jones Industrials |
36,333.30 |
34,451.23 |
(0.8)% |
(5.2)% |
up |
down (weak) |
up |
|
|
Dow Jones Transports |
16,478.26 |
14,844.14 |
2.6% |
(9.9)% |
down |
down |
up |
|
|
NASDAQ |
15,644.97 |
13,351.08 |
(2.6)% |
(14.7)% |
down |
down |
up |
|
|
S&P/TSX Composite |
21,222.84 |
21,855.70 |
(0.1)% |
3.0% |
up |
up |
up |
|
|
S&P/TSX Venture (CDNX) |
939.18 |
892.50 |
0.5% |
(5.0)% |
up |
neutral |
up |
|
|
S&P 600 |
1,401.71 |
1,284.28 |
0.9% |
(8.4)% |
down (weak) |
down |
up |
|
|
MSCI World Index |
2,354.17 |
2,162.83 |
(0.6)% |
(8.1)% |
down (weak) |
down |
up (weak) |
|
|
NYSE Bitcoin Index |
47,907.71 |
40,440.29 |
(7.1)% |
(15.6)% |
down (weak) |
down |
up |
|
|
|
|
|
|
|
|
|
|
|
|
Gold Mining Stock Indices |
|
|
|
|
|
|
|
|
|
Gold Bugs Index (HUI) |
258.87 |
330.95 (new highs) |
2.6% |
27.8% |
up |
up |
up |
|
|
TSX Gold Index (TGD) |
292.16 |
371.36 |
2.3% |
27.1% |
up |
up |
up |
|
|
|
|
|
|
|
|
|
|
|
|
Fixed Income Yields/Spreads |
|
|
|
|
|
|
|
|
|
U.S. 10-Year Treasury Bond yield |
1.52% |
2.83% (new highs) |
4.4% |
86.2% |
|
|
|
|
|
Cdn. 10-Year Bond CGB yield |
1.43% |
2.78% (new highs) |
5.3% |
94.4% |
|
|
|
|
|
Recession Watch Spreads |
|
|
|
|
|
|
|
|
|
U.S. 2-year 10-year Treasury spread |
0.79% |
0.37% |
94.7% |
(53.2)% |
|
|
|
|
|
Cdn 2-year 10-year CGB spread |
0.48% |
0.36% |
71.4% |
(25.0)% |
|
|
|
|
|
|
|
|
|
|
|
|
|
|
|
Currencies |
|
|
|
|
|
|
|
|
|
US$ Index |
95.59 |
100.33 (new highs) |
0.6% |
5.0% |
up |
up |
up |
|
|
Canadian $ |
.7905 |
0.7928 |
(0.3)% |
0.3% |
up (weak) |
neutral |
up |
|
|
Euro |
113.74 |
108.29 (new lows) |
(0.4)% |
(4.8)% |
down |
down |
down |
|
|
Swiss Franc |
109.77 |
106.17 |
(0.9)% |
(3.3)% |
down |
down |
up (weak) |
|
|
British Pound |
135.45 |
130.77 |
0.3% |
(3.5)% |
down |
down |
neutral |
|
|
Japanese Yen |
86.85 |
79.44 (new lows) |
(1.2)% |
(8.5)% |
down |
down |
down |
|
|
|
|
|
|
|
|
|
|
|
|
|
|
|
|
|
|
|
|
|
|
Precious Metals |
|
|
|
|
|
|
|
|
|
Gold |
1,828.60 |
1,974.90 |
1.5% |
8.0% |
up |
up |
up |
|
|
Silver |
23.35 |
25.70 |
3.6% |
10.1% |
up |
up |
up |
|
|
Platinum |
966.20 |
994.20 |
1.9% |
2.9% |
down |
down |
neutral |
|
|
|
|
|
|
|
|
|
|
|
|
Base Metals |
|
|
|
|
|
|
|
|
|
Palladium |
1,912.10 |
2,355.40 |
(2.7)% |
23.2% |
down |
neutral |
up |
|
|
Copper |
4.46 |
4.72 |
(0.1)% |
5.7% |
up (weak) |
up |
up |
|
|
|
|
|
|
|
|
|
|
|
|
Energy |
|
|
|
|
|
|
|
|
|
WTI Oil |
75.21 |
106.95 |
8.8% |
42.2% |
neutral |
up |
up |
|
|
Natural Gas |
3.73 |
7.30 (new highs) |
16.2% |
95.7% |
up |
up |
up |
|
Source: www.stockcharts.com, David Chapman
Note: For an explanation of the trends, see the glossary at the end of this article.
New highs/lows refer to new 52-week highs/lows and, in some cases, all-time highs.
Copyright David Chapman, 2022
|
GLOSSARY Trends Daily – Short-term trend (For swing traders) Weekly – Intermediate-term trend (For long-term trend followers) Monthly – Long-term secular trend (For long-term trend followers) Up – The trend is up. Down – The trend is down Neutral – Indicators are mostly neutral. A trend change might be in the offing. Weak – The trend is still up or down but it is weakening. It is also a sign that the trend might change. Topping – Indicators are suggesting that while the trend remains up there are considerable signs that suggest that the market is topping. Bottoming – Indicators are suggesting that while the trend is down there are considerable signs that suggest that the market is bottoming. |
Disclaimer
David Chapman is not a registered advisory service and is not an exempt market dealer (EMD) nor a licensed financial advisor. He does not and cannot give individualised market advice. David Chapman has worked in the financial industry for over 40 years including large financial corporations, banks, and investment dealers. The information in this newsletter is intended only for informational and educational purposes. It should not be construed as an offer, a solicitation of an offer or sale of any security. Every effort is made to provide accurate and complete information. However, we cannot guarantee that there will be no errors. We make no claims, promises or guarantees about the accuracy, completeness, or adequacy of the contents of this commentary and expressly disclaim liability for errors and omissions in the contents of this commentary. David Chapman will always use his best efforts to ensure the accuracy and timeliness of all information. The reader assumes all risk when trading in securities and David Chapman advises consulting a licensed professional financial advisor or portfolio manager such as Enriched Investing Incorporated before proceeding with any trade or idea presented in this newsletter. David Chapman may own shares in companies mentioned in this newsletter. Before making an investment, prospective investors should review each security’s offering documents which summarize the objectives, fees, expenses and associated risks. David Chapman shares his ideas and opinions for informational and educational purposes only and expects the reader to perform due diligence before considering a position in any security. That includes consulting with your own licensed professional financial advisor such as Enriched Investing Incorporated. Performance is not guaranteed, values change frequently, and past performance may not be repeated.
About the author


Website: https://www.enrichedinvesting.com
Disclaimer: David Chapman is not a registered advisory service and is not an exempt market dealer (EMD) nor a licensed financial advisor. We do not and cannot give individualised market advice. David Chapman has worked in the financial industry for over 40 years including large financial corporations, banks, and investment dealers. The information in this newsletter is intended only for informational and educational purposes. It should not be considered a solicitation of an offer or sale of any security. The reader assumes all risk when trading in securities and David Chapman advises consulting a licensed professional financial advisor before proceeding with any trade or idea presented in this newsletter. David Chapman may own shares in companies mentioned in this newsletter. We share our ideas and opinions for informational and educational purposes only and expect the reader to perform due diligence before considering a position in any security. That includes consulting with your own licensed professional financial advisor.