
“The money power preys upon the nation in times of peace and conspires against it in times of adversity. It is more despotic than monarchy, more insolent than autocracy, more selfish than bureaucracy.”
—Abraham Lincoln, American lawyer, stateman, 16th president of the U.S. 1861–1865, leader of nation during the U.S. Civil War 1861–1865; 1809–1865
“Give me control of a nation’s money and I care not who makes the laws.”
—Amschel Rothschild, Executive Chairman of Rothschild Asset Management; 1955–1996
“In the absence of the gold standard, there is no way to protect savings from confiscation through inflation […] Deficit spending is simply a scheme for the “hidden” confiscation of wealth. Gold stands in the way of this insidious process. It stands as a protector of property rights.”
—Alan Greenspan, American economist, Chair of the Federal Reserve five terms 1987–2006, private consultant Greenspan Associates LLC.; b. 1926
On August 15, 1971, President Richard Nixon broke up the post-war Bretton Woods agreement by announcing that he had directed Treasury Secretary John Connally to suspend with exceptions, the convertibility of the U.S. dollar into gold or other reserve assets, ordering the gold window to be closed to foreign governments. The order was Executive Order 11615.
Bretton Woods came out of the dislocation of the Great Depression and World War II. The 44 nations involved had met at Bretton Woods, New Hampshire in 1944. It was hoped Bretton Woods would "ensure exchange rate stability, prevent competitive devaluations, and promote economic growth." Countries would now settle their international accounts in U.S. dollars that could be converted to gold at the price of $35/ounce. The U.S. committed to backing every dollar overseas with gold. Other currencies were pegged to the U.S. dollar.
However, things changed. From 1950 to 1969 Germany and Japan recovered. The U.S. had set up the Marshall plan to help Japan and Europe recover from the war. The U.S. manufacturing industry was a prime recipient as the money was spent on U.S. goods: cars, steel, machinery, and more. But as time wore on, the U.S.’s share of global economic output fell from 35% to 27%. In the U.S. there was a growing negative balance of payments, growing public debt primarily because of the Vietnam War, along with monetary inflation. The U.S. dollar became grossly overvalued.
By 1966 non-U.S. central banks had accumulated $14 billion of U.S. dollars. But the U.S. held only $13.2 billion in gold reserves. Only $3.2 billion was available to cover foreign reserves. Central banks began to demand that their U.S. dollars be redeemed for gold. Germany left the Bretton Woods system in May 1971. Switzerland soon followed. Britain and France were clamouring to redeem at least $3 billion of their U.S. dollars for gold. The result: the U.S. closed the gold window and broke up Bretton Woods. Effectively, the U.S. defaulted.
U.S. Money Supply M1, M2 and Federal Debt ($ Billions) 1970-2021
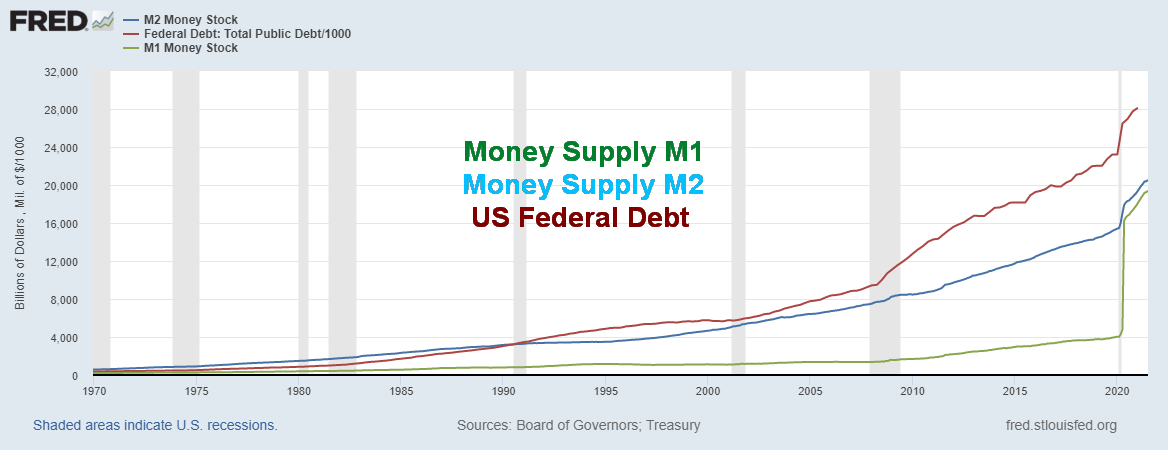
Source: www.stlouisfed.org
Officially the U.S. holds 8,133.5 metric tonnes of gold as reserves (261,498,097 troy ounces). That would have a value today at $1,800 of $470.7 billion. However, it is held on the books of the Federal Reserve (book value) at $42.22 or $11.0 billion. Given a monetary base alone of $6,130.3 billion to cover that with gold would require the price of gold to rise to at least $23,500. In August 1971 the price of gold was $42.71 but the monetary base was $84.1 billion. Based on outstanding reserves at the time (roughly the same as today), that would have required a gold price of at least $321 to cover the monetary base. Gold prices have been lagging ever since. Arguably, covering completely may not be realistic. But 40% might be and that would require gold to rise to a price of $9,400 to cover 40% of today’s monetary base.
To put this in perspective, we picked up a story from Goldcore (www.goldcore.com) about how in 1971 the price of a new Corvette was $5,496. By 2020 the price of the same Corvette was $67,000. In 1971 it would have cost 135 ounces of gold. That same Corvette today would only cost 38 ounces of gold, showing gold’s ability to hold its long-term purchasing power. To give this a different perspective, the U.S. Debt Clock (www.usdebtclock.org) shows a median new home in 2000 cost $166,227. In terms of gold, using the average for 2000 of $279 that home cost 596 ounces of gold. A median new home now is listed at $365,993 by U.S. Debt Clock. Using a price of gold at $1,793 that same house today would cost only 204 ounces of gold. Gold holds its purchasing power.
A gold standard had existed since the late 17th century/early 18th century. Before that, gold and silver along with bronze (copper) had been used as coins dating back upwards of 5,000 years. The gold standard was developed as the use of paper currencies grew. It was to give paper currencies value. Gold backed the value of money. In 1821 Great Britain officially adopted a gold standard, leading the pound sterling to become the world’s reserve currency. Trade imbalances were to be settled in gold. Given the need for new supplies of gold it was not surprising that exploration and production rose, given strong incentives to stockpile gold. By 1871 the gold standard went international and by 1900 most developed nations were linked to a gold standard. 1871–1914 was the pinnacle of the gold standard.
But two great wars and a Great Depression changed everything. The gold standard was set aside during World War I. Debt grew and being tied to a gold standard became difficult for many. The Great Depression threw things off even more as currencies became misaligned. By 1931 the gold standard was suspended and only the U.S. and France had large gold reserves. Then in 1934 came the great devaluation when the U.S. revalued gold upward from $20.67 to $35 which on the other side translated into a devaluation of the U.S. dollar. Bretton Woods followed towards the end of World War II.
The most remarkable thing that has occurred since the world came off the gold standard in August 1971 is the explosive growth in money and debt. With nothing to hold paper (fiat) currencies back, debt and money exploded. Admittedly, both the central banks and the commercial banks loved it because there was nothing constraining them. The massive devaluation of the U.S. dollar that had already been falling since the creation of the Federal Reserve in 1913 collapsed further. In 1913, US$1000 would buy you 48 ounces of gold. Today that same US$1,000 would only buy you 0.56 ounces of gold. Quite a drop.
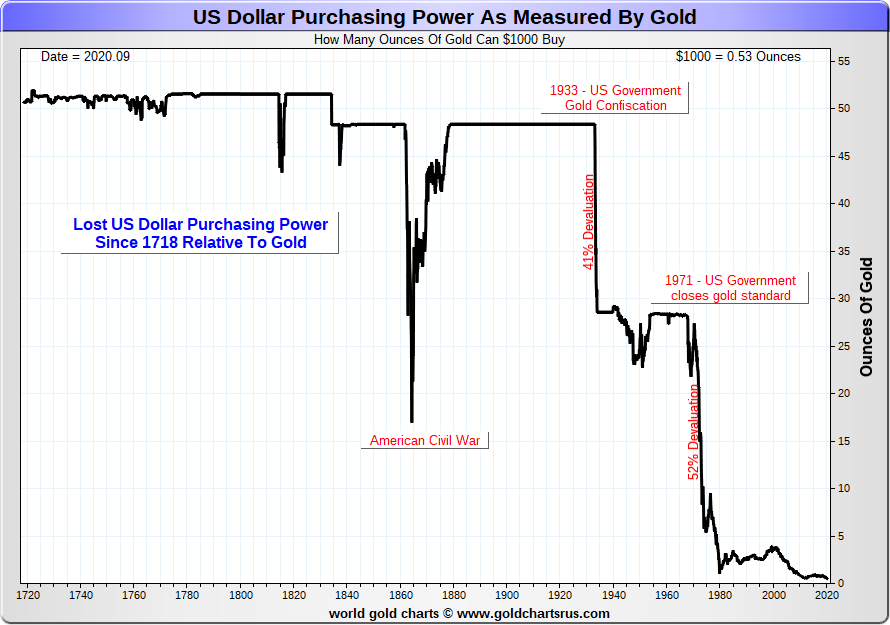
Source: www.goldchartsrus.com
Since August 1971 U.S. money supply M1 has gone up $19 trillion or over 8,400%. U.S. money supply M2 has gone up $19.7 trillion or over 2,700%. U.S. federal debt has gone up $28.3 trillion or almost 6,900%. In 1991 the amount of federal debt surpassed M2 for the first time. Today, U.S. federal debt exceeds M2 by almost $7.9 trillion. This is an unsustainable path and there are many who believe it will eventually cause the demise of the U.S. dollar as the world’s reserve currency. With economic growth in the U.S. lagging China, its main competitor, it is estimated by many that the Chinese economy will soon surpass the U.S. economy.
Many believe that the current tensions between China and the U.S. are driven by the economic competition between the two nations as China challenges the U.S. as the world’s number one economy and its status as the world’s reserve currency. The last time the world saw this was over a century ago but then the protagonists were Germany and Great Britain. The result was World War I, to be followed 21 years later by World War II.
As for gold, since August 1971 the gold price is up almost $1,765 or roughly 5,000%. For comparison purposes, the Dow Jones Industrials (DJI) is up about 3,900% before dividends and the S&P 500 is up roughly 4,300%. As to U.S. GDP, that is up about $21.5 trillion or only about 1,800%. It has taken massive monetary growth to purchase $1 of GDP or roughly $1.31 of debt. But that is just since August 1971. Since the 2008 financial crisis U.S. federal debt is up $18.0 trillion but GDP is only up $8.8 trillion, implying that it has taken over $2 of debt to purchase $1 of GDP. It has taken increasing amounts of debt to purchase that additional $1 of GDP. Is it an unsustainable pace?
Gold remains a key component of the global financial system. Central banks still hold a large amount of gold (2019 – 31,226 metric tonnes) and gold is still being purchased by central banks (particularly China and Russia) to back their currencies (the latest quarterly data Q1 2021 showed central banks purchased 228 metric tonnes of gold). Under a free-market system gold should be viewed as a currency just like the U.S. dollar, Japanese yen, pound sterling, euro, etc. Gold has a long-standing relationship with the U.S. dollar. As the U.S. dollar falls in value, gold tends to rise and vice-versa. Gold remains a safe haven in times of financial and geopolitical instability. Under Basel III rules, banks are obligated to hold physical gold as a part of their reserves as Tier 1 asset. The rules apply to banks operating in the U.S., the EU, and Switzerland. This was meant to try and prevent another financial meltdown as we saw in 2008.
If central banks and banks hold gold as a currency, investors should also maintain a gold position as a hedge and an alternative currency. Gold has an inverse relationship with both stocks and bonds. The amount held can vary, depending on the investor. A note, however, is that holding gold stocks is not the same as holding physical gold. Gold stocks are paper assets just like any other stock, whereas physical gold and silver have no liability. A fiat currency on the other is just another obligation of the government backed only by its good faith. Something to consider given the long history of gold as a currency.
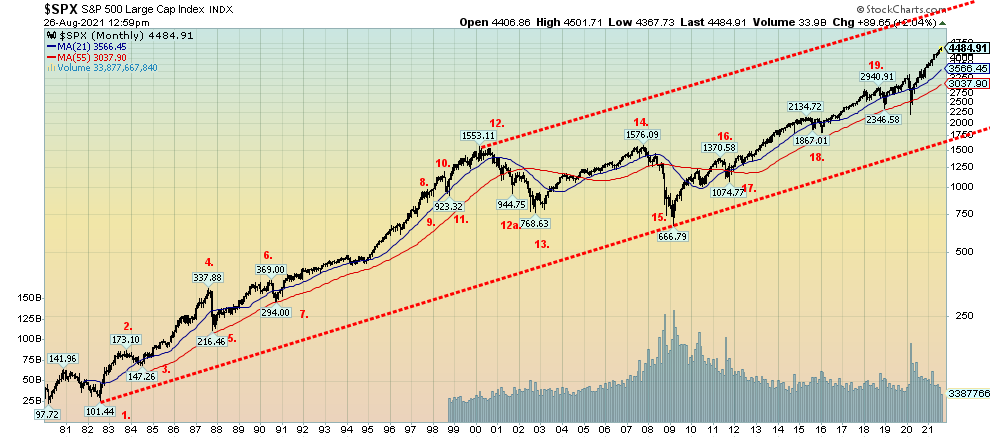
Chart of the Week
Source: www.stockcharts.com
Elliott Wave International (www.elliottwave.com) in their August 2021 issue noted the propensity for the stock market to top or bottom primarily in July, August, or October. We’ve taken this one step further and are listing these tops and bottoms with appropriate commentary as to what happened.
|
Top/Bottom |
What Happened |
|
|
1. |
Bottom–August 1982 |
Bottom of the 1980–1982 bear market and the start of the 1982–2000 great bull market |
|
2. |
Top–July-October 1983 |
First correction in the 1982–2000 bull market |
|
3. |
Bottom–July 1984 |
Bottom for #2. correction |
|
4. |
Top–August 1987 |
The major top before the 1987 stock market crash |
|
5. |
Bottom–October 1987 |
1987 stock market crash; DJI falls 36% |
|
6. |
Top – July 1990 |
Iraq invades Kuwait |
|
7. |
Bottom–October 1990 |
End of 1990 correction; DJI down 21% |
|
8. |
Top–August 1997 |
Top Asian financial crisis |
|
9. |
Bottom–October 1997 |
Short-lived Asian financial crisis |
|
10. |
Top–July 1998 |
Top before the 1998 Russian/LTCM crisis |
|
11. |
Bottom–October 1998 |
Fed to the rescue: massive liquidity injections |
|
12. |
Top – September 2000 |
Markets topped January to March 2000 but there was a secondary top in September in the middle of the Jul/Aug/Oct period |
|
12a. |
Bottom–September 2001 |
9/11 terrorist attack. Again, in the middle of the Jul/Aug/Oct period |
|
13. |
Bottom–October 2002 |
The bottom of the dot.com crash 2000–2002 |
|
14. |
Top–October 2007 |
The final top before the 2008 financial crisis |
|
15. |
Bottom–October 2008 |
No, not the bottom of the stock market crash for the 2008 financial crisis. That didn’t happen until March 2009. However, October 2008 proved to be the bottom for gold and bonds |
|
16. |
Top–July 2011 |
The top before the EU/Greek crisis |
|
17. |
Bottom–October 2011 |
Bottom of the EU/Greek crisis |
|
18. |
Bottom–August 2015 |
Start of the taper crisis. It was two-pronged with a top in May 2015 first and bottom in August 2015, then another top in December 2015 and final bottom in February 2016 |
|
19. |
Top–September/October 2018 |
Top before the trade war collapse into December 2018 |
Source: www.stockcharts.com, David Chapman
While a couple of these made their top or bottom in September, we still found them important, given the occurrence in the July/August/October period. The most notable one was September 2001. On average, an important top or bottom occurred in the July/August/October period roughly every two years. The last one was three years ago, so in theory at least one could occur this year. With July past and August almost over our focus may have to shift to October for a possible top in the stock market, assuming one doesn’t or hasn’t occurred this month. It could turn out to be an important top as both Elliott Wave International and Armstrong Economics (www.armstrongeconomics.com) have been predicting a top followed by a major financial crisis and bear market into 2022.
While we note time and again thoughts of stock market top ending with the stock market moving even higher defying the odds, we continue to believe time is running out.
MARKETS AND TRENDS
|
|
|
|
% Gains (Losses) Trends
|
|||||
|
|
Close Dec 31/20 |
Close Aug 27/21 |
Week |
YTD |
Daily (Short Term) |
Weekly (Intermediate) |
Monthly (Long Term) |
|
|
Stock Market Indices |
|
|
|
|
|
|
|
|
|
S&P 500 |
3,756.07 |
4,509.37 (new highs) |
1.5% |
20.1% |
up |
up |
up |
|
|
Dow Jones Industrials |
30,606.48 |
35,455.80 |
1.0% |
15.8% |
up |
up |
up |
|
|
Dow Jones Transports |
12,506.93 |
15,129.50 |
2.4% |
17.4% |
up |
up (weak) |
up |
|
|
NASDAQ |
12,888.28 |
15,129.50 (new highs) |
2.8% |
17.4% |
up |
up |
up |
|
|
S&P/TSX Composite |
17,433.36 |
20,644.64 (new highs) |
1.5% |
18.4% |
up |
up |
up |
|
|
S&P/TSX Venture (CDNX) |
875.36 |
891.45 |
3.1% |
1.8% |
down |
down |
up |
|
|
S&P 600 |
1,118.93 |
1,375.04 |
4.1% |
22.9% |
up |
up |
up |
|
|
MSCI World Index |
2,140.71 |
2,351.18 |
1.4% |
9.8% |
up (weak) |
up |
up |
|
|
NYSE Bitcoin Index |
28,775.36 |
48,133.61 |
(0.6)% |
67.3% |
up |
up (weak) |
up |
|
|
|
|
|
|
|
|
|
|
|
|
Gold Mining Stock Indices |
|
|
|
|
|
|
|
|
|
Gold Bugs Index (HUI) |
299.64 |
254.54 |
6.1% |
(15.1)% |
down |
down |
up (weak) |
|
|
TSX Gold Index (TGD) |
315.29 |
291.01 |
3.6% |
(7.7)% |
down |
down |
up (weak) |
|
|
|
|
|
|
|
|
|
|
|
|
Fixed Income Yields/Spreads |
|
|
|
|
|
|
|
|
|
U.S. 10-Year Treasury Bond yield |
0.91 |
1.31% |
4.0% |
44.0% |
|
|
|
|
|
Cdn. 10-Year Bond CGB yield |
0.68 |
1.20% |
4.4% |
76.5% |
|
|
|
|
|
Recession Watch Spreads |
|
|
|
|
|
|
|
|
|
U.S. 2-year 10-year Treasury spread |
0.79 |
1.09% |
5.8% |
38.0% |
|
|
|
|
|
Cdn 2-year 10-year CGB spread |
0.48 |
0.76% |
7.0% |
58.3% |
|
|
|
|
|
|
|
|
|
|
|
|
|
|
|
Currencies |
|
|
|
|
|
|
|
|
|
US$ Index |
89.89 |
92.69 |
(0.9)% |
3.1% |
up (weak) |
up |
down |
|
|
Canadian $ |
0.7830 |
0.7924 |
1.8% |
1.2% |
down |
down |
up |
|
|
Euro |
122.39 |
117.95 |
0.8% |
(3.6)% |
neutral |
down |
up |
|
|
Swiss Franc |
113.14 |
109.77 |
0.6% |
(3.0)% |
up (weak) |
down (weak) |
up |
|
|
British Pound |
136.72 |
137.62 |
1.0% |
0.7% |
down |
neutral |
up |
|
|
Japanese Yen |
96.87 |
91.05 |
flat |
(6.0)% |
neutral |
down |
down |
|
|
|
|
|
|
|
|
|
|
|
|
Precious Metals |
|
|
|
|
|
|
|
|
|
Gold |
1,895.10 |
1,819.50 |
2.0% |
(4.0)% |
up (weak) |
neutral |
up |
|
|
Silver |
26.41 |
24.06 |
4.1% |
(8.9)% |
down |
down |
up |
|
|
Platinum |
1,079.20 |
1,006.50 |
1.2% |
(6.7)% |
down |
down |
up |
|
|
|
|
|
|
|
|
|
|
|
|
Base Metals |
|
|
|
|
|
|
|
|
|
Palladium |
2,453.80 |
2,408.10 |
5.8% |
(1.9)% |
down |
down |
up |
|
|
Copper |
3.52 |
4.33 |
4.6% |
23.0% |
neutral |
up (weak) |
up |
|
|
|
|
|
|
|
|
|
|
|
|
Energy |
|
|
|
|
|
|
|
|
|
WTI Oil |
48.52 |
68.74 |
10.6% |
41.7% |
down (weak) |
up (weak) |
up |
|
|
Natural Gas |
2.54 |
4.39 (new highs) |
13.4% |
72.8% |
up |
up |
up |
|
Source: www.stockcharts.com, David Chapman
Note: For an explanation of the trends, see the glossary at the end of this article.
New highs/lows refer to new 52-week highs/lows and in some cases all-time highs.
Source: www.stockcharts.com
To taper or not to taper; that is the question. Well, Fed Chair Jerome Powell may have given a signal that paring back the monthly bond-buying program could happen before the end of the year, but the market seemed to view his remarks otherwise. The Jackson Hole symposium ended with Powell’s speech in which he also reiterated the Fed’s stance that inflation is likely temporary, but that despite the rise in the Delta variant the Fed might still start to reduce its pace of bond-buying before the end of the year. Currently the Fed is purchasing $120 billion/month of government bonds and other securities ($80 billion/month), and, primarily mortgage-backed securities (MBS) ($40 billion/month). Interest rates, however, would not be raised as Powell was quite vague about that. It is called “Fed Speak.” Former Fed Chair Alan Greenspan was the master of “Fed Speak”—making verbose, ambiguous statements about monetary policy so as to prevent markets from anticipating what might actually happen. Greenspan-speak sent everyone scrambling as they tried to figure out what he actually said and meant. It was mostly a fruitless exercise.
But market reaction is more important than what Powell said or didn’t say. The U.S. dollar fell, stocks rose, bond yields eased, and gold rose. As far as the market was concerned, Powell might as well have said it’s steady as it goes. Taper, but maybe not taper. If the Fed’s in doubt, then that’s good so buy. The reality is, is the Fed really going to take its foot off the gas, given the current debt limit situation (which we cover later)? By the way, Powell’s term will soon be up and, given support from former Fed Chair and current Treasury Minister Janet Yellen, the odds favour Powell being reappointed. Powell has further support from Biden’s people. The likelihood is Powell remains and Lael Brainard becomes Vice-Chair. Brainard is a dove himself and an alternative to become Fed Chair so that would fit with the current theme. This dovish theme runs through the rest of our commentary.
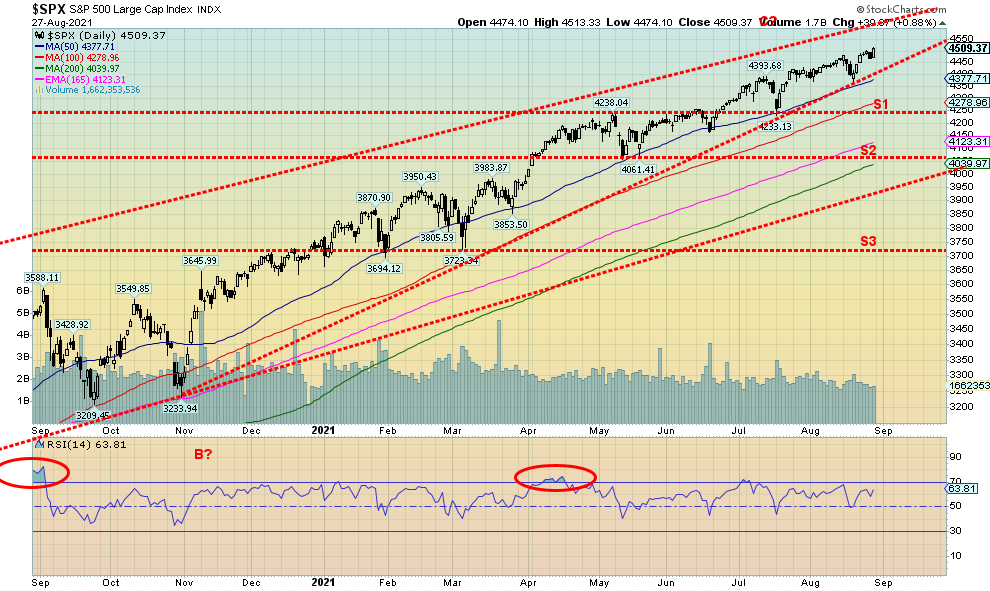
This past week saw markets continue to climb to new all-time highs. Okay, not everyone. The S&P 500 gained 1.5% to new highs. Most of the gain was seen following Powell’s speech on Friday. The NASDAQ gained as well, up 2.8%. But the Dow Jones Industrials (DJI) did not make new highs even as it gained 1.0%. The Dow Jones Transportations (DJT) gained 2.4% but is well off its all-time high, continuing to give its Dow Theory divergence with the DJI. Other all-time highs were seen from the S&P 100, the NASDAQ 100, the Wilshire 5000, and the Russell 1000 and 3000. The TSX Composite hit new all-time highs, up 1.5% on the week. The TSX Venture Exchange (CDNX) gained 3.1% and the small cap S&P 600 gained 4.1% but neither was near all-time highs.
Overseas, the MSCI World Index was up 1.4% and in the EU the London FTSE lost 0.2%, the Paris CAC 40 gained 0.8%, while the German DAX was up 0.3%. No one made all-time highs. In Asia, China’s Shanghai Index (SSEC) was up 2.8% while the Tokyo Nikkei Dow (TKN) gained 2.3% but continues to look very toppy. Bitcoin faltered a bit this past week falling 0.6%.
Powell may have hinted at tapering but there is no hard timeline for that. And no interest rate hikes on the horizon and inflation remains transitory. So, up the markets go. We have to take it a week at a time now as so many indicators are deteriorating and sentiment remains quite bullish. Problems loom in the partisan battle over the debt limit which could come to a head in October/November. The market is getting tired. Support is seen at 4,400 and a break of that level could spell trouble. Major support is seen at 4,250, 4,100, and 3,900. Below 3,900 a major bear is probably underway. One can stay long but keep raising that stop.
September marks the start of the business year, the end of vacations, and, the start of school. But September is the month that ranks the worst for stock markets, 12th during the year. Seems that portfolio managers come back and clean house. Since 1950 the DJI has experienced 29 up Septembers and 41 down Septembers. The worst month for the DJI was September 2002 when it lost 12.4%. September has seen tops – September 3, 1929 is probably the most famous. But September 1987 was the last high before the October crash. The 2008 Lehman Brothers financial crash got underway in September. September’s triple witching week is notorious for its volatility and danger. The week after is even more dangerous. The markets have been steadily climbing. Could we see a September top?
Source: www.stockcharts.com
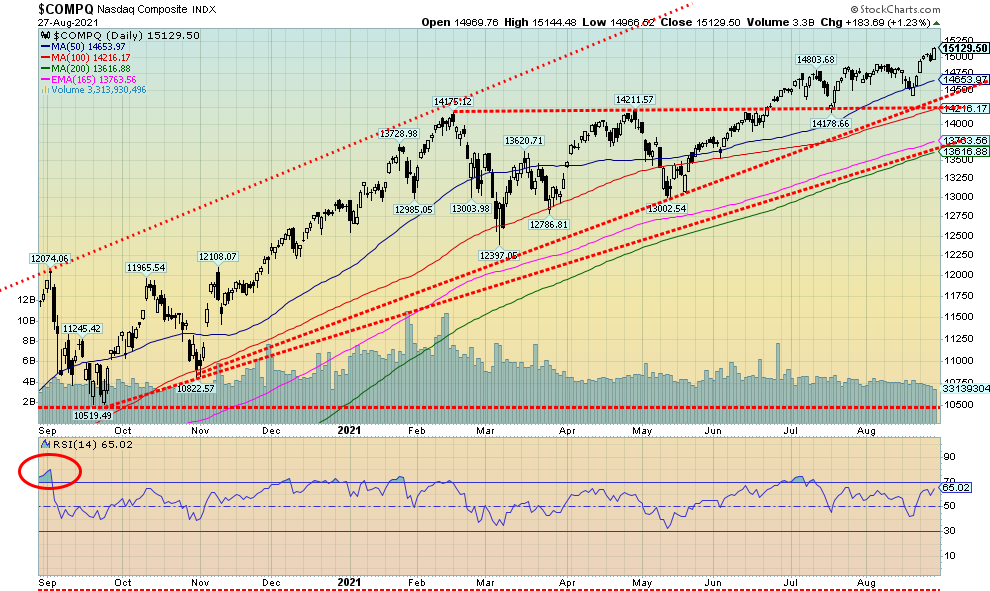
The NASDAQ went along with the S&P 500 to new all-time highs this past week. As we noted earlier, the NASDAQ was one of only eight North American Indices that made new all-time highs. Helping the NASDAQ were the FAANGs, although the FANG Index itself did not make new all-time highs. Facebook gained 3.7%, Apple +0.3%, Amazon +4.7%, Netflix +2.2%, Google +4.4% and new all-time highs, Microsoft -1.5% one of the few losers, Tesla +4.7%, Twitter +1.5%, Baidu +11.3% as the Chinese stocks recovered, Alibaba +1.0%, and Nvidia +8.9% also to new all-time highs. If markets are climbing a wall of worry, the NASDAQ is doing a great job. That pullback in March 2021 was 12.5% and things looked not great at that point. However, the NASDAQ recovered to new all-time highs, up 22% since then. There is support down to 14,650 and then again down to just below 14,500. A break of 14,500 could spell trouble and a fall to around 13,800. Under 13,600 a bear market could get underway. Trying to predict the high is nearly impossible as volume and momentum are fading and indicators are deteriorating. Investors should just keep raising their stops.
Source: www.stockcharts.com
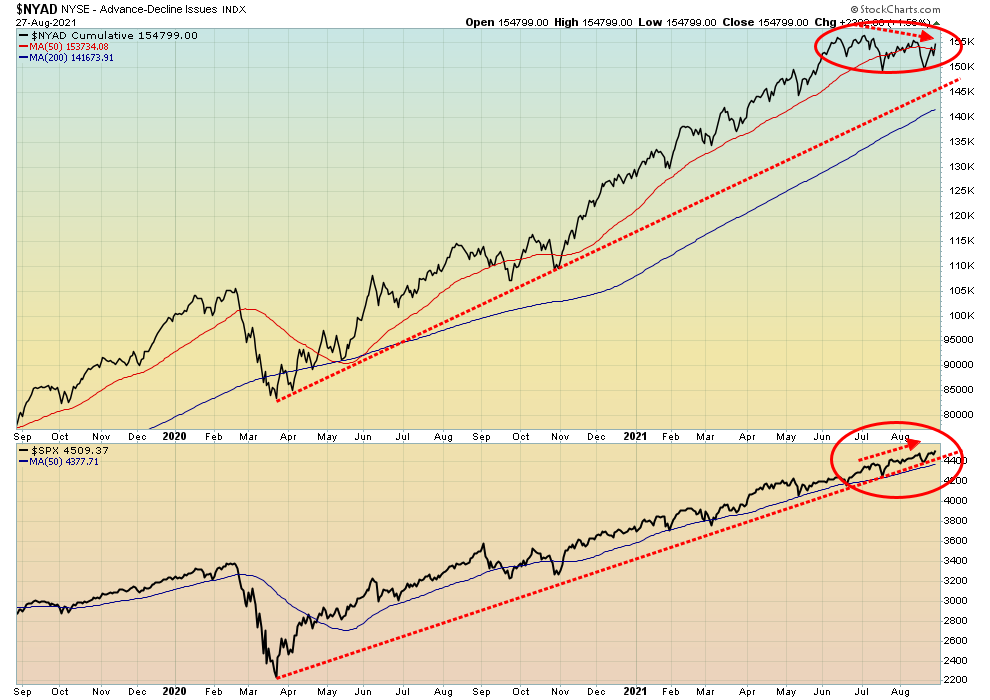
The NYSE advance-decline continues to diverge with the S&P 500. However, the AD line did rise this past week and, if the S&P 500 continues its record advance, then the AD line might make new all-time highs as well. The AD line has faded against the 50-day MA before. We’ll see if it can break through. Otherwise, these divergences are not unusual at potentially major tops.
Source: www.stockcharts.com
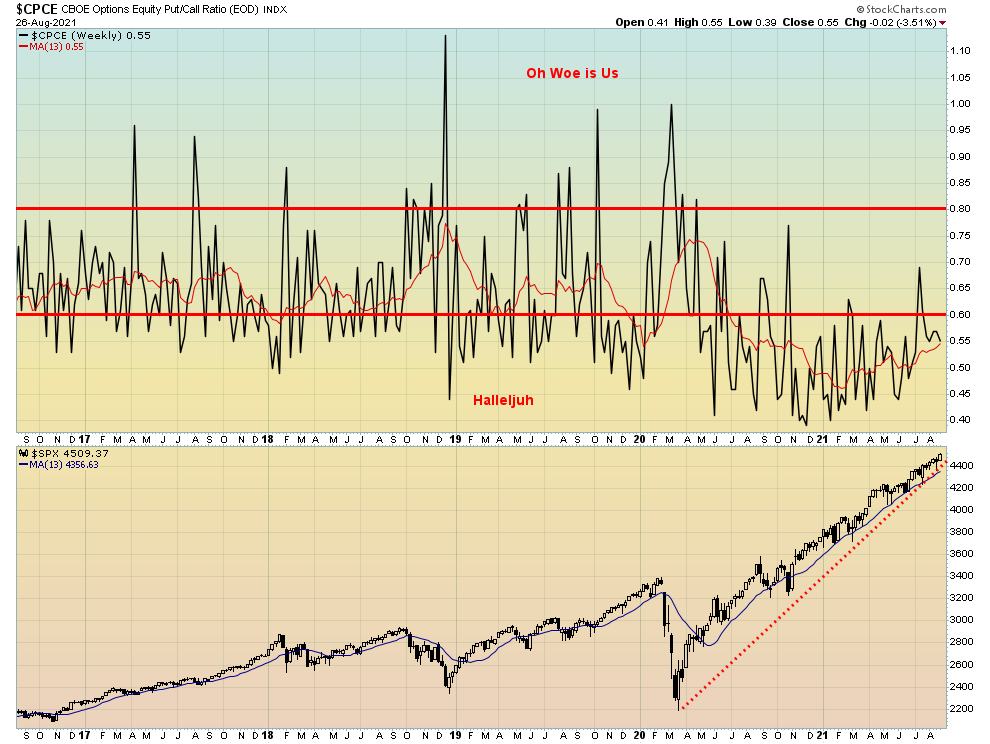
Given the move to all-time highs once again this past week, it probably is no surprise that participants leaped back into call options. That pushed the put/call ratio down to 0.55 once again, heavily favouring calls. We have never seen such a period where the put/call ratio has remained for the most part under 0.60. It is truly a “Hallelujah” period. Leonard Cohen must be rejoicing.
Source: www.stockcharts.com
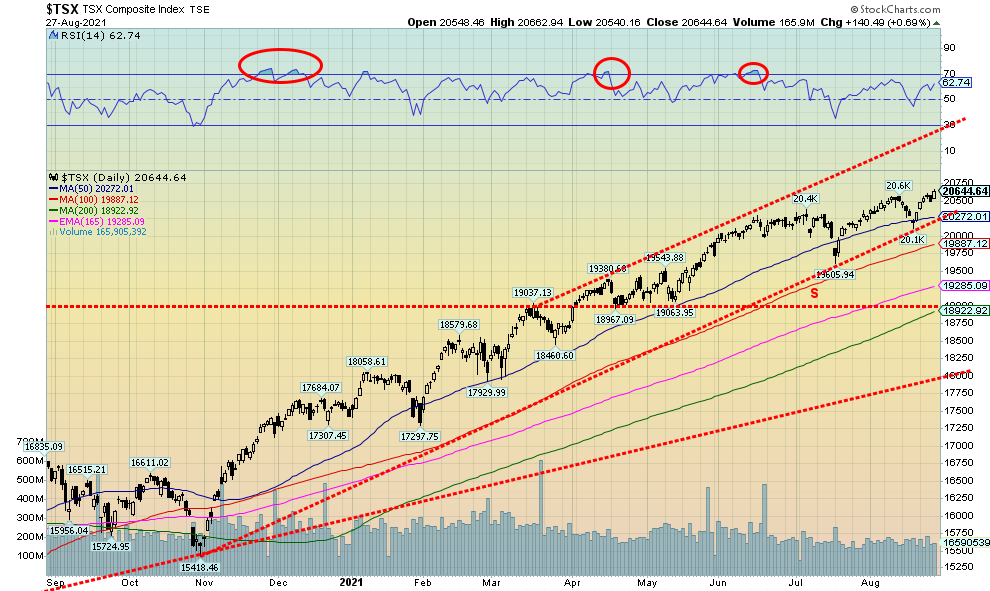
The TSX Composite joined the new all-time highs this past week, up 1.5% on the week. The junior TSX Venture Exchange (CDNX) gained 3.1%, its best showing in weeks. That flipped the CDNX positive again on the year, up 1.8%. Eleven of the 14 sub-indices enjoyed an up week with six of them hitting new all-time highs. Not hitting new all-time highs but the leader on the week was Energy (TEN), up 9.2%. Health Care (THC) also enjoyed a stellar week, up 7.0%. Third was Materials (TMT), up 5.0%. None of them were all-time highs. All-time highs were seen for Income Trusts (TCM) +1.2%, Consumer Staples (TCS) down 0.9% one of the losers, Financials (TFS) also a loser down 0.6%, Industrials (TIN) +0.9%, Information Technology (TKK) +3.0%, and Telecommunications (TTS) +0.3%. The only other loser was Utilities (TUT) off 0.4%. The TSX now has support down to around 20,250 but below that level a decline to 19,900 or lower could get underway. There is room to move higher, but we note that momentum and volume are both fading and that is usually not a good sign. Major support can be seen down to 19,000, but below that level a bear market could be underway.
U.S. 10-year Treasury Bond/Canadian 10-year Government Bond (CGB)
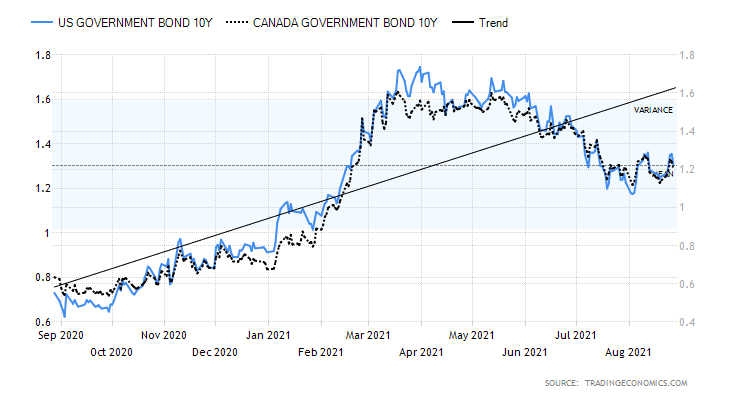
Source: www.tradingeconomics.com, www.home.treasury.gov, www.bankofcanada.ca
Thanks to the dovish statements from the FOMC at Jackson Hole, it halted the most recent rise in interest rates and they slipped from their highs on Friday. Still, the 10-year U.S. treasury note wound up rising 5 bp this past week to 1.31%. The Canadian Government 10-year bond (CGB) also rose up 5 bp to 1.20%. But for the 10-year treasury note it was down 4 bp from its high of close of 1.35%. Now we watch 1.17%–1.20% and if that breaks then the 10-year could fall further towards 1%. However, given the fight over the debt limit (see next chart) it could send rates higher instead. A break once again of 1.35% could send rates to 1.40% and higher. That’s why we’ll watch the lower end as well because both options could be in play until we reach a conclusion. This past week did not have a plethora of economic numbers as the focus was primarily on the Jackson Hole symposium at the end of the week. Q2 GDP came in at 6.2% but that’s the second estimate. The third estimate is the final. It was slightly above the forecast of 6%. However, economists have already been revising downward their forecasts for Q3 and Q4, largely because of the rise of the Delta variant. What’s key might be the job numbers that are due next Friday, September 3. Forecasts for August are a range of 650,000 to 785,000 for nonfarm payrolls vs. 943 thousand in July. The unemployment rate is expected to fall to 5.2%.
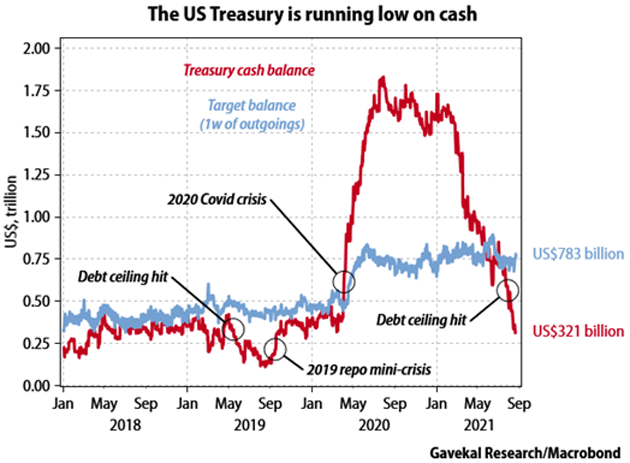
Source: www.gavekal.com, www.mauldineconomics.com, www.macrobond.com
Thanks to GaveKal (www.gavekal.com) and Mauldin Economics (www.mauldineconomics.com), we can show you a great chart on the deterioration of the U.S. Treasury’s cash balance. Why is the cash balance falling so precipitously? The debt limit. Congress last suspended the debt limit back in 2019. But the debt limit has come up once again and Congress and the Senate, thanks to the Republicans, are not allowing it to be either raised or suspended once again. The result is the U.S. Treasury cannot raise any more debt. Instead, it has to run down its cash balances. The cash balances were run up thanks to the pandemic. Note how the balances started to rise with the repo program that the Fed conducted in late 2019. Then came the pandemic and the system was flooded with cash.
But it is now coming down rapidly. The blue line that GaveKal shows is the “target balance,” meaning what the Treasury needs to cover its obligations. It is now $500 billion below target. But it is now tied up in a political fight. If the cash runs right down the U.S. government will have to suspend or stop spending, resulting potentially in mass layoffs and the shutting down of government. It could also translate into missing interest payments. That would constitute a default. While the chances of this happening still seem small, it is a real risk. The last time we witnessed this political showdown the Fed had to add billions in reserves to the financial system; otherwise, considerable financial instability could be unleashed. This game of chicken has played out before in the hyper-partisan government that is the U.S. today. But at the last minute they always came to their senses. Surely even the Republicans do not want to unleash a technical default that would cause chaos in markets. November appears to be a drop-dead deadline to resolve this impasse.
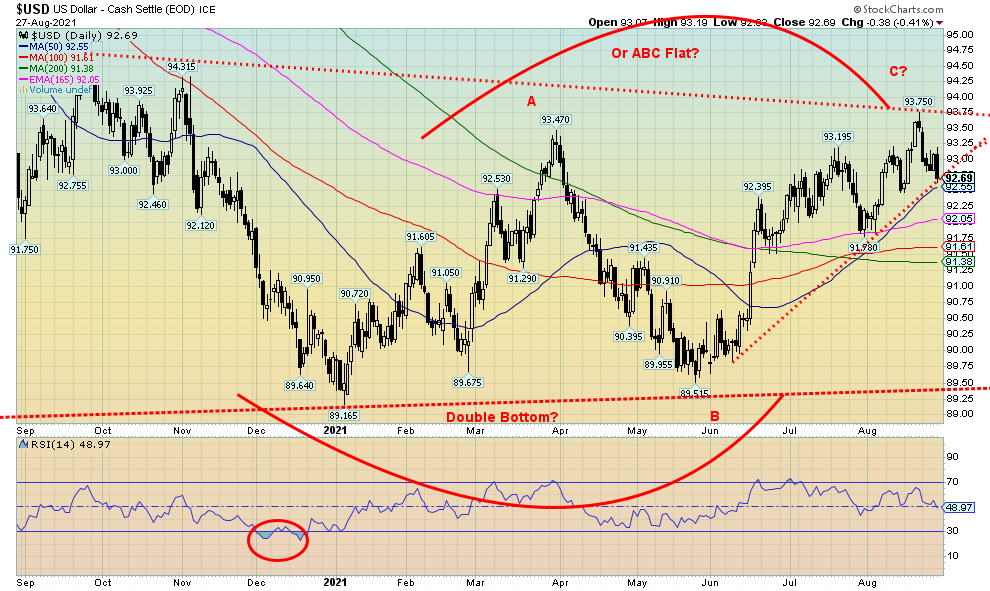
Source: www.stockcharts.com
Our debate over which way the US$ Index might go appears to be resolving itself to the downside. Last week the US$ Index spiked to 93.75 before turning down on August 23. Friday’s ambiguous statements from Fed Chair Jerome Powell gave impetus for another drop and the US$ Index closed the week down 0.9%. The US$ Index now appears to poised to break an uptrend. A break under 92.50 could quickly send the index to 92. The spike to 93.75 may have completed an ABC-type flat correction from the low seen in January 2021 at 89.17. The corrective pattern also appears as a double zig-zag abc-x-abc, abc, abc-x-abc—again, all corrective. A firm break under 92 should confirm the pattern and send the US$ Index lower. That in turn should help propel gold higher. The caveat is, if the US$ Index were to break above 94 then something else might be unfolding, but it is appearing to us that this one should be complete. As to the other currencies, the euro gained 0.8%, the Swiss franc was up 0.6%, and pound sterling jumped 1.0%; however, the Japanese yen was flat on the week. The Canadian dollar gained 1.8% as oil and gas prices rose. Support is seen down to around 92, but under 92 we could fall further towards 91.40 and 91. However, zig-zags usually mean the US$ Index will retrace the entire move from January 2021.
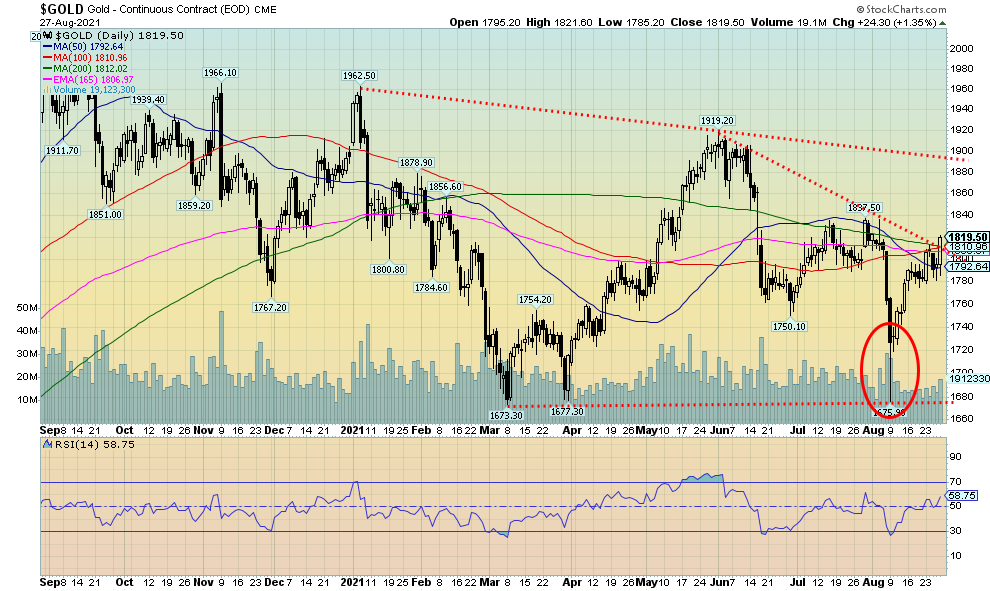
Source: www.stockcharts.com
Spurred on by Fed Chair Jerome Powell’s wishy-washy statements about tapering and raising interest rates, gold prices jumped sharply on Friday and ended the week up 2.0%. Silver did even better, rising 4.1%. Platinum also caught a bid up 1.2% while the near precious metals palladium gained 5.8% and copper was up 4.6%. A good week for the metals. The gold stocks also rose (see later). In closing above $1,800 it was the highest close in nearly four weeks. Powell’s statements on tapering may have been a bit of a negative, but holding off interest rate hikes until who knows when and calling inflation transitory helped the metals jump rather than fall. It’s that, overall, the comments were not hawkish and the vagueness on a timeline also helped. Elliott Wave International noted that gold traced out a five-wave rise from the low at $1,675 on August 9. That’s bullish. The pullback over the past week was a three-wave decline signaling a correction. So, if waves 1 and 2 are in, wave 3 could be a strong move to the upside. In theory, that could carry us once again to $2,000. But we don’t want to jump ahead of ourselves. There is considerable work to do. A breakdown under $1,775 would now be negative. Resistance remains at $1,820 and up to $1,835. Gold does appear to have broken above a downtrend line. The triangle pattern potentially points to a rise to $1,970 which is close to $2,000 as we noted previously. Resistance along the way would be at $1,900 to $1,920 once we clear above $1,835. Above that we’d see resistance at $1,950 to $1,970. Above $1,970 rising to $2,000 is possible and above that, new highs above the August 2020 high of $2,089 are probable. We have outstanding targets for gold to rise to at least $2,300. Could this wave to the upside do it? We’re cautiously optimistic. But after that the biggest decline in some time could get underway.
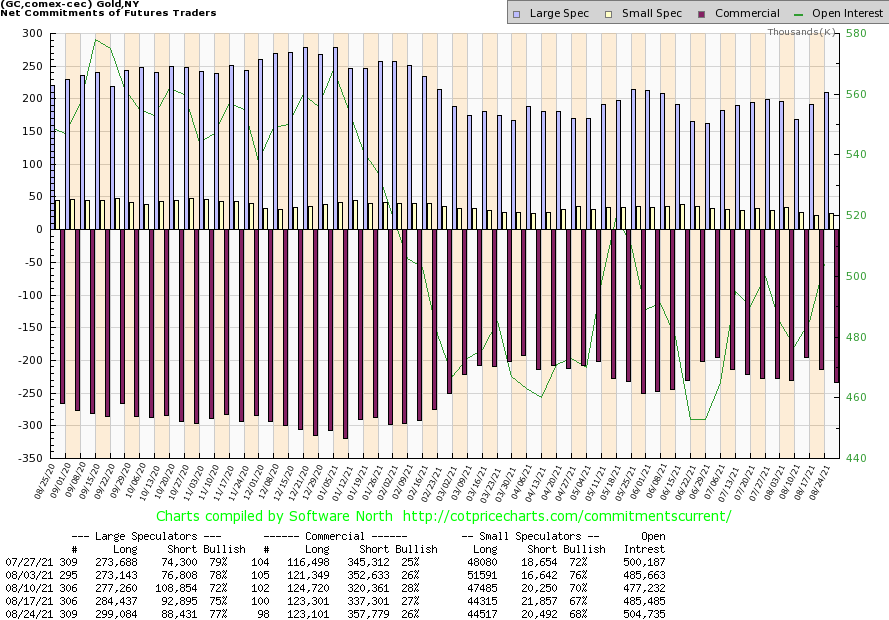
Source: www.cotpricecharts.com
The gold commercial COT (bullion companies and banks) slipped to 26% this past week from 27%, a bit of a negative development. Short open interest jumped over 20,000 contracts as gold moved higher on the week. Long open interest was generally flat. Open interest rose over 19 thousand contracts. The large speculators COT (hedge funds, managed futures, etc.) jumped to 77% from 75% as they added almost 15,000 long contracts while trimming their short position by over 4,000 contracts. We don’t like the direction, but the commercial COT has room to move lower based on recent levels so it may not be at absolute bearish levels yet.
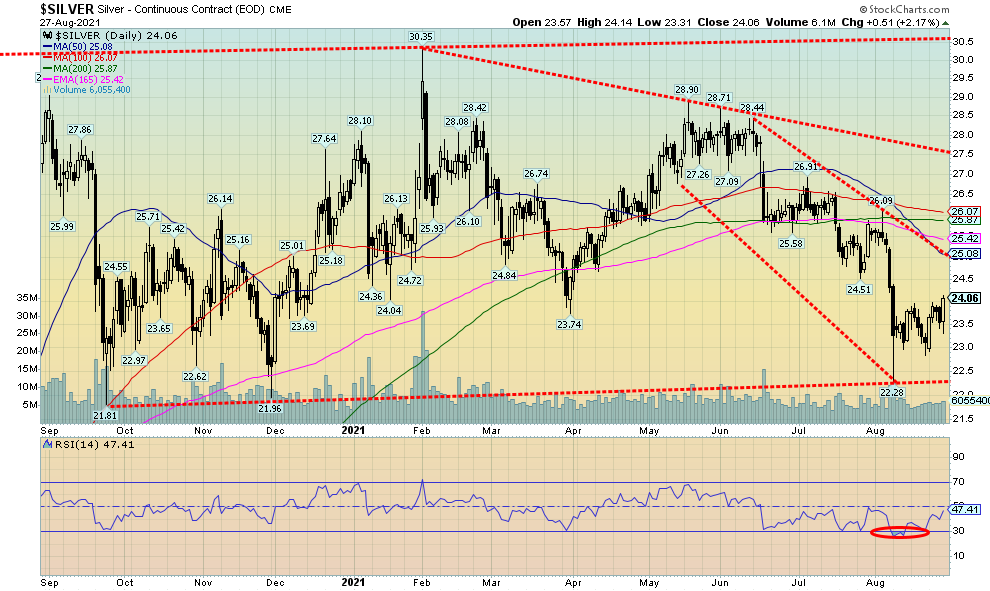
Source: www.stockcharts.com
Silver had a good week, rising 4.1% and outpacing gold. In a bull market we like to see silver leading. Of course, we can’t say we are yet in a bull market as the trend for both the short-term and intermediate remains down in contrast to gold that is turning up. But then silver took it on the chin harder than gold, falling so far in 2021 8.9% and down about 21% from its high seen in early February. The commercial COT remains somewhat friendly but not overwhelming so. Supply shortages persist, making the weak price a bit of a mystery. Still, that’s the bad news. The good news is silver is up over 100% from its March 2020 low of $11.64, a level we are not likely to see any time soon. Silver has made a series of lows near $22 (September 2020 $21.81, November 2020 $21.96, and more recently August 2021 at $22.28). That makes the $22 level quite important as we would not want to see that level broken. We could also make a bear case that highs over the past year or two have been somewhat descending (the February high of $30.35 a bit of an outlier), making us wonder whether we are seeing a large descending triangle forming. We can’t dismiss it until we firmly take out that high of $30.35. Currently, we view a breakdown under $22.85 as negative and we could be set up for a test of the recent lows, even threatening to break the key $22 level. Descending triangles are not friendly. There is considerable work to do to regain $25 and $26. Above $26 things look a bit better, but then we’d need to break out over $27.50. A move above $28.35 could set up a break over the February high of $30.35. There’s a lot of work to be done to convince us that we are going higher, as many pundits are calling for. And don’t break under $22.85.
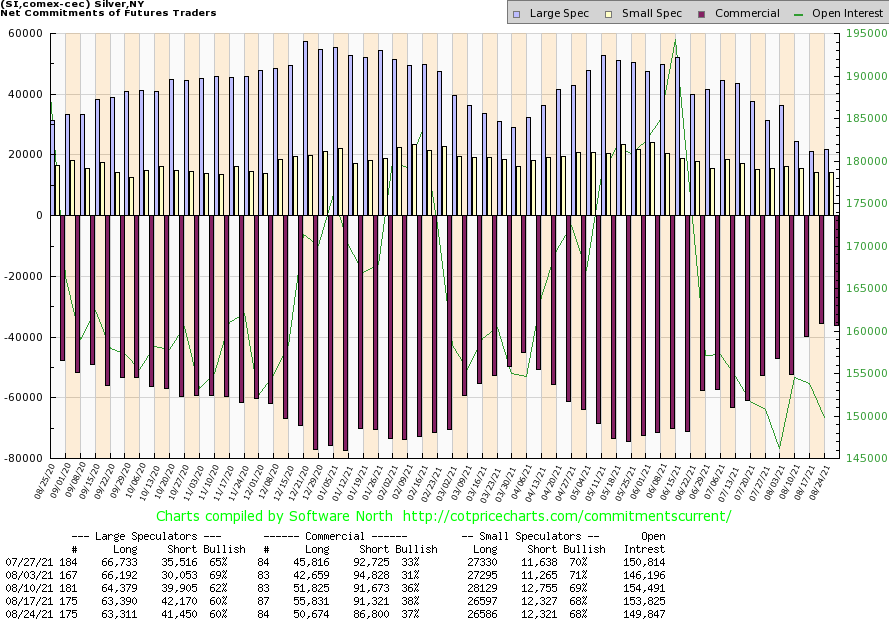
Source: www.cotpricecharts.com
The silver commercial COT slipped this past week to 37% from 38%. However, it was a mixed bag as short open interest fell over 4,000 contracts but long open interest fell over 5,000 contracts. Overall, open interest declined by around 4,000 contracts on a week when silver rose. The large speculators COT was steady at 60%. The COT remains somewhat bullish and the fact that open interest fell on an up week is not a surprise, given the early stages of what may be a rally thus far. We’ll be more interested in how the COT develops in the weeks ahead.
E 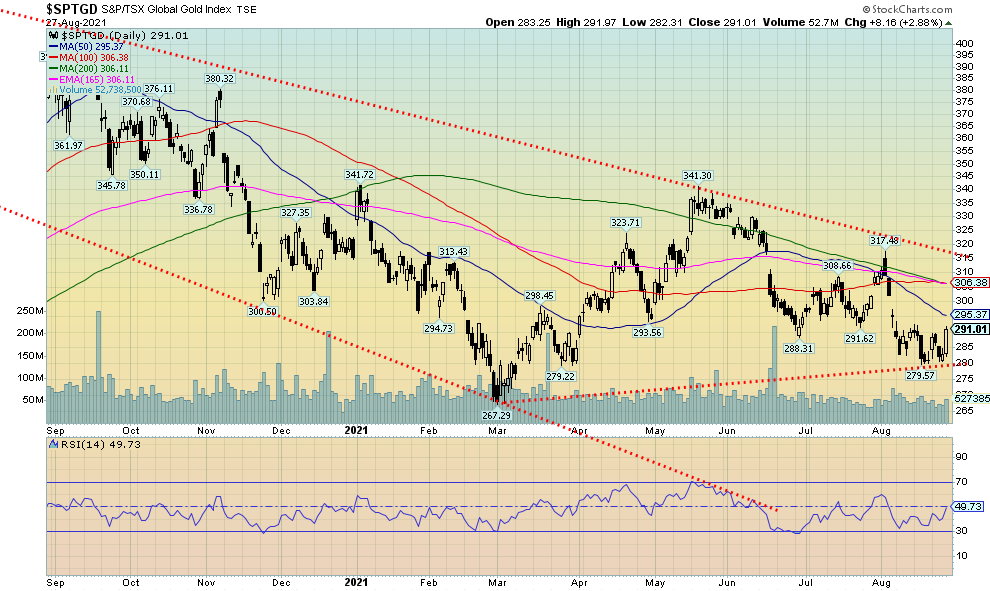
Source: www.stockcharts.com
There continues to be a question as to whether the gold stocks have bottomed. In looking at the TSX Gold Index (TGD) it appears that may be the case. The TGD made a higher low above its March 2021 low, but the Gold Bugs Index (HUI) made a lower low. A potential divergence for the indices. This past week the HUI rose 6.1% while the TGD was up less by 3.6%. Still, it was a good week for the gold stocks as many of them caught a bid, particularly on Friday following Powell’s speech. However, there is considerable work to be done. Both the TGD and the HUI had fallen under the 200-day MA and all the other MAs for that matter. All the other key MAs 50, 100 had broken under the 200-day MA as well. Both indices are down on the year—the TGD off 7.7% and the HUI down 15.1%. Both indices have been in a bear market with the TGD still down 30% from its August 2020 high and the HUI down 32%. But is the glass half-full or half-empty? If we go back to the key low in March 2020 the HUI is still up almost 79% while the TGD remains up 68%. Support for the TGD is now seen at 280 while resistance is at 295, 307, and up to 315. A breakout over 315 would be positive and could target the TGD up to 390 and even back to the August 2020 highs at 417. The major line in the sand is the March 2021 low of 267. We would not want to see the TGD fall below that level. Below that, a breakdown under 230 could suggest new lows below the March 2020 low ahead. We doubt that but it is to be noted. With the RSI now back to a neutral 50 it has considerable room to move higher. Sentiment towards the gold stocks remains low but not at absolute lows. Right now, a move back over 295/300 would be a positive development.
Source: www.stockcharts.com
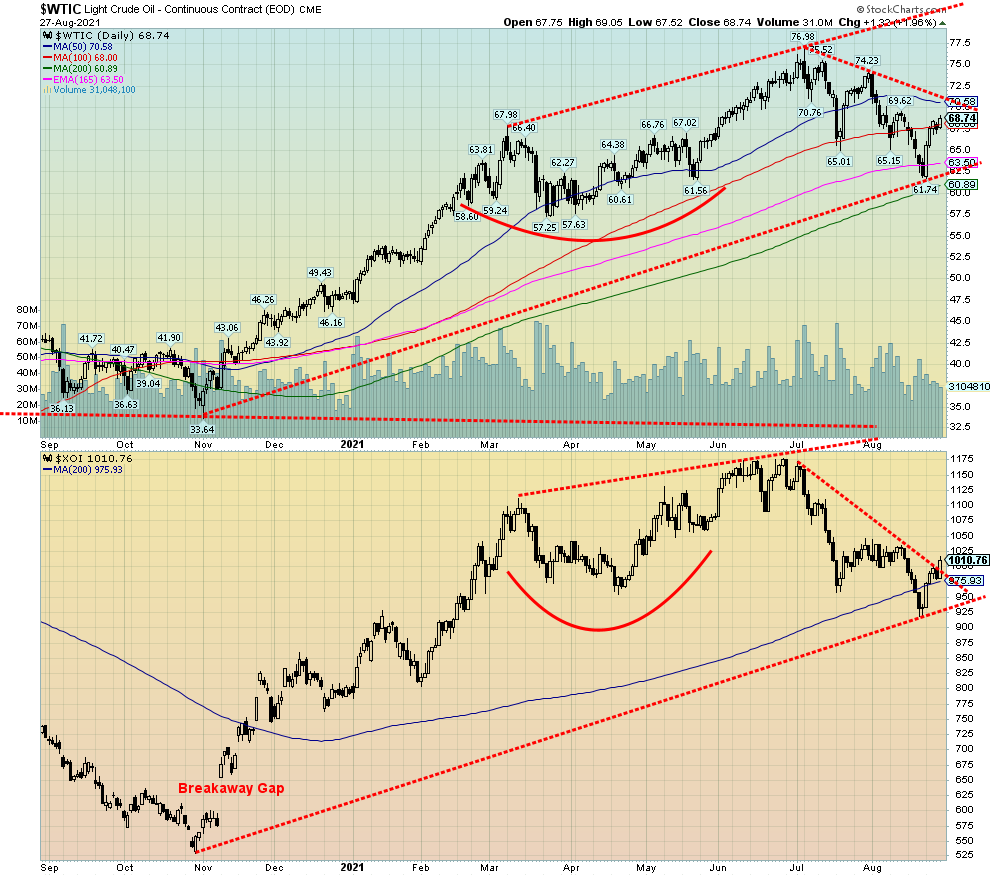
A weaker U.S. dollar, a somewhat optimistic demand outlook from China, and supply outages in the Gulf of Mexico because of Hurricane Ida along with a fire on a platform in the Gulf taking some 400,000 BPD off the market helped to push both oil and gas prices higher this past week. WTI oil rose $6.60 or 10.6% while natural gas (NG) prices jumped 52 cents or 13.4% to a 52-week high. That helped drive energy stocks higher as well as the ARCA Oil & Gas Index (XOI) jumped 8.3% while the TSX Energy Index (TEN) was up 9.2%. All energy is in the black for 2021 with WTI oil up 41.7%, NG up 72.8%, the XOI up 27.5%, and the TEN up 35.9%. In 2020 these were the worst performers.
The question now is, can they continue this rise and see fresh 52-week highs in the weeks ahead? That remains to be seen. WTI oil is short of a breakout above $71, but the XOI appears to have broken its recent downtrend line. The 200-day MA proved to be key support for both as well as for the TEN. NG bounced off its 50-day MA to fresh highs pushed by the shutdowns in the Gulf. Remember, however, that these shutdowns can prove to be temporary until the hurricane eases. However, if the hurricane season proves deadly it could impact output for weeks. Ida has turned into a category 4 hurricane and it could cause devastating damage.
WTI oil now has support down to $62.50 while NG has support down to $3.80. A breakout over $72 could help push WTI oil to new highs above $77; however, that is not a given. The top of the channel for oil is up around $80.
A wild card going forward is the push for net-zero emissions by 2050. Whether this is achievable or not is a question. And what impact it will have on oil demand is also a question. Most see a role for oil, regardless of the push for net-zero emissions and its use will not go away completely. There is also the question of whether net-zero emissions are even achievable. However, one thing for sure is that the rush to achieve net-zero emissions could spark considerable economic disruption. All the oil usage in the world is not going to disappear overnight without causing a shock to the economy and, by extension, the entire financial system.
Meanwhile, oil still dominates and given current conditions rising prices could persist here, particularly as long as the hurricane season persists. A falling U.S. dollar also helps as it prices oil higher in U.S. dollar terms to offset the devaluation of the dollar.
Copyright David Chapman, 2021
|
Charts and commentary by David Chapman Chief Strategist, Enriched Investing Inc. Phone: 416-523-5454 Email: david@davidchapman.com dchapman@enrichedinvesting.com Twitter: @Davcha12 August 30, 2021 |
Disclaimer
|
GLOSSARY Trends Daily – Short-term trend (For swing traders) Weekly – Intermediate-term trend (For long-term trend followers) Monthly – Long-term secular trend (For long-term trend followers) Up – The trend is up. Down – The trend is down Neutral – Indicators are mostly neutral. A trend change might be in the offing. Weak – The trend is still up or down but it is weakening. It is also a sign that the trend might change. Topping – Indicators are suggesting that while the trend remains up there are considerable signs that suggest that the market is topping. Bottoming – Indicators are suggesting that while the trend is down there are considerable signs that suggest that the market is bottoming.
|
David Chapman is not a registered advisory service and is not an exempt market dealer (EMD) nor a licensed financial advisor. We do not and cannot give individualised market advice. David Chapman has worked in the financial industry for over 40 years including large financial corporations, banks, and investment dealers. The information in this newsletter is intended only for informational and educational purposes. It should not be considered a solicitation of an offer or sale of any security. Every effort is made to provide accurate and complete information. However, we cannot guarantee that there will be no errors. We make no claims, promises or guarantees about the accuracy, completeness, or adequacy of the contents of this commentary and expressly disclaim liability for errors and omissions in the contents of this commentary. David Chapman will always use his best efforts to ensure the accuracy and timeliness of all information. The reader assumes all risk when trading in securities and David Chapman advises consulting a licensed professional financial advisor before proceeding with any trade or idea presented in this newsletter. David Chapman may own shares in companies mentioned in this newsletter. We share our ideas and opinions for informational and educational purposes only and expect the reader to perform due diligence before considering a position in any security. That includes consulting with your own licensed professional financial advisor.
About the author


Website: https://www.enrichedinvesting.com
Disclaimer: David Chapman is not a registered advisory service and is not an exempt market dealer (EMD) nor a licensed financial advisor. We do not and cannot give individualised market advice. David Chapman has worked in the financial industry for over 40 years including large financial corporations, banks, and investment dealers. The information in this newsletter is intended only for informational and educational purposes. It should not be considered a solicitation of an offer or sale of any security. The reader assumes all risk when trading in securities and David Chapman advises consulting a licensed professional financial advisor before proceeding with any trade or idea presented in this newsletter. David Chapman may own shares in companies mentioned in this newsletter. We share our ideas and opinions for informational and educational purposes only and expect the reader to perform due diligence before considering a position in any security. That includes consulting with your own licensed professional financial advisor.