
"America is an oil company with an army."
—George Carlin, American stand-up comedian, social critic, actor, author, known for dark comedy, tackling subjects considered taboo; 1937–2008
“The thing about the energy weapon is it is quite asymmetric. You don't need a massive military and battleships to wield it.”
—John Bordoff, American energy policy expert, researcher in economics, energy, environment, national security, co-founder and dean of Columbia Climate School; b. 1972
"They'll drop very rapidly when this is over, and if they rise, they rise, but this is far more important than having gasoline prices go up a little bit”
—Donald Trump, 45th and 47th president of the U.S., president of the Trump Organization, launched side ventures, licensing the Trump name, filed for six bankruptcies in 1990s and 2000s, hosted the reality TV show The Apprentice (2004–2015); b. 1946
The costly Iran war
From February 27, 2026 – the day before the Iran war started – until March 30, 2026, U.S. debt expanded by $233.4 billion or $7.5 billion per day (source: https://fiscaldata.treasury.gov/). Keep that up and debt is projected to expand by $2.7 trillion over the next year. The ultimate rise may be even more. This adds to the already monstrous debt of $39.1 trillion held by the U.S., the highest of any government in the world. The U.S. already runs a budget deficit to GDP of 6.5%, the highest in the G7 and the second highest amongst the 44 countries, as monitored by The Economist (www.economist.com) in its weekly publication. Only Poland’s is higher, at 6.6%.
Wars are expensive and this one is no exception. It was estimated that the first six days of fighting cost the U.S. treasury upwards of $13 billion. It was estimated to cost at least $1 billion/day. But the increase in treasury debt over the past month indicates the cost might be a lot more. However, to be fair, the increase in the debt is more than just the cost of the war. And the cost of the war may become even more expensive given President Trump’s desire to increase the Defense budget from the current roughly $1 trillion to $1.5 trillion. To pay for it, social programs may be sacrificed.
President Trump responds to markets. If the stock market is tanking, Trump becomes the TACO man (Trump always chickens out) and announces that this war will be over in two to three weeks. Then they send more troops into the war zone. Markets believe him or at least want to believe him and then they rebound – sharply. Until they don’t. Then, after his April 1, 2026 speech, the markets reverse again with oil up sharply and gold and stocks tanking. Got to love the volatility.
Nonetheless, there are those who predict that the budget deficit to GDP will rise to 8% from 6.5%. If the debt increase was unsustainable at 6.5%, it would be even more so at 8%. The victims who pay for all of this could see cuts to Medicare/Medicaid and even Social Security. Defense contractors win; everybody else loses. Rising debt could put more upward pressure on U.S. bond yields, even if they have temporarily pulled back. Interest costs will rise.
Traffic in the key areas of the Strait of Hormuz has largely ground to a halt. Our chart shows how it has fallen off sharply since the onset of the war. Reopening the strait is not a given, even if the war ended tomorrow. There could be numerous physical problems. The strait may be mined. Shipping lanes are damaged. There continue to be threats of missiles and drones. It will take weeks alone to clear mines. Could ships be sunk in the strait? Egypt did that during the 1956 Suez crisis. It took months to clear the Suez Canal. The Strait of Hormuz is only 33 kilometres wide and at its deepest 220 metres. Shipping lanes take up only about nine kilometres. The rest is too shallow.
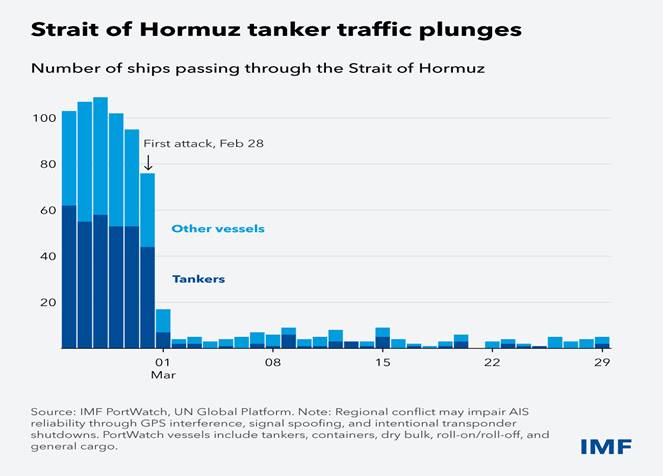
Source: www.portwatch.imf.org, www.unstats.un.org
The Strait of Hormuz has a long history, dating back to ancient times. The route linked Mesopotamia (Iraq) with Persia (Iran) and India and East Africa. Different empires controlled the strait, from the Persians to more recently the Portuguese and British. Back then it was all about trade in spices, silk, and other products. Then oil was discovered in Iran and Saudi Arabia in the 1900s. The British took over.
Oil quickly became important to the Western powers (the U.K., France, and the U.S.). Until the 1970s and the period of the Arab Oil Embargo, the Western powers controlled oil and when any nation got out of line, they overthrew the leaders and installed their own puppets. The most notable one was the overthrow of Mohammad Mosaddegh, the elected prime minister of Iran 1951-1953, who tried to nationalize the huge British oil holdings in Iran (now BP). The coup was led and financed by the U.K. and the U.S. They installed their puppet, the Shah of Iran, who in fairness led a modernization of Iran while jailing and executing thousands of opponents. It wasn’t until the Iranian crisis of 1979 that suddenly the strait rose in importance. During the Iran/Iraq war (1980–1988) both sides attacked oil tankers. Oil tankers move very slowly at roughly 20 km/hour. It takes weeks to go from the Persian Gulf to South and East Asia.
As we have noted before, the Strait of Hormuz is a global chokepoint – not just for oil but also LNG along with metals, chemicals, and fertilizers. It impacts sectors such as AI, the semiconductor industry, mining, and food production. Why would ships go through if they can’t get insurance?
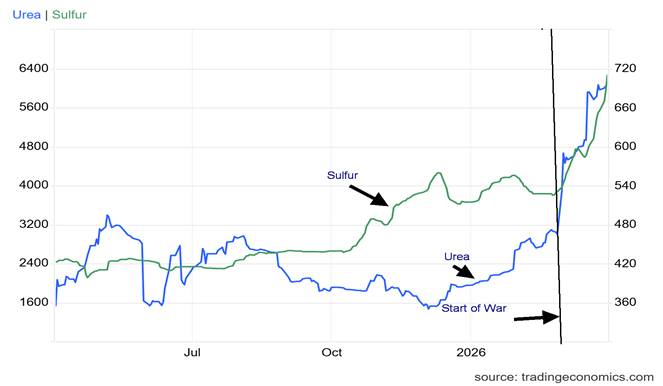
Source: www.tradingeconomics.com,
Urea and sulphur along with helium are important products used extensively by the semiconductor industry, in the cleaning of metals, and in fertilizers. Qatar accounts for at least one-third of global supplies of the gas helium, a byproduct of natural gas (NG) production. Qatar’s facilities have been badly damaged from Iranian missiles. Helium is used in the semiconductor industry, primarily Taiwan and South Korea. It’s a product not easily substituted. Helium is also used in fibre optics, defense manufacturing, and medical imaging. Sulphur disrupts semiconductor manufacturing as well. Sulphuric acid is extensively used to clean metals, particularly cobalt, nickel, and copper, all used in the production of EVs.
Sulphur is also used in the fertilizer industry, especially in phosphorous fertilizers. That’s important to the food industry. The Gulf region is also an important source of urea and ammonia for nitrogen fertilizers. It’s no surprise then that the blockage of the strait has led to price surges for urea and sulphur. As these products underpin global food production, lack of access to them should prove costly for the global economy.
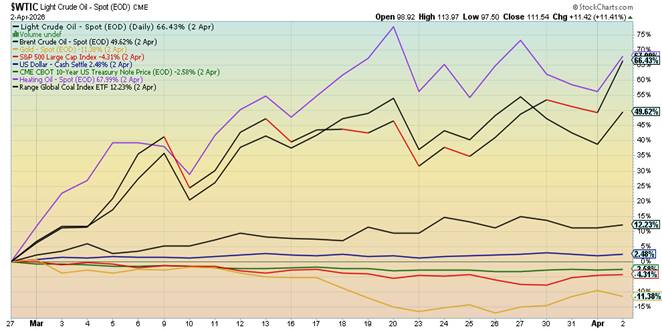
Source: www.stockcharts.com
Is it any surprise then that since the onset of the invasion of Iran by the U.S. and Israel the best performers have been WTI oil, Brent crude, and heating oil? Since February 28, WTI oil is up 66.4%, Brent up 49.6% and heating oil is up 68.0%. Lagging are gold (down 11.4%), stocks (S&P 500- off 4.3%), and bonds (10-years down 2.6%, up in yield). A prime beneficiary of sharply rising oil prices has been the oil and gas stocks that are a part of the ARCA Oil & Gas Index (XOI) and the TSX Energy Index (TEN). Both indices have made record highs.
The growth of U.S. debt has been relentless, particularly since the election of Trump in 2024. Total debt held by the public (foreign funds and central banks, pension funds, mutual funds, banks, corporations, individuals, and the Federal Reserve) is the largest component, making up roughly $31.4 trillion of the $39.1 trillion
outstanding. Holdings by foreign entities have declined as a percentage of the total, last reported at $9.3 trillion. China, which used to be the largest holder, has fallen to third place as they have dropped $66.8 billion in the past year. Japan is the largest holder at $1.2 trillion, followed by the U.K. at $0.9 trillion.
U.S. Debt 2021–2026
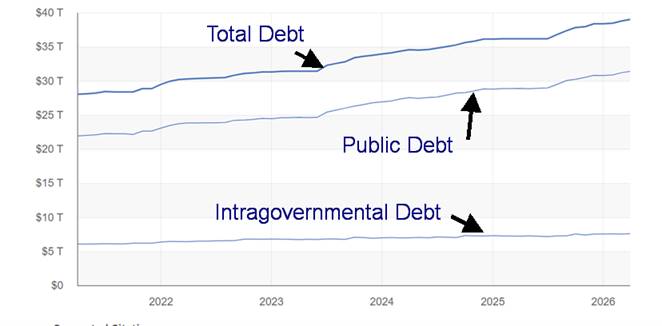
Source: www.fiscaldata.treasury.gov/datasets/debt-to-the-penny/
Wars are costly and this one is no exception. This war is also inflationary, which will continue to put the Fed in a bind as to what to do. Inflation is biting into households as gas prices and mortgage rates rise. It’s soon to be followed by more food inflation as well as higher prices on numerous other goods. Countries dependent on oil, particularly in the EU and Asia, that comes from the Gulf will soon be feeling a squeeze. Rationing along with shortages has occurred in some southeast Asian countries.
The president wants lower interest rates. The pressure might be for higher interest rates. Kevin Warsh, the nominee for Fed chair, has not yet been confirmed by the Senate. His confirmation is blocked as there is an ongoing criminal investigation into Fed Chair Jerome Powell. Powell’s term is up in June 2026. Powell has vowed to stay on until this investigation is over. The next FOMC meeting is on April 28–29. The Fed is caught between a rock and a hard place. Debt is rising and there is little sign of any real move to either rein it in or cover it by raising taxes (the odds on the latter are virtually zero). Inflation will rise. The debt keeps on rising. The war drags on…and on.
Private credit jitters
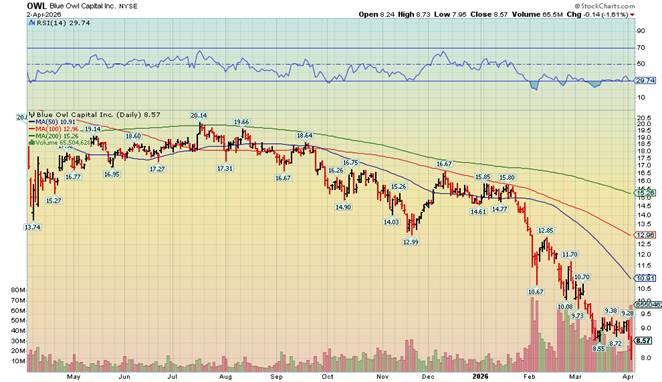
Blue Owl Capital
Source: www.stockcharts.com
Private credit jitters are heightening as Blue Owl Capital, a leading private credit firm, is facing an unprecedented request for withdrawals of $5.4 billion from two funds. That’s not happening. It all harkens back to 2007 when Bear Stearns faced massive withdrawals from two hedge funds. That preceded what became the 2008 financial crisis and the fall of Bear Stearns. Bear Stearns was rescued by JPMorgan Chase. A year later that didn’t save Lehman Brothers, nor did it save the hedge funds. The cause of it all: mortgage-backed securities (MBS) and collateralized debt obligations (CDOs). For Blue Owl? A heavily leveraged portfolio with poor liquidity and investors wanting out. Only they can’t get out.
It’s not as if Blue Owl is the only one. Also reeling are KKR (KKR), Ares Management (ARES), Apollo Global (APO), and Blackrock (BLK). There are others as well. We’ll keep an eye on this developing story. Could another 2008 financial collapse be in the cards? Blue Owl is down 57% from a high last July. It most likely is destined to fall further.
It’s not surprising that the Dodd Frank Act (2010), designed to help regulate these industries after the 2008 financial crisis, has been under constant attack and weakened under the Trump administration.
Chart of the Week
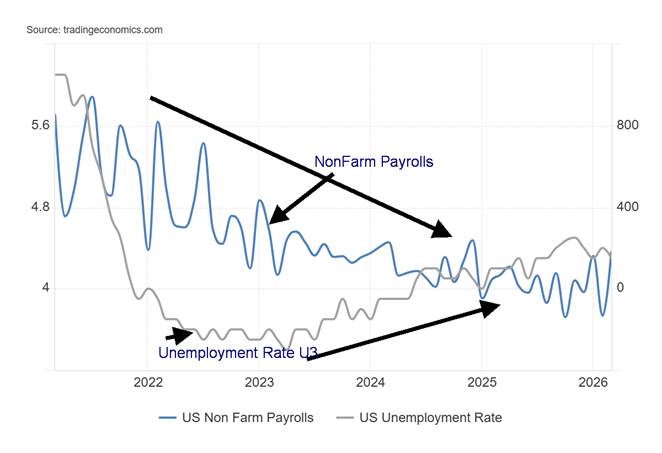
U.S. NonFarm Payrolls, Unemployment Rate U3, 2021–2026
Source: www.tradingeconomics.com, www.bea.gov
In what came as a surprise, nonfarm payrolls for March 2026 came in up 178,000. This was well above the expected 50,000. Offsetting it somewhat was February being revised down to a loss of 133,000 jobs. The average for the three months of 2026 is now at 68,000/month, above the past 12-month average of 22,000/month. Is employment picking up? Earlier weekly jobless claims surprised with only 202,000, below the expected 212,000 and the previous 211,000.
Biggest gains were in healthcare where a strike was over and everyone went back to work. Construction jobs also picked up with the nicer weather. Also seeing gains were manufacturing, transportation, and warehousing. Losers were government employees and those in finance. So is employment picking up or faltering, as many claim?
It pays to look under the hood. The labour force participation rate fell to 61.9% from 62.0%. The employment population ratio also fell, down 0.1% to 59.2%. The civilian labour force fell 396,000, even as the population level increased by 92,000. The employment level fell 64,000. But full-time employment rose 335,000 while part-time employment fell 188,000. The unemployment level fell by 332,000. Sounds good? Square a rising nonfarm payroll with a falling employment level. Which is it? Methodology is different as nonfarm payrolls are based on the establishment survey while the employment level is based on the household survey.
The unemployment rate U3 also fell to 4.3% from 4.4%, but the U6 unemployment rate (total unemployed, plus all persons marginally attached to the labour force, plus total employed part-time for economic reasons, as a percent of the civilian labour force, plus all persons marginally attached to the labour force) rose 0.1% to 8.0%. The not in labour force (NILF) category saw a rise of 196,000. While NILF is heavily retirees, the disabled, full-time students, caregivers, etc., there are still 1,809,000 in the category who are unemployed but want work now. More are in the category of those unemployed who have given up finding work.
The number of multiple job holders fell 14,000. Average weeks unemployed fell 0.4 weeks to 25.3 weeks. The number of those unemployed 27 weeks or longer fell by 50,000 while the median weeks unemployed rose 1.6 weeks to 12.8 weeks. Average hourly earnings rose 3.5% year over year, but that was below the expected 3.6% and February’s 3.8%.
So, what does this all mean? The trend for nonfarm payrolls is declining, even as it has picked up a bit so far this year. There is a lot of noise in these numbers, so it’s best not to be too swayed one way or the other. The end of a strike and the end of the bad February weather helped improve the numbers. The numbers do not as yet reflect the war in Iran. The trend for unemployment is rising. One has to look at this over time, not on a one-off basis. Nonetheless, this does continue to put the Fed into a bind as to whether to raise rates or not. All of this with inflation rising leads to at best no change and at worst a rate hike, not a rate cut, even if it is desired by the president. But the odds favour the Fed doing nothing. Bond yields rose after the release of the job numbers (a shortened session on Good Friday but stock markets were closed).
Canada reports its job numbers next Friday, April 10. Expectations are for a small gain but unemployment to rise 6.9%.
Stocks
Source: www.stockcharts.com
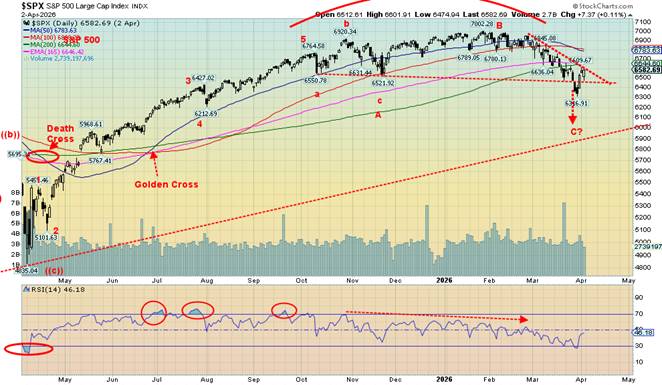
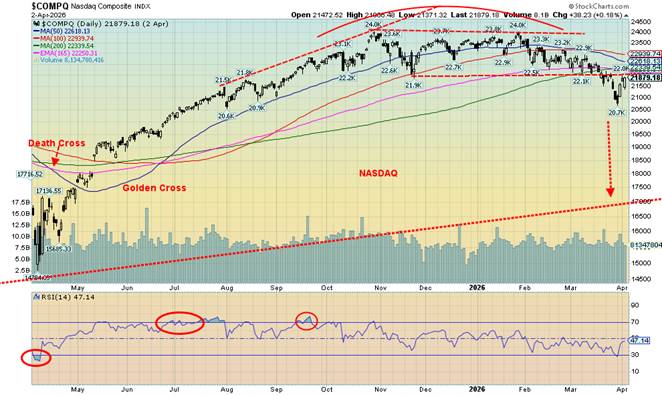
Stock markets snapped a five-week losing streak as President Trump gave them hope that this war might end soon. Don’t count on it. But the short term saw stocks leap, which helped the S&P 500 to rise 3.4% this past week. The Dow Jones Industrials (DJI) was up 3.0%, the Dow Jones Transportations (DJT) gained 5.0%, while the NASDAQ rose 4.4%. The S&P 500 Equal Weight Index rose 2.4% while the FAANGs recovered with the NY FANG Index up 5.2%. The S&P 400 (Mid) rose 2.9% and the S&P 600 (Small) was also up 2.9%. Bitcoin gained 1.5% but remains down 23.5% in 2026.
Gains were seen elsewhere as well as the TSX Composite rose 3.6% and the TSX Venture Exchange (CDNX) jumped 6.8%. In the EU, the London FTSE was up 4.7%, the EuroNext was up 3.5%, the Paris CAC 40 jumped 3.4%, and the German DAX was up 3.9%. In Asia, China’s Shanghai Index (SSEC) was up a small 0.1%, the Tokyo Nikkei Dow (TKN) fell 1.7% while Hong Kong’s Hang Seng (HSI) rose 0.7%. India’s Nifty Fifty fell 0.5%. The MSCI World Index ex U.S. was up 3.9%.
Stock markets, like everything else, are being battered by the events in the Middle East, a war with no end in sight. We’ve fallen from the highs and a rounding top, but so far it has been a slow decline. We fell under the 200-day MA and this week’s rebound still left us under it.
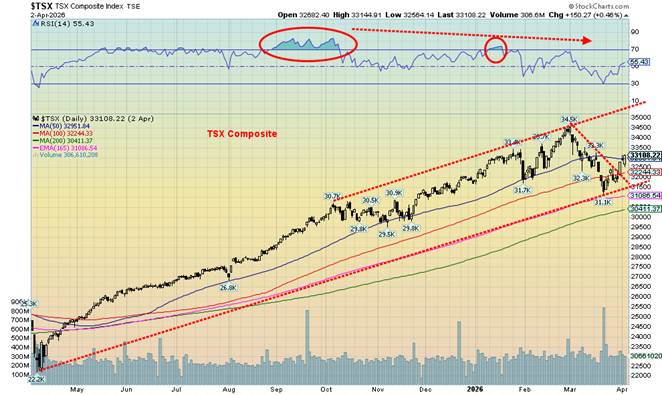
Performing better has been the TSX Composite, which is actually up on the year by 4.4%. Contrast that with the S&P 500, down 3.8%, the DJI, off 3.2%, and the NASDAQ, down 5.9%. The TSX has been buoyed once again by golds, metals, and materials, although the big winner has been energy. Energy is the second-largest component in the TSX behind financials.
Source: www.stockcharts.com
The S&P 500 needs to break out over 6,800 to suggest a low is in. The NASDAQ needs to get over 23,000. Instead, they may prove to be resistance. The TSX Composite is in better shape. Over 33,500 the index looks a lot better.
This week is a big week for numbers. Q4 GDP final is out, and the expectation is it will drop sharply from the previous 4.4% advance. Now it is expected to advance only 0.7%. Corporate profits are still expected to remain buoyant. The Fed’s favourite inflation measure, PCE prices, is expected to remain flat at 2.8%. Friday brings us the March CPI numbers, which many will be anticipating. The inflation rate is expected to rise to 3.1% and as high as 3.4% from 2.4%. It will be our first good look at the inflation rate since the war started.
Downward pressure should return to the stock market. The war, rising inflation, sinking consumer sentiment, and an edging towards a recession are some of the underlying reasons.
Source: www.stockcharts.com
Bonds
Source: www.tradingeconomics.com, www.home.treasury.gov, www.bankofcanada.ca
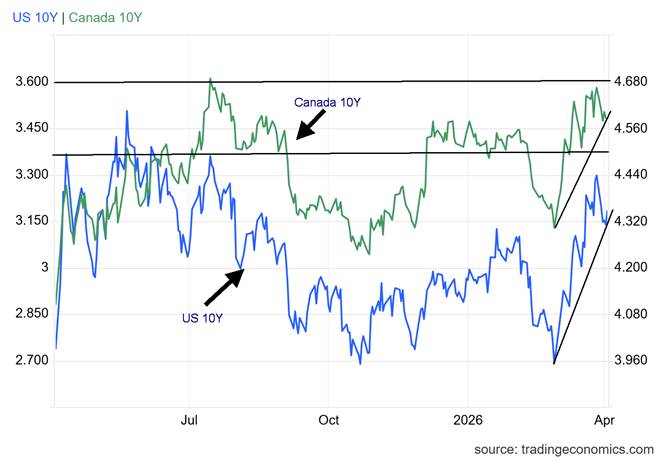
U.S. treasuries were still trading on Friday when the job numbers came out. On the week, they were somewhat volatile as events in the Middle East bounced things around. If these events intensify, bond yields will rise; if they ease, then bond yields will fall. We are off the recent high but well above the lows seen earlier. The trend is up. The 10-year U.S. Treasury note was down on the week, dropping 12 bp as supposedly tensions eased. But Friday trading after the job numbers saw the 10-year rise roughly 4 bp. It was the same in Canada as the 10-year Government of Canada bond (CGB) fell 10 bp. The 10-year–2-year spreads were up marginally, and both continue to point towards a recession that has been a long time in coming.
U.S. bond auctions have been sloppy of late. That reflects the growing concern about the massive U.S. debt and the growing deficits. No, buyers haven’t gone on strike, but they are nervous. Foreign central banks such as the BOE and the BOJ have more than helped offset China’s backing out of the purchases of U.S. treasuries. Overall, however, central bank purchases are lagging previous years as nervousness grows.
Bond yields are rising, primarily because of war costs, the massive U.S. deficit, and inflation. Offsetting that may be a weakening economy. But they could add fiscal stimuli to help prevent the U.S. from falling into a recession. Talks of a $1.5 trillion defense budget and cuts to Medicare/Medicaid, Social Security, and other areas do not bode well.
Gold and silver
Source: www.stockcharts.com
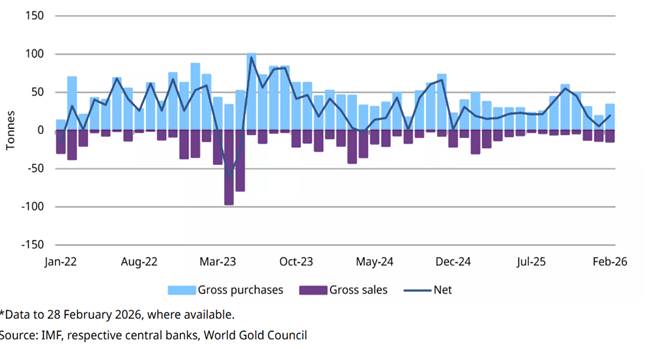
While it was widely reported that both Turkey and Russia sold gold in February, other central banks purchased gold and, on the month, gold purchases were up net 19 tonnes. Gold purchases since 2020 have been generally net positive. Overall, the largest net purchaser in 2026 has been Poland, while Russia has led the sellers. But net, purchases are up.
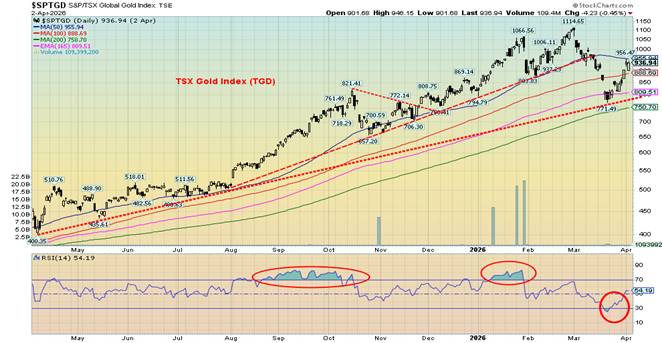
Gold, silver, and the gold stocks had a good up week. Gold rose 3.7%, silver was up 4.4%, platinum gained 7.6%, palladium 9.1%, and copper 4.0%. The gold stocks were up too with the Gold Bugs Index (HUI) gaining 10.5% and the TSX Gold Index (TGD) up 10.7%. A good rebound week as gold, like the stock market, was buoyed by thoughts the war would end soon. No such luck and on Thursday, after President Trump’s contradictory speech, gold fell.
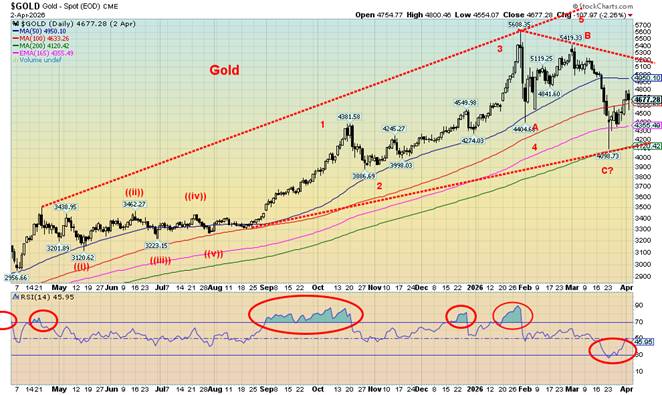
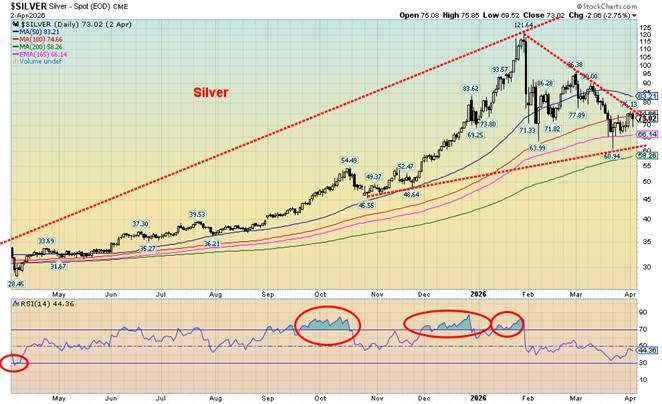
The good news is that on recent pullbacks, neither gold, silver, nor the gold stocks have made new lows. This raises the possibility that the correction from the January high of $5,608 unfolded as a big ABC. The reality is that we need to regain $5,000 and break out over $5,200 to help confirm a low and suggest new highs. It was a nasty correction that saw gold lose over $1,500 from the high or 27%. Silver fared worse, falling over $60 or roughly 50%. Silver could be on the cusp of breaking that downtrend, but we’ll need to see silver over $85 before we could suggest a low is in. Silver needs to regain above $107 to suggest new highs ahead. It’s the same for the gold stocks as the HUI fell about 32% while the TGD was off about 31%. The HUI needs to regain above 915 and the TGD above 1035 to suggest new highs ahead.
Central Bank Purchases/Sales 2022–2026
Source: www.imf.org, www.gold.org,
Gold and silver have been through a rough month. Higher oil prices did gold no favours as the US$ Index and bond yields were pushed higher, both of which were negative for gold. The question now is: does this past week’s gains set us on a course towards new highs? That remains to be seen. We ended the week at resistance levels so we need to take out the resistance.
One thing that continues to buoy the goldbugs is that the major financial news sources – CNBC, Bloomberg, and others – continue to tout the MAG7 over gold and gold stocks. That’s a mystery when the MAGS is down 11.7% in 2026 while gold is up 8.5% and the HUI up 15.3%. Even the S&P 500 remains down on the year by 3.8%, despite this past week’s gains. The precious metals sector was also the big winner of 2025. But Nvidia is more important than Barrick Gold. Will that change? Eventually it may – at least, that’s the goldbugs’ hope.
We’re encouraged by the fact that gold, silver, and gold stock indices all bounced off or near their 200-day MA. The S&P 500 fell under its 200-day MA and despite the recent rebound it is still under. The precious metals
held their recent low and have bounced back. But they are not out of the woods yet. Speculators are buying and we’re seeing some evidence of insider buying, particularly on the junior gold mining names. None of this has translated into a breakout – yet.
Source: www.stockcharts.com
Chart on next page
Source: www.stockcharts.com
Continues
Oil and gas
Source: www.stockcharts.com
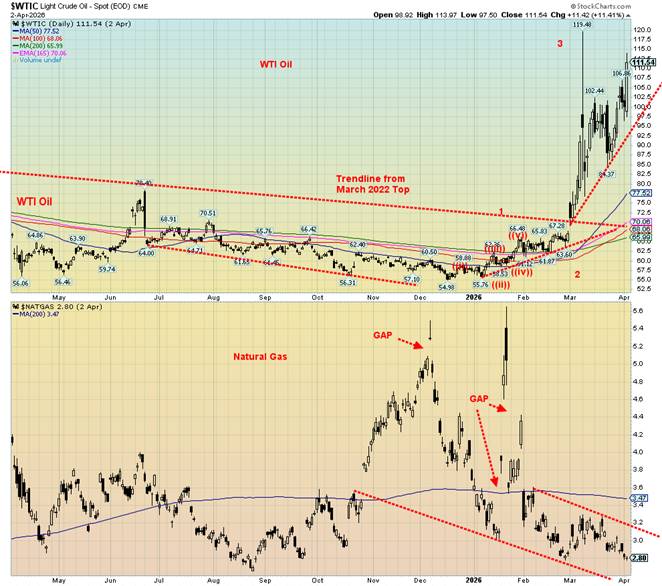
As long as this war continues, the pressure will be towards higher oil prices. We are now through $100 for both WTI and Brent oil. Based on futures, WTI oil is up 66.4% while Brent crude is up 49.6% since the start of the war. Heating oil has jumped over 67% while gas at the pump – at least here in Toronto where we live – has jumped over 35%. The March release for inflation should begin to show this for both the U.S. and Canada as well as elsewhere in the world.
For Brent crude, it is only half the story. RT News (www.rt.com) calls it the nightmare oil price that no one is talking about. They are not the only one. Front month Brent futures is what everyone reports in news stories and on TV. That closed on Friday at $109.25. Dated Brent crude represents the actual on-the-spot price that purchasers are paying for Brent cargoes in the North Sea. It reached $141.37 as reported by RT on the close of April 2. It reflects the real shortage that now exists. Weekend events such as the downing of two U.S. warplanes could spike oil prices even higher this coming week. That the actual Brent price is well above the futures price (which should start to catch up) reflects the reality on the ground. Physical supply is tight.
Source: www.spglobal.com, www.rt.com
WTI oil is now trading higher than Brent, reflecting its own immediate availability as opposed to Brent. The oil futures curve is also in backwardation, reflecting beliefs that this crisis will pass, and prices will be lower further out. Is that wishful thinking? Maybe. The U.S. has promised to bomb Iran back to the stone age.
Not even President Trump was able to quell rising prices with his speech on Wednesday, April 1. The speech was full of contradictions that mostly left everyone confused, but the conclusion was that this war is not going to end anytime soon. Oil prices surged on Thursday, April 2. Add in potential strikes on Iranian energy infrastructure and oil prices may soar further. This is the worst oil crisis since the onset of the Russia/Ukraine
war in 2022. It could be worse than the 1973 Arab Oil Embargo and the 1979 Iranian crisis.
On the week, WTI oil rose 11.1% while, surprisingly, Brent crude (futures) was down 3.6%. Don’t expect Brent to stay down for long. Natural gas (NG) continues to struggle, even as LNG is also trapped in the Persian Gulf. NG at the Henry Hub fell 7.4% while NG at the EU Dutch Hub was off 8.2%. Both reported higher than expected storage, helping to push the price off. But Europe’s supplies are running low at 28%. Europe is also in competition with Asia for NG. Prices should rise again.
Both energy stock indices faltered this past week, although most of that occurred at the beginning of the week when oil prices came off, prompting a wave of profit-taking on the stocks. The ARCA Oil & Gas Index (XOI) ended down 3.8% while the TSX Energy Index (TEN) dropped 2.9%. Both had made new all-time highs at the beginning of the week before profit-taking set in. Both rose on Thursday along with the big jump in oil prices following President Trump’s speech. Both are expected to be making fresh 52-week highs possibly this coming week.
The disruption in the Persian Gulf/Strait of Hormuz is expected to continue, even if hostilities ended tomorrow. It would take weeks alone to clean up the strait. And the threat to oil/LNG and traffic in other goods will continue. WTI oil is up 94% in 2026.
Markets and Trends
|
|
|
|
% Gains (Losses) Trends
|
|
||||
|
|
Close Dec 31/25 |
Close Apr 2/26 |
Week |
YTD |
Daily (Short Term) |
Weekly (Intermediate) |
Monthly (Long Term) |
|
|
|
|
|
|
|
|
|
||
|
S&P 500 |
6,845.50 |
6,582.69 |
3.4% |
(3.8)% |
down |
down |
up |
|
|
Dow Jones Industrials |
48,063.29 |
46,504.67 |
3.0% |
(3.2)% |
down |
down (weak) |
up |
|
|
Dow Jones Transport |
17,357.19 |
19,088.51 |
5.0% |
10.0% |
neutral |
up |
up |
|
|
NASDAQ |
23,241.99 |
21,879.18 |
4.4% |
(5.9)% |
down |
down |
up |
|
|
S&P/TSX Composite |
31,712.76 |
33,108.22 |
3.6% |
4.4% |
neutral |
up |
up |
|
|
S&P/TSX Venture (CDNX) |
987.74 |
977.43 |
6.8% |
(1.0)% |
down |
neutral |
up |
|
|
S&P 600 (small) |
1,467.76 |
1,526.76 |
2.9% |
4.0% |
down |
neutral |
up |
|
|
ACWX MSCI World x US |
67.18 |
68.93 |
3.9% |
2.6% |
down |
up |
up |
|
|
Bitcoin |
87,576.98 |
66,973.03 |
1.5% |
(23.5)% |
down |
down |
neutral |
|
|
|
|
|
|
|
|
|
|
|
|
Gold Mining Stock Indices |
|
|
|
|
|
|
|
|
|
Gold Bugs Index (HUI) |
701.49 |
808.57 |
10.5% |
15.3% |
down (weak) |
up |
up |
|
|
TSX Gold Index (TGD) |
817.76 |
936.94 |
10.7% |
14.6% |
neutral |
up |
up |
|
|
|
|
|
|
|
|
|
|
|
|
% |
|
|
|
|
|
|
|
|
|
U.S. 10-Year Treasury Bond yield |
4.17% |
4.31% |
(2.7)% |
3.4% |
|
|
|
|
|
3.3Cdn. 10-Year Bond CGB yield |
3.44% |
3.48% |
(2.8)% |
1.2% |
|
|
|
|
|
Recession Watch Spreads |
|
|
|
|
|
|
|
|
|
U.S. 2-year 10-year Treasury spread |
0.69% |
0.50% |
(3.9)% |
(27.5)% |
|
|
|
|
|
Cdn 2-year 10-year CGB spread |
0.85% |
0.67% |
6.4% |
(21.2)% |
|
|
|
|
|
|
|
|
|
|
|
|
|
|
|
Currencies |
|
|
|
|
|
|
|
|
|
US$ Index |
98.26 |
100.02 |
(0.1)% |
1.8% |
up |
up |
down |
|
|
Canadian $ |
72.87 |
71.84 |
(0.2)% |
(1.4)% |
down |
down |
neutral |
|
|
Euro |
117.48 |
115.39 |
0.2% |
(1.8)% |
down |
down |
up |
|
|
Swiss Franc |
126.21 |
125.18 |
flat |
(0.8)% |
down |
neutral |
up |
|
|
British Pound |
134.78 |
132.26 |
(0.4)% |
(1.9)% |
down |
down |
up |
|
|
Japanese Yen |
63.83 |
62.66 (new lows) |
0.4% |
(1.8)% |
down |
down |
down |
|
|
|
|
|
|
|
|
|
|
|
|
|
|
|
|
|
|
|
|
|
|
Precious Metals |
|
|
|
|
|
|
|
|
|
Gold |
4,311.97 |
4,677.28 |
3.7% |
8.5% |
down |
up |
up |
|
|
Silver |
71.16 |
72.97 |
4.4% |
2.5% |
down |
up |
up |
|
|
Platinum |
124.81 |
1,999.90 |
7.6% |
(2.3)% |
down |
neutral |
up |
|
|
|
|
|
|
|
|
|
|
|
|
Base Metals |
|
|
|
|
|
|
|
|
|
Palladium |
1,619.50 |
1,515.00 |
9.1% |
(6.5)% |
down |
neutral |
up |
|
|
Copper |
5.64 |
5.66 |
4.0% |
0.4% |
down (weak) |
up |
up |
|
|
|
|
|
|
|
|
|
|
|
|
Energy |
|
|
|
|
|
|
|
|
|
WTI Oil |
57.44 |
111.54 |
11.1% |
94.2% |
up |
up |
up |
|
|
Nat Gas |
3.71 |
2.81 |
(7.4)% |
(24.4)% |
down |
down |
neutral |
|
Source: www.stockcharts.com
* New All-Time Highs
Note: For an explanation of the trends, see the glossary at the end of this article.
New highs/lows refer to new 52-week highs/lows and, in some cases, all-time highs.
Copyright David Chapman 2026
|
GLOSSARY Trends Daily – Short-term trend (For swing traders) Weekly – Intermediate-term trend (For long-term trend followers) Monthly – Long-term secular trend (For long-term trend followers) Up – The trend is up. Down – The trend is down Neutral – Indicators are mostly neutral. A trend change might be in the offing. Weak – The trend is still up or down but it is weakening. It is also a sign that the trend might change. Topping – Indicators are suggesting that while the trend remains up there are considerable signs that suggest that the market is topping. Bottoming – Indicators are suggesting that while the trend is down there are considerable signs that suggest that the market is bottoming.
|
Disclaimer
David Chapman is not a registered advisory service and is not an exempt market dealer (EMD) nor a licensed financial advisor. He does not and cannot give individualised market advice. David Chapman has worked in the financial industry for over 40 years including large financial corporations, banks, and investment dealers. The information in this newsletter is intended only for informational and educational purposes. It should not be construed as an offer, a solicitation of an offer or sale of any security. Every effort is made to provide accurate and complete information. However, we cannot guarantee that there will be no errors. We make no claims, promises or guarantees about the accuracy, completeness, or adequacy of the contents of this commentary and expressly disclaim liability for errors and omissions in the contents of this commentary. David Chapman will always use his best efforts to ensure the accuracy and timeliness of all information. The reader assumes all risk when trading in securities and David Chapman advises consulting a licensed professional financial advisor or portfolio manager such as Enriched Investing Incorporated before proceeding with any trade or idea presented in this newsletter. David Chapman may own shares in companies mentioned in this newsletter. Before making an investment, prospective investors should review each security’s offering documents which summarize the objectives, fees, expenses and associated risks. Although Artificial Intelligence (AI) may be deployed from time to time, AI output is monitored and adjusted, if necessary, for accuracy. David Chapman shares his ideas and opinions for informational and educational purposes only and expects the reader to perform due diligence before considering a position in any security. That includes consulting with your own licensed professional financial advisor such as Enriched Investing Incorporated. Performance is not guaranteed, values change frequently, and past performance may not be repeated.
About the author


Website: https://www.enrichedinvesting.com
Disclaimer: David Chapman is not a registered advisory service and is not an exempt market dealer (EMD) nor a licensed financial advisor. We do not and cannot give individualised market advice. David Chapman has worked in the financial industry for over 40 years including large financial corporations, banks, and investment dealers. The information in this newsletter is intended only for informational and educational purposes. It should not be considered a solicitation of an offer or sale of any security. The reader assumes all risk when trading in securities and David Chapman advises consulting a licensed professional financial advisor before proceeding with any trade or idea presented in this newsletter. David Chapman may own shares in companies mentioned in this newsletter. We share our ideas and opinions for informational and educational purposes only and expect the reader to perform due diligence before considering a position in any security. That includes consulting with your own licensed professional financial advisor.