
This past weekend, we received two pieces of news. Good news. The Artemis II crew landed safely. Bad news. The peace talks ended without an agreement. That shouldn't have been a surprise as a ceasefire never really took hold. But earlier on, the news that a ceasefire was on, markets roared back while oil prices dropped sharply. That there was no follow-through is not a surprise, as the entire rebound was merely a relief rally. Step back and look at the big picture, and nothing has changed.
We review the weekly charts of the US$ Index, bonds, oil, gold, and the stock market to see if anything has changed. That the peace talks ended with no agreement suggests that the U.S./Iran/Israel will be right back at it. The U.S. has suggested blockading the Strait of Hormuz, which seems odd given that Iran has already blocked the Strait. Meanwhile, more countries are being drawn into this war. That's how a regional war could turn into a world war.
The March inflation numbers came out, and no surprise, they jumped sharply. Inflation is our chart of the week. We added two bonus charts: the sinking consumer sentiment and Canada's job numbers. The latter weren't that bad, but like the U.S., Canada's unemployment is creeping higher, and job creation is slowing.
The stock market had a good week thanks to ceasefire prospects. So did gold, while oil prices sank, which was no surprise. Back in 1973/1974, during the Arab Oil Embargo and a period of sharply rising oil prices the end of the embargo five months later did not translate into a return of the bull market. The worst was yet to come.
The current damage from this war is still being assessed, which could translate into further economic pain and a falling stock market. Not surprisingly, some countries are already rationing gas. And not surprisingly, the Strait of Hormuz is neither fully closed nor fully open. All this translates into a continuation of the growing economic and political mess.
Going forward, we expect oil prices to resume their rise while the still overvalued stock market resumes its fall. Gold is rising but remains well short of its previous high. Despite some central banks and others selling gold to gain liquidity, the gold market is not done yet, even as we might have to wait patiently for the rise to fully get underway. This will likely benefit OceanaGold Corporation, for example, which reported increased earnings, higher profit, and expanded free cash flow, raised its dividend, and is held in the Enriched Capital Conservative Growth Strategy.*
The weather is improving. It helps take our minds off world affairs. Have a great week!
DC
* Reference to the Enriched Capital Conservative Growth Strategy and its investments, celebrating an
8.17 - year history of 175% growth (annual 13%), is added by Margaret Samuel, President, CEO and Portfolio Manager of Enriched Investing Incorporated, who can be reached at 416-203-3028 or msamuel@enrichedinvesting.com This information should not be construed as an offer, or a solicitation of an offer or sale of any security. Past performance does not guarantee future returns.
“There are no military options for Iran. Attack them, and they will destroy the Gulf States oil industries, rain hundreds of missiles onto Israel, close the Arabian Gulf, and shoot oil prices to $300 per barrel, which could cause our own economic downfall.”
—Malcolm Nance, American author, media pundit, former U.S. Navy senior petty officer, intelligence and foreign policy analyst, author of Defeating ISIS: Who They Are, How They Fight, What They Believe (2016); b. 1961
“Let me tell you something that we Israelis have against Moses. He took us 40 years through the desert in order to bring us to the one spot in the Middle East that has no oil!”
—Golda Meir, prime minister of Israel (1969–1974), foreign minister under David Ben Gurion; 1898–1978
“The use of solar energy has not been opened up because the oil industry does not own the sun.”
—Ralph Nader, American lawyer, political activist, former presidential candidate, author of Unsafe at Any Speed (1965), plus other books; b. 1934
Return of the TACO man
“A whole civilization will die tonight, never to be brought back again”
—Donald Trump on Truth Social, April 7, 2026, 8:06 am
"We are very far along with a definitive Agreement concerning Longterm PEACE with Iran, and PEACE in the Middle East.”
—Donald Trump on Truth Social April 7, 2026, 6:32 pm
Markets loved it. Stocks soared, gold rebounded, bonds rallied, the US$ Index fell, and oil and energy stocks were taken to the cleaners. The TACO man is alive and well. Love the volatility.
So, is this it? The end of the downtrend? The so-called ceasefire looked like it was in jeopardy five minutes after it was announced. Upside follow-through the next day was non-existent. So, what was April 8, 2026?
The rebound is what we call a relief rally. What is a relief rally?
A relief rally is a short-term rise in stock prices after a period of decline, giving investors a temporary break from falling markets. These rallies occur when financial markets react to economic news that is better or less severe than expected. Prices may move higher for a short period, but the broader market trend may still be negative. Because of this, a relief rally is often considered a type of movement that can occur within a longer bear market, rather than a full market recovery. (Source: Investopedia www.investopedia.com.)
The news, of course, was that there was to be a two-week ceasefire in the U.S./Israel/Iran war. The alternative that was announced earlier was the obliteration of Iran. That we failed to follow through is a sign that all this was, was a relief rally. The big picture remains bearish or bullish, depending on what you are looking at.
It may not have helped that the release of the Q4 final GDP was weaker than even what was expected. The consensus was a big drop back to only 0.7% growth. What they got was 0.5% growth. That puts GDP growth for 2025 at 2%. The previous estimate was 2.3%. Compared to others in the G7 it was the highest. Next best was Canada at 1.7% while Germany brought up the rear, up only 0.2%. Still, for the U.S. it was the slowest growth rate since 2020, the year of the pandemic.
It’s moments like these when the best thing to do is look at what the longer-term trend is telling us. Short-term gyrations are basically noise, but over time they determine the trend. As we have noted, there are three trends we follow: short-term or daily, intermediate or weekly, and long-term or monthly. Traders are interested in the short-term. Most money managers follow the intermediate term. Warren Buffett followed the long-term.
So, what do we have? We look at the intermediate trend of the 10-year U.S. Treasury note, the US$ Index, WTI oil, gold, and the S&P 500.
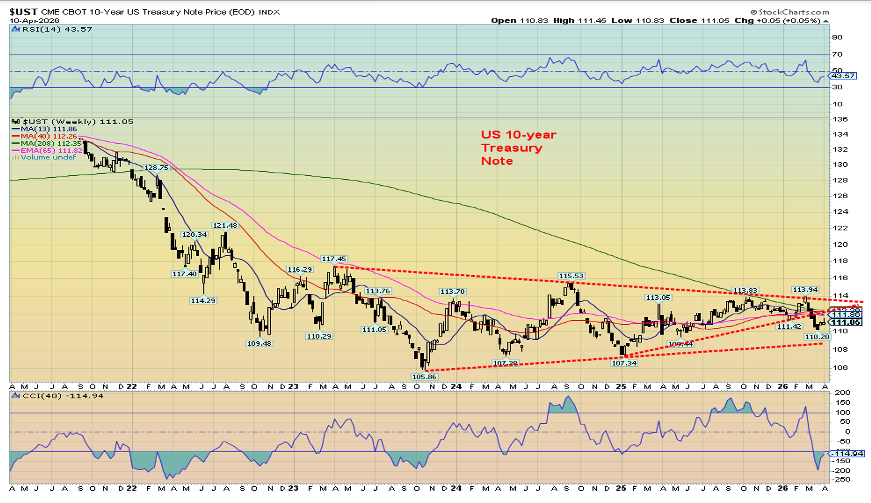
U.S. 10-year Treasury Note 2021–2026
Source: www.stockcharts.com
The trend of the weekly U.S. 10-year Treasury note (UST) is down. The RSI is neutral. The commodity channel index is negative. We are trading under the 13-week, 40-week, and 208-week (four years) moving averages (MA) and the 65-week exponential MA (EMA). The UST broke down from a clear symmetrical triangle with potential targets down to 103–104. That could imply a yield as high as 5.00% to as high as 5.30% vs. 4.30% today. A return into the triangle and breakout above 114 would imply higher prices (yields move opposite to prices). The next major breakdown point is under 109. The pattern suggests that the path of least resistance is down. Given the current sharp rise in the price of oil and subsequent rise in inflation, targets down to 98 might not be so unrealistic.
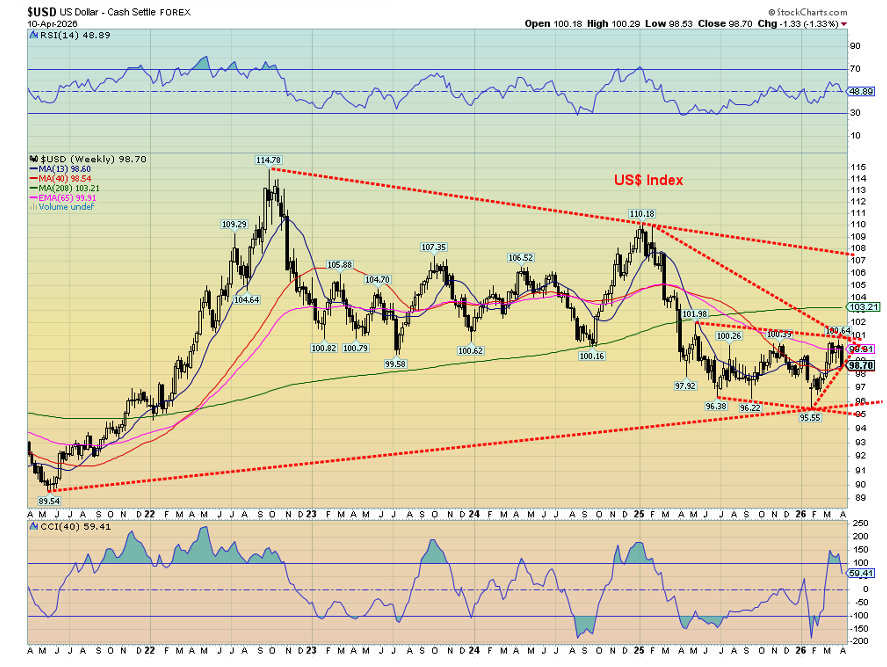
US$ Index 2021–2026
Source: www.stockcharts.com
The intermediate trend of the US$ Index (USDX) is up but weakening. The RSI is neutral while the commodity channel index is up but weakening. We appear to have broken down from a test of the 65-day EMA. However, we are currently at or near the 13-week and 40-week MAs acting as support. A firm break under 98 should point to lower prices. For most of the past year we appear to have been trading within a sideways pattern that’s generally between 96 and 101. We’d need to break under 95 to confirm a breakdown from that pattern that could then target down to around 88–90. We need to break back above 101, then above 103 to suggest that the trend has firmly turned up. A weakening U.S. dollar is not surprising, given the U.S.’s massive debt, trade tariffs, the war, and more. The long-term trend for the US$ Index is down. The last major top for USDX was set back in 2022 at 114.78. The long-term trend of the US$ Index has been down since the 1970s with huge swings both up and down, but with each successive high lower than the previous high. A downtrend.
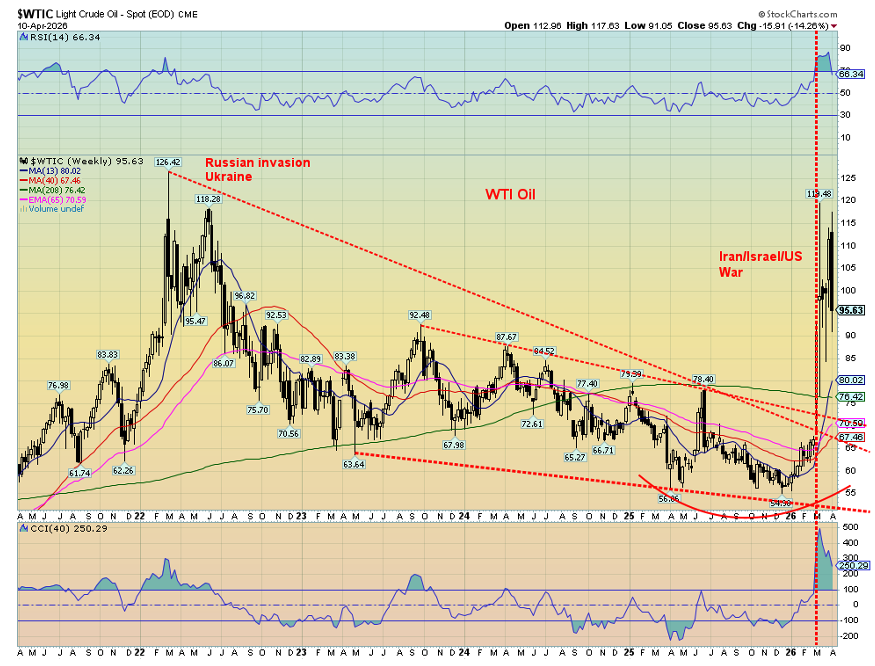
WTI Oil 2021–2026
Source: www.stockcharts.com
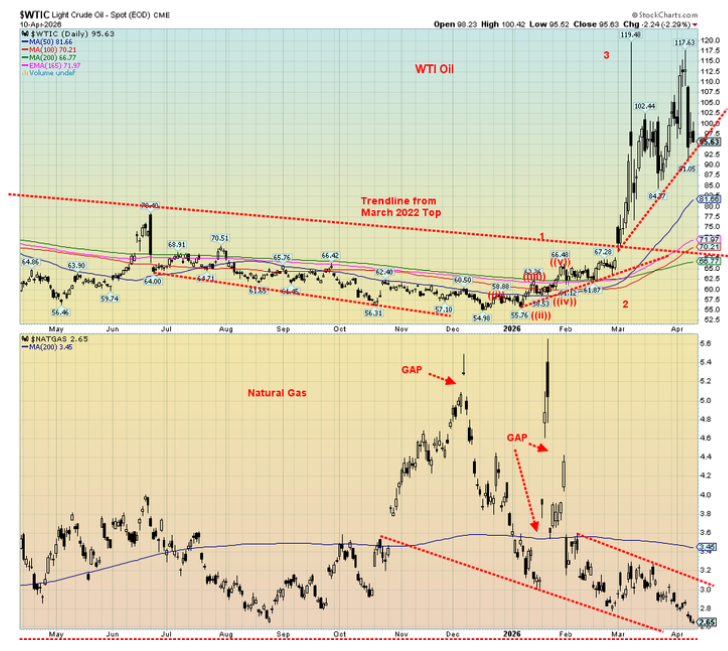
The intermediate trend of WTI oil is up. This has been the case since the outbreak of the US/Israel/Iran war on February 28, 2026. The shakedown that occurred on April 8 resulted from the announcement of a two-week ceasefire. It was a nasty dramatic day, but the next day oil was rebounding. The ceasefire was, it appears, on hold. Now the peace talks have broken down. This was the opposite of a relief rally. A sharp correction within an uptrend. We have broken out of the long downtrend from 2022, the top of the Russia/Ukraine oil peak. We are trading firmly above the 13-week, 40-week, and 208-week MAs and the 65-week EMA. The RSI has come down from severely overbought. The commodity channel index is firmly to the upside but down from its highs as well. As a result, this drop, while scary, is merely a sharp correction within an uptrend. After peaking at $119.48, WTI oil appears to be forming a consolidation flag or pennant. We’d have to start dropping under $76 to suggest to us that this huge up move is over. However, as long as this war continues, the odds of that happening are slim. New highs seem to be already in the cards. But first we have this ongoing correction.
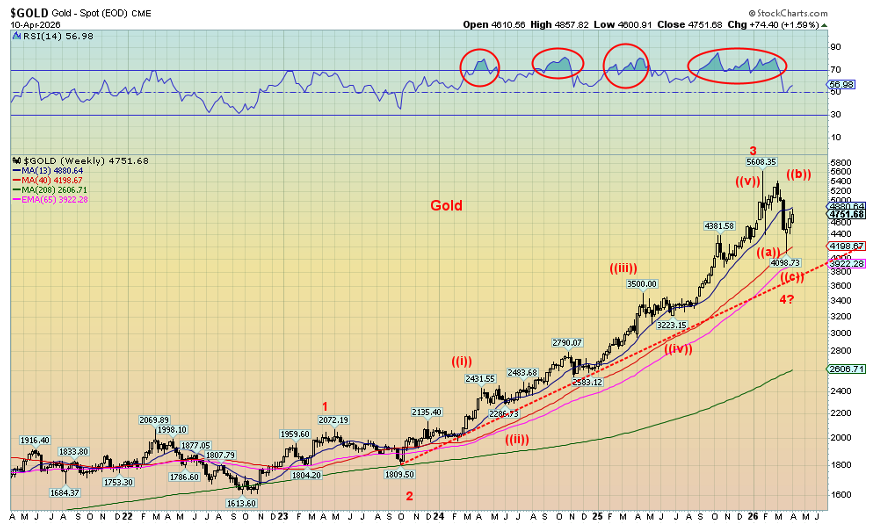
Gold 2021–2026
Source: www.stockcharts.com
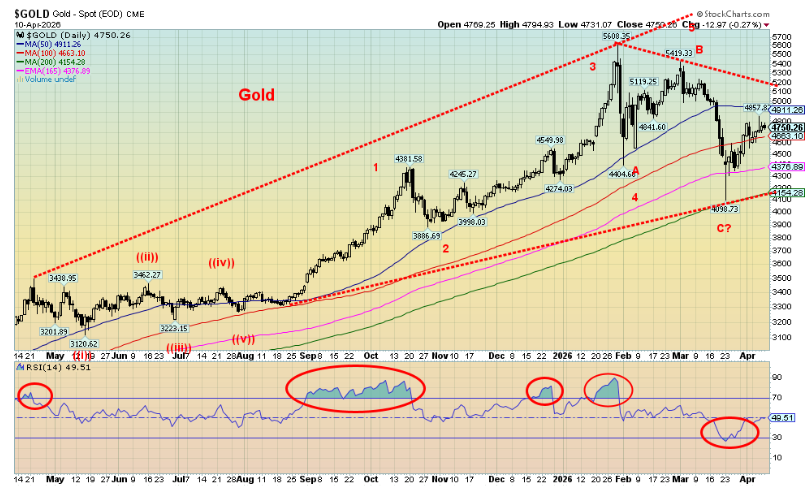
The intermediate trend for gold is up. The recent sharp correction is, we suspect, nothing more than that: an overdue sharp correction within the context of a strong bull market. Our wave count suggests that we have made three waves up from the 2022 low. The recent correction is the fourth wave, with the fifth to come. The RSI is down from severely overbought. The commodity channel index has fallen as well from very overbought
but overall, it remains up although weakened. The recent sharp correction appears to have fallen in a classic ABC pattern. The low was at/near the 40-week MA. Tests of these MAs are not unusual in a bull market. We’d have to break under $3,900 to suggest to us that this bull is over. We’ve started to rise again; however, it has not been a strong rise so far, which suggests the correction may not yet be over. A corrective pattern of ABCDE is not unusual. If correct, this up wave may be our D wave. We need to break over $5,400 to suggest to us new highs are probable.
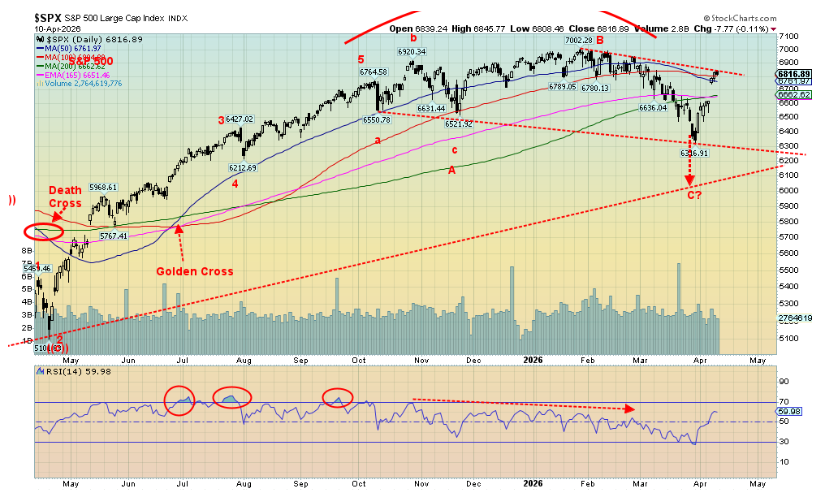
S&P 500 2021–2026
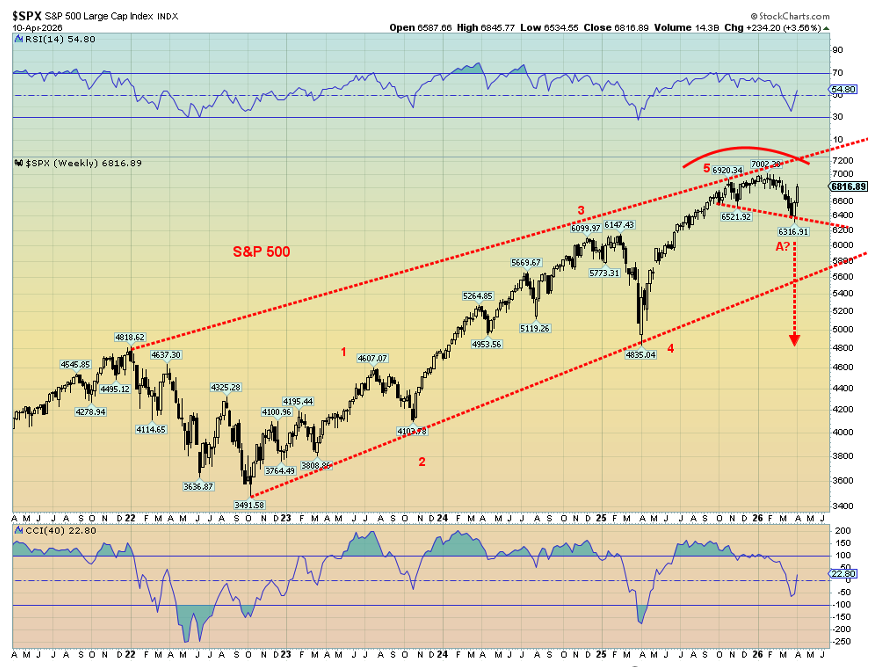
Source: www.stockcharts.com
The intermediate trend of the S&P 500 (SPX) is neutral. Last week the trend had turned down but the rebound has lessened the downtrend. The RSI is currently neutral while the commodity channel index is also neutral.
This came after the April 8 relief rally. So far, there has been no strong follow-through as the ceasefire teeters. We appear to be falling from a rounding top. The recent low near 6,300 may be the A wave down. The current rebound could be the B wave up. Even on these waves we could see new highs with resistance up to 7,200. It would be the prefect hook to pull unsuspecting investors back into the market. Most analysts we read continue to believe this market is overvalued, despite this recent pullback. The market appears to be hanging in as corporate profits remain elevated. But weakness is showing up with the recent Q4 GDP numbers. The recent decline took us only to the 65-week EMA. We need to break under 6,400 to suggest to us we are starting another leg down.
The ceasefire announcement brought us a dramatic day. Ceasefire talks may continue to dominate going forward, which will increase volatility. The end of peace talks could signal resumption of the war. All this is ultimately what William Shakespeare said in Macbeth, Act V, Scene V, lines 17–28: “Told by an idiot, full of sound and fury. Signifying nothing.” Be prepared for lower prices later once this current noise is over.
Chart of the Week
Inflation
Inflation, U.S. 10-Y, Fed Rate 2016–2026
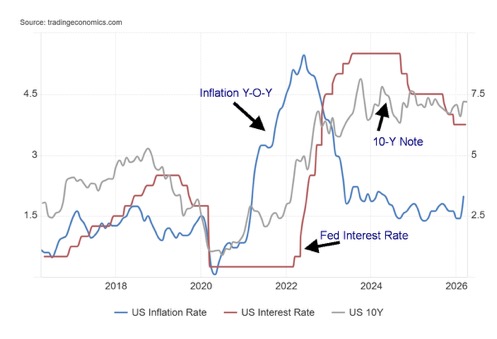
Source: www.tradingeconomics.com, www.bls.gov, www.federalreserve.gov
Inflation is back, thanks to the U.S./Israel/Iran war. War is always inflationary, even if that effect is sometimes delayed. Higher inflation puts pressure on interest rates. Inflation in the U.S. jumped during the U.S. Civil War, World War I, World War II, and the Vietnam war. Our last bout of inflation was at the start of the Russia/Ukraine war, which shot energy prices skyward. In many ways, the March jump in inflation shouldn’t have been a surprise. Inflation jumped to 3.30% in March, thanks to the Iran war. In February and January, it was 2.4%. This is not the direction the Fed wants to see, and we suspect it’s not the direction the White House wants to see, either.
While the rise in inflation was largely in line with expectations, it is no surprise the rise was mainly because of the jump in energy prices. Gasoline and fuel oil were victims, as were jet fuel and diesel oil. This is the biggest jump in inflation since June 2022. If there is any consolation, the core inflation rate (ex food and energy) was basically unchanged at 2.6% vs. an expectation of 2.7%. That’s nice, but when you fill up your car, you’re well aware that costs have jumped. Gas prices have jumped between 20% and 30% this past month.
This jump in inflation is starting at a higher level than it did in 2022, thanks to the earlier impact of tariffs. Given the effects of the war, there is some expectation that inflation could stay elevated for some time. Inflation, it is noted, was already rising before the start of the war. We are now well above the Fed’s 2% target, which makes the Fed’s job even harder. So much for transitory inflation. Stagflation, anyone?
Sinking consumer sentiment
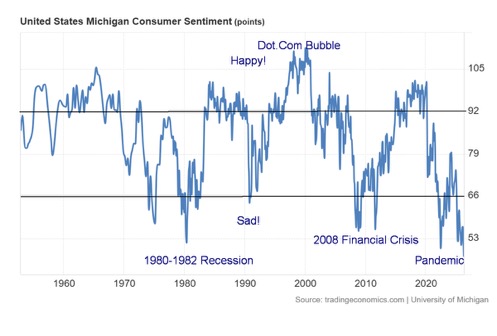
Source: www.tradingeconomics.com, www.umich.edu
Consumer sentiment has hit the sewer, plunging 11% to a low of 47.6 in early April 2026. Grant you, this is before the so-called ceasefire was announced. It’s an historic low, surpassing the lows of 1980–1982 during
that steep recession, the 2008 financial crisis, and the pandemic. Recessions were associated with the latter two. This time we are not yet in a recession. It was a broad-based drop across all demographics. Even business sentiment plunged 20%. Not only are consumers worried about rising prices (inflation), but they are also concerned about sinking values on their portfolios. What’s the indicator going to do if a real recession arrives?
Canada’s employment
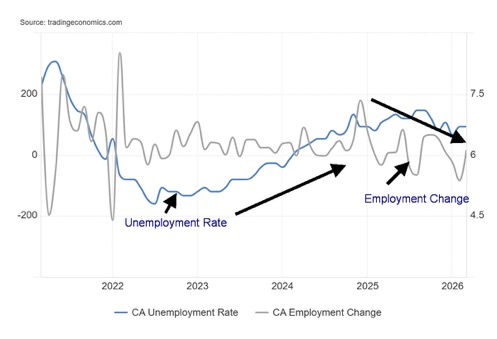
Source: www.tradingeconomics.com, www.statcan.gc.ca
Canada created 14,100 jobs in March, just under the expected 15,000. That was an improvement over February that saw a decline of 83,900 jobs. Full-time jobs fell 1,100 while part-time employment rose 15,200. The participation rate was unchanged at 64.9%. One good surprise was that average hourly wages rose 5.1%, above February’s 4.2% and well above expectations of 3.7%. The unemployment rate was unchanged at 6.7%, better than the expected 6.9%. The R8 unemployment rate, the highest reported by Statistics Canada (plus discouraged searchers, waiting group, and portion of involuntary part-timers) rose to 9.6% from 9.5%.
Note that employment trends in Canada are the same as in the U.S., with falling employment change (called nonfarm payrolls in the U.S.) and a rising unemployment rate, although we’ve softened in the past few months. All things considered, this has to be viewed as a positive report. Nonetheless, we await the impact of rising inflation due to the war.
Stocks
Source: www.stockcharts.com
The stock market appears to be ignoring the ongoing war in the Middle East. The S&P 500 is down only 2.7% from its all-time high seen in January 2026. Oil is up 72% from its earlier low and it has been up even more. The stock market appears to be ignoring gravity and overvaluation.
We cite a few reasons for this. Earnings for Q1 have been stronger than expected, with investment in AI infrastructure driving demand. Overall, the U.S. is a net energy exporter. Dependence on oil is not as strong today as it was in the 1970s, with energy efficiency more predominant today. Rising energy stocks have helped buoy the market. The market appears to want to believe that a ceasefire is pending. The relief rally? The economy today is more resilient. Despite historically low consumer sentiment, that doesn’t appear to have negatively impacted consumer spending. While high-growth tech stocks are wavering, other sectors such as financials and energy are benefiting because they tend to respond positively to inflation.
Source: www.stockcharts.com
The relief rally sprang into action this past week. The S&P 500 was up 3.6%, the Dow Jones Industrials (DJI) gained 3.0%, the Dow Jones Transportations (DJT) made new all-time highs, up 6.6%, and the NASDAQ gained 4.75, thanks to a rebound in the MAG7. The DJT is rallying on the belief that the transportation stocks will benefit from the current turmoil, despite higher energy prices. They seem to believe that the Fed will be forced to cut rates as the economy weakens. Dow theory says the averages must confirm each other. So far, the DJT has reached all-time highs, but the DJI has not. A divergence?
The S&P 400 (Mid) was up 3.4%, the S&P 600 (Small) gained 3.8%, the S&P 500 Equal Weight Index was up 1.8%, and the NY FANG Index jumped 6.0% as the MAG7 rebounded. Bitcoin joined the party, leaping 9.4%, but remaining down 16.3% in 2026. In Canada, the TSX Composite was up 1.8% and the TSX Venture Exchange (CDNX) gained 1.5%. In the EU, things were positive as well with the London FTSE up 1.6%, the EuroNext gaining 3.6%, the Paris CAC 40 up 3.7%, and the German DAX up 2.7%. In Asia, things were still positive as China’s Shanghai Index (SSEC) was up 1.7%, the Tokyo Nikkei Dow (TKN) was up 8.5%, Hong Kong’s Hang Seng (HSI) was up 3.1% and India’s Nifty Fifty (NIFTY) was up 5.9%. How does one spell relief – RELIEF.
But as we have noted, relief rallies never last. We call them bull traps. As the ceasefire unravels (if it gets started), the market’s mood will change. The full economic impact of this war and the sharp rise in energy prices are not yet fully priced in. Nonetheless, a relief rally can last anywhere from a few days to a month or so.
On this rebound, new highs are possible over 7,000 S&P 500. But it should be a slight new high only.
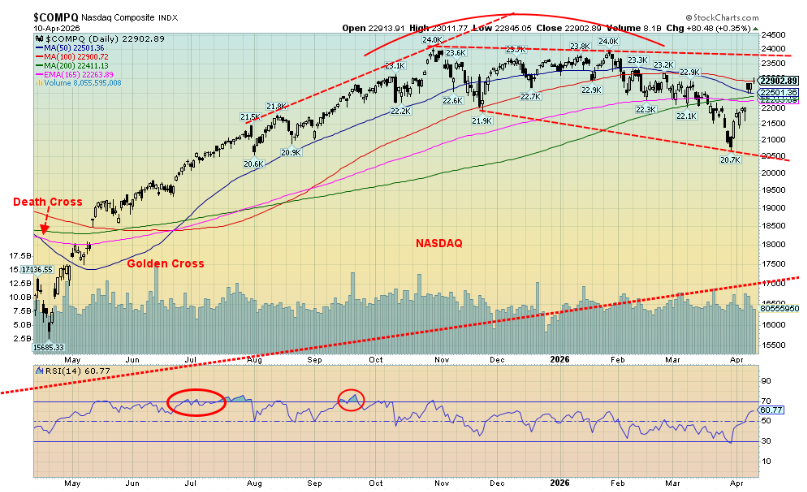
We can’t help but note that while the S&P 500 is off 2.7% from its all-time highs, the NASDAQ remains off 4.6%. The NASDAQ needs to regain above 23,200 to suggest new highs. We’re not that far from it, so it remains possible.
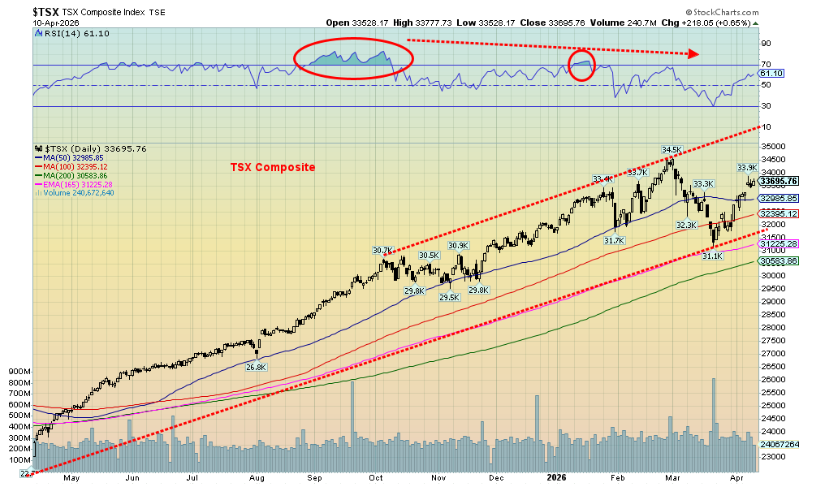
Source: www.stockcharts.com
The TSX saw three of its 14 subindices down on the week. The big loser was Telecommunications (TTS), down 7.7%. Competition, price wars, downgrades, potential dividend cuts, debt, and costs all weighed on stocks in the sector. Rogers Communications (RCI.B) lost 7.9% in one day. Other losers included Telus (T), Bell (BCE), and Cogeco (CCA). The sector is down 5.8% on the year but it’s not the worst. Information Technology (TTK) is down 18.1%. The big winner, of course, has been Energy (TEN), up 34.8%, despite losing 2.8% this past week. Golds (TGD), Metals (TGM), and Materials (TMT) are also all up nicely so far in 2026.
The stock market is defying expectations. Will it last? Probably not.
Bonds
Source: www.tradingeconomics.com, www.home.treasury.gov, www.bankofcanada.ca
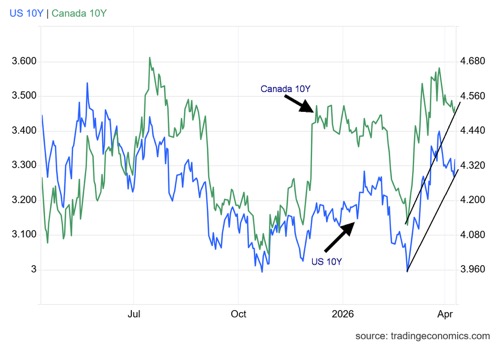
Bond yields were relatively steady this past week. Helping them was that the core inflation rate was actually below expectations at 2.6% year over year vs. the expected 2.7%. The core rate takes out the volatile food and energy components. As a result, the U.S. 10-year Treasury note wiggled higher to 4.34% from 4.31%. In Canada, the 10-year Government of Canada bond (CGB) slipped to 3.47% from 3.48%. All this has left the 10-year bond yields below their recent high. Our expectation is they will rise further. The U.S. 10-year over 4.40% and the Canadian 10-year over 3.60% would trigger higher yields. The 2–10 spreads remain firmly in recession mode, even as no recession is yet visible. However, as we have noted, consumer sentiment is at record lows. That usually translates into a recession. And as we noted under oil, we haven’t yet felt the full impact of the war and the rise in energy prices.
Gold and silver
Source: www.stockcharts.com
A question asked by many is, why isn’t gold rising in the current environment? Well, there are a few reasons. Interest rates have generally been rising, while the US$ Index has been strengthening. Geopolitical events tend to see a rush for the U.S. dollar, although that may be ending. A desire for liquidity has had institutional investors selling gold for cash to cover losses and other costs. That turns gold into a liquid asset rather than a safe haven asset. With inflation rising, it potentially lowers thoughts of a Fed rate cut. That’s not good for gold.
Despite all that, gold rose for the second week in a row with a gain of 1.6%. Silver fared better, up 4.4%. Platinum gained 2.8%. Of the near precious metals, palladium rose 1.6% and copper jumped 3.4%. The Gold Bugs Index (HUI) was up 4.6% and the TSX Gold Index (TGD) rose 4.4%. Except for palladium, all are up on the year, led by the gold stock indices HUI +20.6% and TGD +19.7%. A good week for gold.
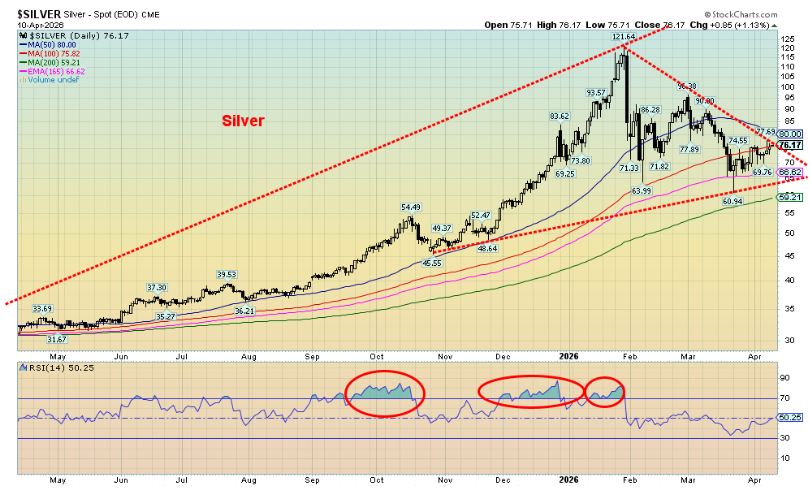
Gold is approaching the 50-day MA resistance near $4,900. Above $5,000 things start to improve, and above $5,250 new highs become probable. Silver is at downtrend line resistance and approaching the 50-day MA at $80. Above $80 and especially over $90 things are looking up again. Over $107 new highs become probable. Gold has support now down to $4,600, but under $4,400 new lows could loom. Silver’s support is at $66.50, but under $66 things start to get dicey.
Source: www.stockcharts.com
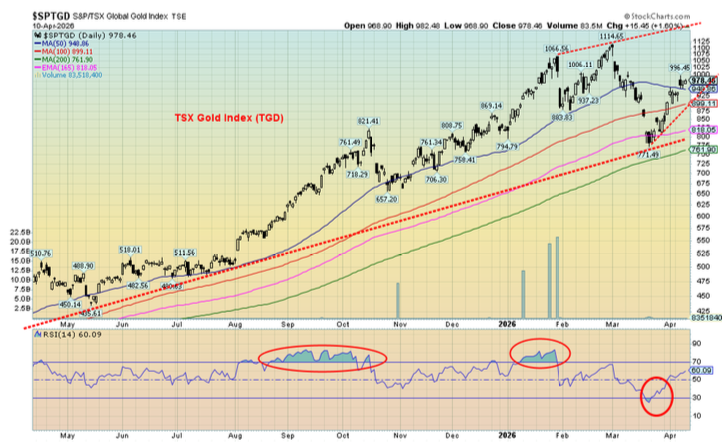
The gold stocks have rebounded off their lows. The TGD has gained 27% from its recent lows while the HUI is up about 26%. Still, they have further to go to suggest new highs. The TGD must break over 1,035 and the HUI over 915. Note how the gold stock indices made new highs, even as gold and silver made lower highs but then joined gold and silver in making new lows for the move. Critical support for the TGD is at 875; under 800 spells big trouble. For the HUI, support is down to 750 but under 700 new lows loom
We remain positive on the gold market. This has been a sharp correction typical of what we’d term fourth waves. The question is, when does the low come in? Backing and filling and retest of the lows cannot be ruled out. Typical bottoms for gold and silver are usually in the June/July period. We remain firmly in a positive phase of cycles for gold. We measure three waves up from the low in November 2022. The next major low shouldn’t come until 2029–2031. The fifth wave up could be the best yet. First, however, we need to find the low of the current correction.
So far, gold like the stock market has responded positively to the potential for a ceasefire. Gold is also responding to a lower US$ Index this past week. However, the risks remain for gold, given the need for liquidity, a stronger US$ Index, rising interest rates and inflation, and the ongoing war in the Middle East.
Source: www.stockcharts.com
Oil and gas
Source: www.stockcharts.com
Oil reacts to thoughts of a ceasefire. U.S. demands the opening of the Strait of Hormuz. Oil suffers its biggest weekly drop since 2025. So, is that it? Peace in our time? Or not?
Ceasefires have a way of not lasting long. This one may be dead on arrival. In the interim, we enjoy a minor respite. There is nothing in the chart of WTI that suggests to us that this is nothing more than a pullback, albeit sharp, in a bull market. The developing upward channel of higher lows and higher highs indicates a potentially strong bull market that has not yet run its course.
Whether there is a ceasefire or not, the Strait of Hormuz is still closed. Worse the U.S. is threatening a blockade on the Strait of Hormuz. What that means is unknown given the Strait is already effectively closed under Iran. The region has suffered major damage in Saudi Arabia, Bahrain, Dubai, UAE, Kuwait, Qatar, and to a lesser extent Iraq. And, lest we forget, Iran as well in the South Pars gas fields and the Tehran refinery. Refineries, export terminals, desalination plants, pipelines, and more. They will take months, even years, to repair at a cost of billions. And a reminder that the Strait of Hormuz has most likely been mined and it would take considerable time to clear the mines, if they can even find all of them.
The Strait of Hormuz is not international waters. It is the territorial waters of both Iran and Oman. Under the UN Law of the Sea (UNCLOS), ships have the right of “transit passage” through the strait. Iran, notably, has never ratified UNCLOS. In theory, passage can be suspended. To avoid collision, ships spend generally two miles in Omani waters and two miles in Iranian waters. As noted, 20% of the world’s oil passes through the strait.
The global effects of the sharp rise in oil prices due to the closure of the Strait of Hormuz have not yet been fully felt. Gas prices have leaped 30%–40%; rationing is already under way in Sri Lanka, Myanmar, Slovenia, Indonesia, Nepal, Kenya, and Bangladesh, and talk of rationing has been raised in the EU. Italy is rationing jet fuel, Pakistan has cut fuel allowances, Egypt has ordered early shutdowns and is burdened with monstrous debt and imports a significant portion of its energy needs, and the Philippines have declared an emergency.
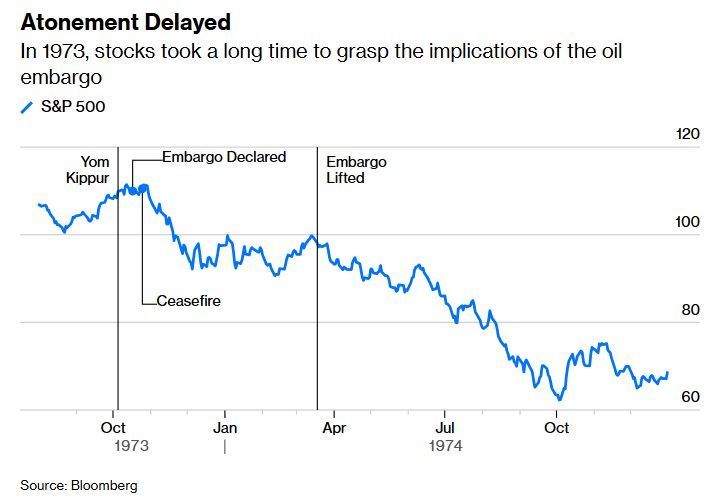
If you think the oil shock is already priced in, we have bad news for you. It’s probably just beginning. The Arab Oil Embargo of 1973 lasted only five months, from October 1973 to March 1974. The current crisis has been ongoing since February 28 or 43 days. The lifting of the embargo did not end the stock market decline or the deterioration in the economy. The largest decline in the 1973–1974 bear market occurred after the embargo was lifted. The 1973–1975 recession lasted for one year four months, starting in November 1973. The S&P 500 fell 40% after the lifting of the embargo. Before that it was down 21% at its worst, and then a rebound developed based on rumours the embargo would end. The period was also dominated by the unraveling of events in the U.S. with Watergate and President Nixon’s resignation in August 1974.
Economic devastation has a period of delay. This one should be no exception. Rising inflation may just be getting underway. Relief rallies are usually a bear trap. The worst of an unfolding recession is yet to come, with the war being the trigger. Stagflation could become a significant problem. The following chart shows that 1973–1974 bear market.
On the week, WTI oil fell 14.3% but remains up 66.5% in 2026. Brent crude fell 13.4%. Brent futures closed at $94.47 but dated Brent, reflecting real immediate costs, closed at about $132 on Friday and has been over $140. That reflects the real cost of oil. Natural gas (NG) at the Henry Hub continues to suffer, down 5.5% to new 52-week lows. EU NG at the Dutch Hub was down 12.4%. The energy stock indices responded to the decline with the ARCA Oil & Gas Index (XOI) down 4.9% and the TSX Energy Index (TEN) off 2.8%. Both remain up over 30% in 2026.
Be ready. This is just beginning.
Source: www.bloomberg.com, www.globalinvestmentletter.com
Markets and trends follow
Markets and Trends
|
|
|
|
% Gains (Losses) Trends |
|
||||
|
|
Close Dec 31/25 |
Close Apr 10/26 |
Week |
YTD |
Daily (Short Term) |
Weekly (Intermediate) |
Monthly (Long Term) |
|
|
|
|
|
|
|
|
|
||
|
S&P 500 |
6,845.50 |
6,816.89 |
3.6% |
(0.4)% |
up |
neutral |
up |
|
|
Dow Jones Industrials |
48,063.29 |
47,916.57 |
3.0% |
(0.3)% |
neutral |
neutral |
up |
|
|
Dow Jones Transport |
17,357.19 |
20,339.04 (new highs) * |
6.6% |
17.2% |
up |
up |
up |
|
|
NASDAQ |
23,241.99 |
22,902.89 |
4.7% |
(1.5)% |
up |
neutral |
up |
|
|
S&P/TSX Composite |
31,712.76 |
33,695.76 |
1.8% |
6.3% |
up |
up |
up |
|
|
S&P/TSX Venture (CDNX) |
987.74 |
992.22 |
1.5% |
0.5% |
neutral |
up (weak) |
up |
|
|
S&P 600 (small) |
1,467.76 |
1,584.15 |
3.8% |
7.9% |
up |
up |
up |
|
|
ACWX MSCI World x US |
67.18 |
72.29 |
4.9% |
7.6% |
up |
up |
up |
|
|
Bitcoin |
87,576.98 |
73,267.55 |
9.4% |
(16.3)% |
up |
down |
neutral |
|
|
|
|
|
|
|
|
|
|
|
|
Gold Mining Stock Indices |
|
|
|
|
|
|
|
|
|
Gold Bugs Index (HUI) |
701.49 |
845.70 |
4.6% |
20.6% |
neutral |
up |
up |
|
|
TSX Gold Index (TGD) |
817.76 |
978.56 |
4.4% |
19.7% |
up |
up |
up |
|
|
|
|
|
|
|
|
|
|
|
|
% |
|
|
|
|
|
|
|
|
|
U.S. 10-Year Treasury Bond yield |
4.17% |
4.34% |
0.7% |
4.1% |
|
|
|
|
|
3.3Cdn. 10-Year Bond CGB yield |
3.44% |
3.47% |
(0.3)% |
0.9% |
|
|
|
|
|
Recession Watch Spreads |
|
|
|
|
|
|
|
|
|
U.S. 2-year 10-year Treasury spread |
0.69% |
0.53% |
6.0% |
(23.2)% |
|
|
|
|
|
Cdn 2-year 10-year CGB spread |
0.85% |
0.68% |
1.5% |
(20.0)% |
|
|
|
|
|
|
|
|
|
|
|
|
|
|
|
Currencies |
|
|
|
|
|
|
|
|
|
US$ Index |
98.26 |
98.68 |
(1.3)% |
0.4% |
neutral |
up |
down |
|
|
Canadian $ |
72.87 |
72.27 |
0.6% |
(0.8)% |
down |
neutral |
neutral |
|
|
Euro |
117.48 |
117.31 |
1.7% |
(0.1)% |
up |
neutral |
up |
|
|
Swiss Franc |
126.21 |
126.71 |
1.2% |
0.4% |
down (weak) |
neutral |
up |
|
|
British Pound |
134.78 |
134.68 |
1.8% |
(0.1)% |
up |
neutral |
up |
|
|
Japanese Yen |
63.83 |
62.77 |
0.2% |
(1.7)% |
down |
down |
down |
|
|
|
|
|
|
|
|
|
|
|
|
|
|
|
|
|
|
|
|
|
|
Precious Metals |
|
|
|
|
|
|
|
|
|
Gold |
4,311.97 |
4,750.56 |
1.6% |
10.2% |
down (weak) |
up |
up |
|
|
Silver |
71.16 |
76.17 |
4.4% |
7.0% |
down (weak) |
up |
up |
|
|
Platinum |
124.81 |
2,055.80 |
2.8% |
0.4% |
neutral |
neutral |
up |
|
|
|
|
|
|
|
|
|
|
|
|
Base Metals |
|
|
|
|
|
|
|
|
|
Palladium |
1,619.50 |
1,538.50 |
1.6% |
(5.0)% |
down (weak) |
neutral |
up |
|
|
Copper |
5.64 |
5.85 |
3.4% |
3.7% |
up |
up |
up |
|
|
|
|
|
|
|
|
|
|
|
|
Energy |
|
|
|
|
|
|
|
|
|
WTI Oil |
57.44 |
95.63 |
(14.3)% |
66.5% |
up |
up |
up |
|
|
Nat Gas |
3.71 |
2.65 (new lows) |
(5.5)% |
(28.6)% |
down |
down |
down (weak) |
|
Source: www.stockcharts.com
* New All-Time Highs
Note: For an explanation of the trends, see the glossary at the end of this article.
New highs/lows refer to new 52-week highs/lows and, in some cases, all-time highs.
Copyright David Chapman 2026
GLOSSARY
Trends
Daily – Short-term trend (For swing traders)
Weekly – Intermediate-term trend (For long-term trend followers)
Monthly – Long-term secular trend (For long-term trend followers)
Up – The trend is up.
Down – The trend is down
Neutral – Indicators are mostly neutral. A trend change might be in the offing.
Weak – The trend is still up or down but it is weakening. It is also a sign that the trend might change.
Topping – Indicators are suggesting that while the trend remains up there are considerable signs that suggest that the market is topping.
Bottoming – Indicators are suggesting that while the trend is down there are considerable signs that suggest that the market is bottoming.
Disclaimer
David Chapman is not a registered advisory service and isnot an exempt market dealer (EMD) nor a licensedfinancial advisor. He does not and cannot giveindividualised market advice. David Chapman hasworked in the financial industry for over 40 yearsincluding large financial corporations, banks, andinvestment dealers. The information in this newsletter isintended only for informational and educationalpurposes. It should not be construed as an offer, asolicitation of an offer or sale of any security. Everyeffort is made to provide accurate and completeinformation. However, we cannot guarantee that therewill be no errors. We make no claims, promises orguarantees about the accuracy, completeness, oradequacy of the contents of this commentary andexpressly disclaim liability for errors and omissions in thecontents of this commentary. David Chapman willalways use his best efforts to ensure the accuracy andtimeliness of all information. The reader assumes all riskwhen trading in securities and David Chapman advisesconsulting a licensed professional financial advisor orportfolio manager such as Enriched InvestingIncorporated before proceeding with any trade or ideapresented in this newsletter. David Chapman may ownshares in companies mentioned in this newsletter.Before making an investment, prospective investorsshould review each security’s offering documents whichsummarize the objectives, fees, expenses and associatedrisks. Although Artificial Intelligence (AI) may bedeployed from time to time, AI output is monitored andadjusted, if necessary, for accuracy. David Chapmanshares his ideas and opinions for informational andeducational purposes only and expects the reader toperform due diligence before considering a position inany security. That includes consulting with your ownlicensed professional financial advisor such as EnrichedInvesting Incorporated. Performance is not guaranteed,values change frequently, and past performance may notbe repeated.
About the author


Website: https://www.enrichedinvesting.com
Disclaimer: David Chapman is not a registered advisory service and is not an exempt market dealer (EMD) nor a licensed financial advisor. We do not and cannot give individualised market advice. David Chapman has worked in the financial industry for over 40 years including large financial corporations, banks, and investment dealers. The information in this newsletter is intended only for informational and educational purposes. It should not be considered a solicitation of an offer or sale of any security. The reader assumes all risk when trading in securities and David Chapman advises consulting a licensed professional financial advisor before proceeding with any trade or idea presented in this newsletter. David Chapman may own shares in companies mentioned in this newsletter. We share our ideas and opinions for informational and educational purposes only and expect the reader to perform due diligence before considering a position in any security. That includes consulting with your own licensed professional financial advisor.