
“Giving money and power to government is like giving whisky and car keys to a teenager.”
—P.J. O’Rourke, American political satirist and journalist; b. 1947
“Actions have consequences. Which is when and why power comes into play to ameliorate, smoothen, leaven things.”
—S. L. Bhyrappa, Popular novelist in India, in the Kannada language; b. 1934
“There are two times in a man’s life when he shouldn’t speculate: when he can afford to and when he can’t.”
—Samuel Langhorne Clemens, known by his pen name Mark Twain, American writer, humourist, entrepreneur, publisher, and lecturer; 1835–1910
Whenever I go away something always seems to happen. So, what happened? Well, gold soared through $1,900, making new all-time highs. And, as soon as I got back, gold did it again, soaring through $2,000. Silver had already started its move as I was packing up having taken out finally the 2016 high of $21.23. Silver has now achieved our target of $29 noted in this column a few weeks ago.
What’s going on? Have gold and silver entered the mania phase? It is possible. I was around for the mania phase of gold and silver in 1979 when gold soared from $200 in November 1978 to peak at $875 in January 1980. Being somewhat younger and of limited means, I only witnessed it. But I do remember the lines around the block to buy gold. Silver did the same, soaring from $6 to $50. A similar move today from a low in November 2019 of $1,446 for gold could see gold go to over $6,300 and silver go from a low of $16.70 to $139. Impossible?
Well it is not difficult to find those who believe both gold and silver could do just that. And the markets for gold and silver are actually quite small. The total gold market is estimated to be about 197,576 metric tonnes (World Gold Council) giving all the gold in the world a value of roughly $12.7 trillion. Of that, an estimated 47% is jewellery. The Fed’s balance sheet is over $7 trillion. All the stock market exchanges in the world are estimated to be about $90 trillion and global debt is estimated at $255 trillion.
Our table below summarizes the size of the gold and silver market compared to other markets. This is based on an excellent series of charts from Visual Capitalist, published in May 2020. The chart was far too big so we condensed it in a table with some revisions to the numbers and the context.
All the Money in the World (U.S. Dollars, Billions)
|
Market |
Context |
Size (US$ billions) |
|
Silver |
Above Ground Silver Stocks @ $28, Financial Market only; i.e., private investment mostly. Value of all above ground silver stocks including jewellery & technology is about $711 billion |
71.5 |
|
Crypto Currencies |
All Cryptos. Bitcoin is roughly 2/3rds of the market. There are 6,129 cryptos. |
358.9 |
|
Global Annual Military Spending |
U.S. is 36% of total |
1,750 |
|
U.S. Budget Deficit |
Est. 2020 |
3,800 |
|
Gold |
Above Ground Gold Stocks @ $2,000. Financial Market i.e. investment & reserves only. Value of above ground gold stocks including jewellery is about $12,700B. |
5,970 |
|
Coins & Bank Notes |
U.S. dollars is the largest |
6,600 |
|
Fed’s Balance Sheet |
As at July 29, 2020 |
6,949 |
|
Billionaires |
Jeff Bezos is est. at $113B |
8,000 |
|
Fortune 500 |
As at May 2020. The big 5 (MSFT, AAPL, AMZN, GOOG, FB) make up 24%. |
17,100 |
|
U.S. Total Debt |
80,740 |
|
|
|
20,553 |
|
|
29,900 |
|
|
30,287 |
|
Global GDP |
Est. drop of about 5% from 2019 for 2020 |
80,000 |
|
Global Stock Markets |
As at April 2020. NYSE is the largest. NYSE and NASDAQ make up 46%. |
89,500 |
|
Money Supply |
Physical is 7% of the total |
|
|
Narrow Money |
35,200 |
|
Broad Money |
95,700 |
|
Global Debt |
U.S. is 31% of the total with less than 5% of the population. Total is 322% of GDP |
255,000 |
|
|
61,965 |
|
|
69,870 |
|
|
47,940 |
|
|
75,225 |
|
Global Real Estate |
|
280,600 |
|
North America has 22% of residential assets with 6% of the population. |
220,000 |
|
|
33,000 |
|
|
27,000 |
|
Global Wealth |
Source: Credit Suisse |
360,600 |
|
U.S.A. - $106,016 |
114,670 |
|
Germany - $14,785 |
90,871 |
|
China - $61,662 |
141,355 |
|
|
9,736 |
|
|
3,967 |
|
Derivatives |
i.e., futures, forwards, options, warrants, swaps |
|
|
|
11,600 |
|
|
558,500 |
|
|
1,000,000 |
Source: www.visualcapitalist.com
The investment value of gold and silver makes up only about 1.7% of global wealth. It is a pretty small market. All the gold and silver mining companies in the world are only worth about $500 billion. Amazon alone is worth about $1.6 trillion. If a mere ¼% of the world’s wealth is shifted into gold and silver, there isn’t enough in the world to satisfy the demand.
So, what’s going on? According to Mark O’Byrne of GoldCore (www.goldcore.com), there are a number of reasons:
- Concerns over the outlook for assets and currencies (all fiat currencies)
- Concerns over the growing number of global cases for COVID-19. It is currently estimated that approximately one million new cases are added every four days. There are currently over 5,000 deaths every day
- Concerns over the record deficit spending by governments and central banks’ purchases of bonds and other assets
- Concerns over the potential for global war, given the rising tensions (including military) between the U.S. and China. The explosion and destruction in Beirut highlighted the risk of war in the unstable Middle East—regardless of whether the explosion was deliberate or accidental
- Concerns over the growing domestic divide in a number of countries, giving rise to clashes on the streets—not only in North America but also in Europe, Asia (Hong Kong), and Latin America
- Concerns over the risks to the global financial, economic, monetary, and geopolitical systems
- Concerns over the value of the U.S. dollar and other currencies, due to currency creation on a scale not seen since the collapse of the Weimer Republic (Germany) after WW1. Savers are not getting any yield on bank deposits and are facing negative rates on depreciating currencies
Gold has a long history of being connected to money. However, we freely admit that gold is not necessarily money as mediums of exchange have varied over the centuries. Since 1971, with the collapse of Bretton Woods and the regime of fixed exchange rates linked to the U.S. dollar and gold, the world has seen an explosion in debt and ongoing financial and currency crisis and economic instability. Today, all currencies are fiat currencies—meaning, money is set by government fiat and has no intrinsic value. It is essentially an I.O.U. backed by nothing but the good faith of the government. If faith is lost in governments, investors will flee to gold, private assets i.e. stocks and land (property).
It is not as if the gold standard was the answer to preventing financial instability. History is rife with economic depressions and financial collapses. Gold has a history of being money for upwards of 2,000 years. The first known gold coins were issued in the 6th century B.C. in Lydia, an iron-age kingdom in Western Asia Minor that is now a part of Western Turkey. The earliest coins were made of electrum, a naturally occurring alloy between gold and silver.
Gold has been free floating only since the end of Bretton Woods in August 1971. Before that, Bretton Woods had set the value of gold at US$35/ounce. Gold was revalued up in 1934 with the Gold Reserve Act raising the price from $20.67 to $35 a 70% increase. If the gold price was set to the value of U.S. money supply (M1) it would currently require a gold price of over US$20,000/ounce (based on U.S. gold reserves of 8,133.5 metric tonnes). Or if it was just set to back the total of notes and coins in circulation in the U.S., the price of gold would need to be set at about $6,500.
$6,500? Only about $4,000 to go!
300 Years of Gold Prices (log scale)
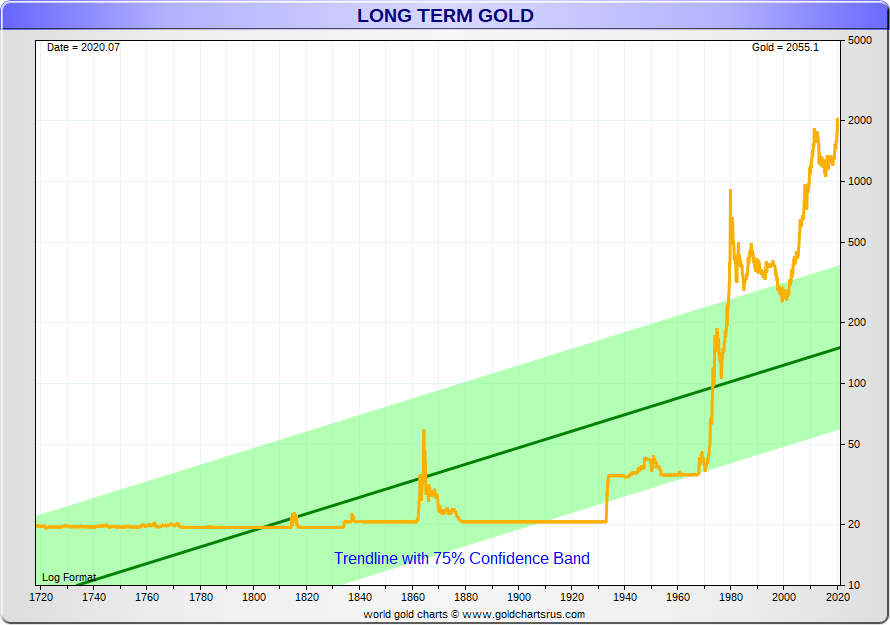
Source: www.goldchartsrus.com
MARKETS AND TRENDS
|
|
|
|
% Gains (Losses) Trends
|
|||||
|
|
Close Dec 31/19 |
Close Aug 7/20 |
Week |
YTD |
Daily (Short Term) |
Weekly (Intermediate) |
Monthly (Long Term) |
|
|
Stock Market Indices |
|
|
|
|
|
|
|
|
|
S&P 500 |
3,230.78 |
3,351.28 |
2.5% |
3.7% |
up |
up |
up |
|
|
Dow Jones Industrials |
28,645.26 |
27,433.48 |
3.8% |
(3.9)% |
up |
up |
up |
|
|
Dow Jones Transports |
10,936.70 |
10,576.38 |
5.8% |
(3.0)% |
up |
up |
up (weak) |
|
|
NASDAQ |
9,006.62 |
11,010.98 (new highs) |
2.5% |
22.7% |
up |
up |
up |
|
|
S&P/TSX Composite |
17,063.53 |
16,544.48 |
2.3% |
(3.0)% |
up |
up |
up |
|
|
S&P/TSX Venture (CDNX) |
577.54 |
739.98 (new highs) |
2.6% |
28.1% |
up |
up |
up |
|
|
S&P 600 |
1,021.18 |
911.67 |
5.4% |
(10.7)% |
up |
neutral |
down (weak) |
|
|
MSCI World Index |
2,033.60 |
1,857.55 |
2.0% |
(8.7)% |
up |
neutral |
down (weak) |
|
|
NYSE Bitcoin Index |
7,255.46 |
11,630.52 (new highs) |
3.6% |
60.3% |
up |
up |
up |
|
|
|
|
|
|
|
|
|
|
|
|
Gold Mining Stock Indices |
|
|
|
|
|
|
|
|
|
Gold Bugs Index (HUI) |
241.94 |
350.78 (new highs) |
flat |
45.0% |
up |
up |
up |
|
|
TSX Gold Index (TGD) |
261.30 |
394.15 (new highs) |
(0.9)% |
50.8% |
up |
up |
up |
|
|
|
|
|
|
|
|
|
|
|
|
Fixed Income Yields/Spreads |
|
|
|
|
|
|
|
|
|
U.S. 10-Year Treasury yield |
1.92 |
0.55 |
flat |
(71.4)% |
|
|
|
|
|
Cdn. 10-Year Bond yield |
1.70 |
0.49 |
4.3% |
(71.2)% |
|
|
|
|
|
Recession Watch Spreads |
|
|
|
|
|
|
|
|
|
U.S. 2-year 10-year Treasury spread |
0.34 |
0.42 |
(4.6)% |
23.5% |
|
|
|
|
|
Cdn 2-year 10-year CGB spread |
0 |
0.21 |
flat |
2,100.0% |
|
|
|
|
|
|
|
|
|
|
|
|
|
|
|
Currencies |
|
|
|
|
|
|
|
|
|
US$ Index |
96.06 |
93.43 |
0.1% |
(2.7)% |
down |
down |
down |
|
|
Canadian $ |
0.7710 |
0.7470 |
flat |
(0.3)% |
up |
up (weak) |
down |
|
|
Euro |
112.12 |
117.85 |
0.1% |
5.1% |
up |
up |
up |
|
|
Swiss Franc |
103.44 |
109.53 |
0.1% |
5.9% |
up |
up |
up |
|
|
British Pound |
132.59 |
130.56 |
(0.2)% |
(1.4)% |
up |
up |
neutral |
|
|
Japanese Yen |
92.02 |
94.38 |
(0.1)% |
2.5% |
up |
up |
up |
|
|
|
|
|
|
|
|
|
|
|
|
Precious Metals |
|
|
|
|
|
|
|
|
|
Gold |
1,523.10 |
2028.00 (new highs) |
2.1% |
33.2% |
up |
up |
up |
|
|
Silver |
17.92 |
27.54 (new highs) |
13.7% |
53.7% |
up |
up |
up |
|
|
Platinum |
977.80 |
970.40 |
5.6% |
(1.4)% |
up |
up |
up |
|
|
|
|
|
|
|
|
|
|
|
|
Base Metals |
|
|
|
|
|
|
|
|
|
Palladium |
1,909.30 |
2,176.60 |
1.5% |
14.0% |
up |
up |
up |
|
|
Copper |
2.797 |
2.79 |
(2.8)% |
(0.3)% |
neutral |
up |
neutral |
|
|
|
|
|
|
|
|
|
|
|
|
Energy |
|
|
|
|
|
|
|
|
|
WTI Oil |
61.06 |
41.22 |
2.4% |
(32.5)% |
up |
neutral |
down |
|
|
Natural Gas |
2.19 |
2.24 |
24.4% |
2.3% |
up |
up (weak) |
down |
|
Source: www.stockcharts.com, David Chapman
Note: For an explanation of the trends, see the glossary at the end of this article.
New highs/lows refer to new 52-week highs/lows.
Chart of the Week
Source: www.stockcharts.com
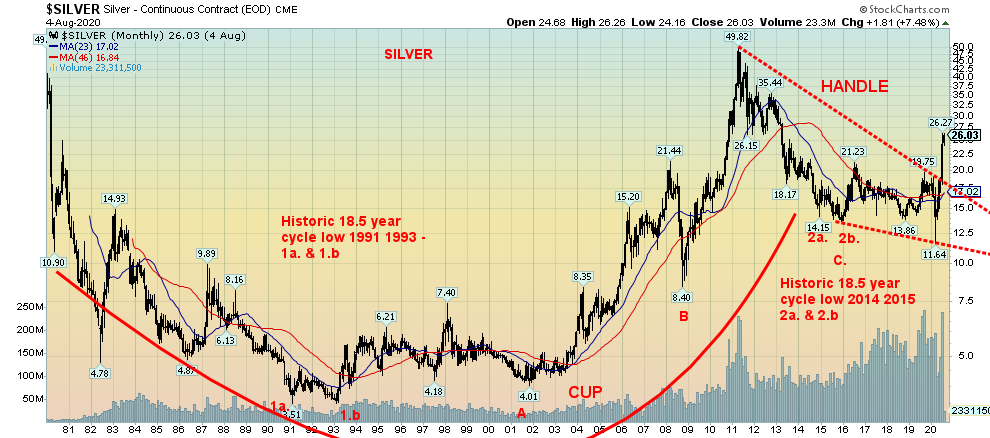
Silver has broken out of a multi-year down channel. Our monthly chart of silver shows what appears to be a huge multi-year cup and handle pattern. It is multi-year as the cup started with the high of January 1980 and ended with the high of April 2011. Silver started and ended at/near $50. What we have been experiencing for the past nine years is the handle for the cup. If the pattern is correct, then our minimum target could be up to around $65, based on the 2011 high of $49.82 and the 1991 low of $3.51. If silver were to successfully break above $65 then the next target could be up to $95.
Source: www.stockcharts.com
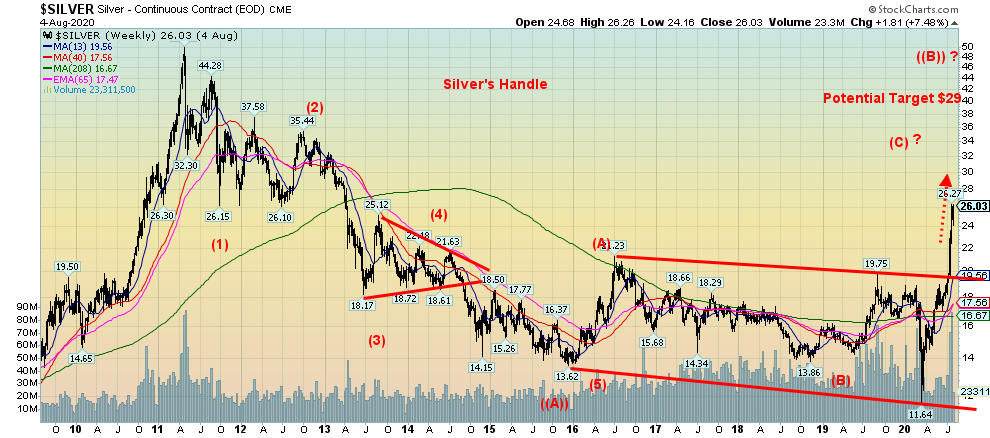
But we don’t want to get ahead of ourselves. The final part of the handle played itself out after the multi-year 18.5-year cycle low seen in December 2015. The channel that formed from 2015 to the present should now hold any pullbacks. It is unlikely we’ll fall back into that channel any time soon. As we have noted previously, the target for the breakout of the channel was up to around $29. With a high so far of $29.92 we achieved the target. The next target above that could be up to $35 once $29 is firmly taken out.
The multi-year cup and handle pattern is intriguing. However, be aware it won’t be a straight up move. Silver has a record that suggests a long-term 18.5-year cycle with the first one shown in 1991 and 1993 and the second shown to have occurred in 2014 and 2015. That means the next one shouldn’t occur until 2032–2034. Silver’s interim cycles are roughly every 7 years and from the 1991–1993 lows we saw lows in 2001 and 2008, followed by the major low in 2015. The next one is due possibly into 2022 or late 2021. Currently, the cycle is bullish given that we successfully took out the 2016 high. The 7-year cycle subdivides into roughly two 40-month cycles and the first one, we suspect, occurred with the low in November 2018. The sudden jerk down low of March 2020 was probably the half-cycle of the 40-month cycle, given it was roughly 16 months from November 2018, so it fell within the orb of the 20-month cycle which was due July 2020 +/- 4 months.
None of this is to suggest that silver will hit that potential target of $65 on this move, but it is certainly possible. A crest could certainly come in either late 2020 or early 2021 and then fall into the 40-month cycle low. The next 20-month cycle low would now be due October 2021 +/- 4 months. And that could also be a 40-month cycle low. But given the breakout from the cup and handle pattern and the breakout from the channel that formed 2015–2020, silver is embarking on an exciting move that could see much higher prices in the months ahead.
We also note that the gold/silver ratio peaked recently in March 2020 and that too was a bullish signal for silver as well as for gold. The gold/silver ratio could be headed for 70 down from a peak of almost 130 in March. Exciting times for silver going forward. But it won’t be straight up.
Source: www.stockcharts.com
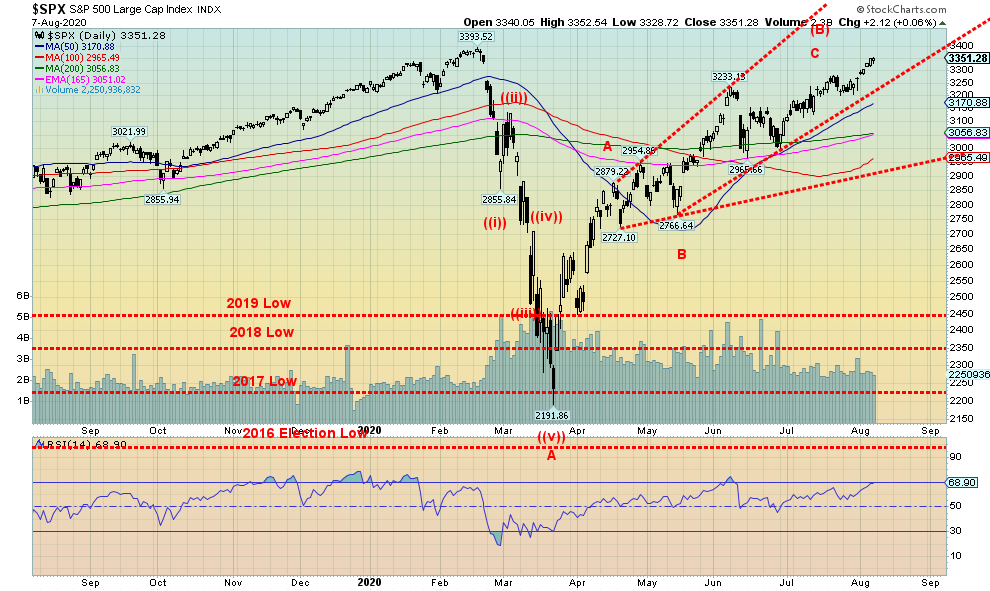
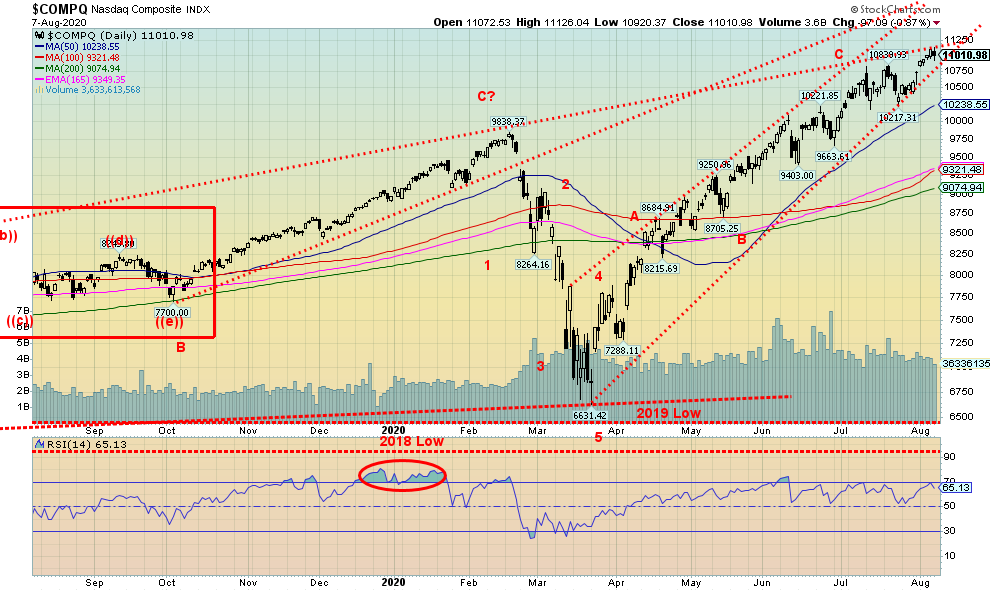
With the S&P 500 breaking to the upside once again, the implication is that new all-time highs are mere day(s) away. Trying to explain why this happening—against the backdrop of a pandemic with the U.S. recording the worst numbers of any country, official unemployment over 10%, and real unemployment 30%, rising bankruptcies, bank provisions for loan losses higher than that seen during the 2008 financial crisis, plus divisiveness in politics and riots on the streets—is really just a lesson in futility. Instead, we point to the massive amount of Fed injections, government stimulus programs, record debt, and record government spending. Of that money, 90% is probably not reaching Main Street but is lining the pockets of the institutions who, instead of lending it out are buying stocks. Even Warren Buffett is buying back his own stock—apparently a record $5.1 billion in May and June. Maybe he knows a good investment when he sees it.
With the stock market soaring, Wall Street and the 1% are enjoying the gains while Main Street wallows in riots, divisiveness, and a pandemic. As one pundit quipped, “it is socialism for the rich and capitalism for the poor” (apparently attested to Howard K. Smith during the ABC evening news in 1968, and thanks Jack). The implication is that the government takes care of the rich and everyone else fends for themselves. And with nowhere to put their money (how many yachts can one own?), they invest in the stock market.
This past week the S&P 500 gained 2.5% and is now positive on the year, up 3.7%. The Dow Jones Industrials (DJI) was up 3.8% but is still down 3.9% in 2020, the Dow Jones Transportations (DJT) gained 5.8% but remains down 3.0%, while the NASDAQ crossed 11,000, gaining 2.5%, and is up 22.7%. Okay, the NASDAQ still has a way to go to catch the Gold Bugs Index (HUI) that is up 45% in 2020. The small cap S&P 600 also gained up 5.4% but is still down 10.7% in 2020. In Canada, the TSX Composite gained 2.3% but is still down 3.0% while the TSX Venture Exchange (CDNX) continued its winning ways, up 2.6%—making new 52-week highs and up 28.1% on the year.
In Europe, the London FTSE gained 2.3%, the Paris CAC 40 rose 2.2% and the German DAX was up 2.9%. In Asia, China’s Shanghai Index (SSEC) eked out a gain of 1.3% while the Tokyo Nikkei Dow (TKN) was up 3.3%. All in all, a good week for everyone.
Where this stops is anyone’s guess now as new all-time highs seem to be in the cards for the S&P 500 and quite possibly the DJI too. The mindset seems to be, forget that the market is rising on the backs of roughly 6–10 stocks, just enjoy the party and who cares about the riots, pandemic, and divisions. Oh, and also the rising tensions between the U.S. and China with the latest salvo over Tik-Tok, a social media phenomenon used primarily by teenagers. And, lest we forget, the massive number of U.S. military bases encircling China, estimated at some 400 with warships and nukes. China has supposedly 30, tops.
The collapse in March 2020, primarily due to the pandemic, came as a shock. It was the swiftest 30%+ decline ever recorded, occurring in a mere 32 days as the S&P 500 fell 35.4%. But now the S&P 500 is up about 53% from that low. Quite a ride. Volatility shot through the roof, rivalling the type of volatility seen in 1929, Black Monday October 1987, and the financial crash of 2008. But authorities moved quickly as they deployed very aggressive monetary stimulii, pumped the banks full of money, and brought out stimulus programs for both people and industries.
Too bad they can’t get the handling of the pandemic right as the U.S. regularly sees 50,000–70,000 new cases every day and over a thousand deaths every day. Yet culture wars dominate the pandemic as well with division on such things as using masks and doing social distancing, or staying in lockdown (vs. opening up), accepted primarily by Democrats and rejected mostly by Republicans. Even Canada can’t seem to escape that either with similar divisions (Liberal vs. Conservative). But anticipation of a vaccine sooner rather than later helps spur the markets. And, while earnings are taking a hit, the market seems to be looking past that. Besides, with interest rates suppressed and not going anywhere, the stock market is where the action and the returns are. The ultra-low interest rates are spurring on record borrowings, not just by governments but also by corporations. Even the housing markets are rebounding, thanks to ultra-low interest rates and an expectation that they won’t rise any time soon.
So where do we go from here? Indicators are through the roof. Complacency is rampant. Bullish sentiment is extreme. Yet where does one put their money? Can’t seem to spend it (except for the poor—well, they can as they have to). The risk/reward ratio seems clear: it’s risk over reward. Trouble doesn’t appear until we drop under 3,200 and real trouble only develops under 2,950. Other than that, new all-time highs seem imminent. But beware—things could change quickly.
Source: www.stockcharts.com
Copyright David Chapman, 2020
About the author


Website: https://www.enrichedinvesting.com
Disclaimer: David Chapman is not a registered advisory service and is not an exempt market dealer (EMD) nor a licensed financial advisor. We do not and cannot give individualised market advice. David Chapman has worked in the financial industry for over 40 years including large financial corporations, banks, and investment dealers. The information in this newsletter is intended only for informational and educational purposes. It should not be considered a solicitation of an offer or sale of any security. The reader assumes all risk when trading in securities and David Chapman advises consulting a licensed professional financial advisor before proceeding with any trade or idea presented in this newsletter. David Chapman may own shares in companies mentioned in this newsletter. We share our ideas and opinions for informational and educational purposes only and expect the reader to perform due diligence before considering a position in any security. That includes consulting with your own licensed professional financial advisor.