It is a sobering fact that the prominence of central banks in this century has coincided with a general tendency towards more inflation, not less. [I]f the overriding objective is price stability, we did better with the nineteenth-century gold standard and passive central banks, with currency boards, or even with ‘free banking.’ The truly unique power of a central bank, after all, is the power to create money, and ultimately the power to create is the power to destroy.”
—Paul Volker, American economist, Chair Federal Reserve 1979–1987, Chairman Economic Recovery Advisory Board 2009–2011, President Federal Reserve Bank of New York 1975–1979, Under Secretary of Treasury for International Affairs 1969–1974; 1927–2019
“The problem with fiat money is that it rewards the minority that can handle money but fools the generation that has worked and saved money.”
—Adam Smith, Scottish economist, philosopher, pioneer of political economy, key figure during the Scottish Enlightment, author of The Theory of Moral Sentiments (1759) and others; 1723–1790
“If the American people ever allow private banks to control the issuance of their currency, first by inflation and then by deflation, the banks and corporations that will grow up around them will deprive the people of all their property until their children will wake up homeless on the continent their fathers conquered.”
—Thomas Jefferson, American statesman, diplomat, lawyer, architect, musician, philosopher, Founding Father USA, principal author of the Declaration of Independence, 3rd President U.S. 1801–1809, Vice President U.S. 1797–1801; 1743–1826
Fedspeak. A form of what one pundit refers to as “a turgid dialect of English” used by the Federal Reserve Board Chairman (and other members as well) in making wordy, vague, ambiguous statements of little substance. Some even refer to Fedspeak as Newspeak of Ninety Eighty-Four fame (George Orwell). Today they also call it “forward guidance,” a pleasant term with a ribbon on it to disguise the same blabber. Fedspeak is also sometimes known as Greenspeak after former Chairman Alan Greenspan who was well known for making vague, wordy, and ambiguous statements.
Having spent a few years in Capital Markets, I learned early that, in speaking with officials at the Fed or the Bank of Canada (BofC)—mostly the latter—in my early days, the conservation was one-way. You give and receive nothing in return. So, based on Wednesday’s FOMC interest rate announcement, it will immediately send hundreds of financial media types, hedge fund managers, portfolio managers, investors, and armchair quarterbacks scurrying around with their heads cut off trying to interpret what the Fed means.
So, what did the Fed say? Not much, really. Rates, as expected, are unchanged. They tinkered. We have talked endlessly about the ongoing reverse repo program to soak up all of the excess cash created by the ongoing QE program $120 billion/month. The excess cash was weighing on the markets and could push interest rates negative, something we believe the Fed wishes to avoid. So, the Fed tinkered and raised some short-term reverse repo rates and rates paid on excess reserves while leaving the whole interest rate structure 0% to 0.25% unchanged. There are only so many places to place all that excess cash. So, hence the reverse repo program. Money market funds are so overburdened with cash they don’t know what to do with it all and, in some cases, were offering negative rates just to discourage deposits. And if everyone piled into short-term treasury bills and others (i.e., commercial paper, bankers’ acceptances, etc.), rates could be pushed below zero. Hence, the Fed tinkering.
The Fed also wanted to send the message that they will prevent any overheating in the economy. Hence, the statement that rates could rise in the latter part of 2023 with two potential hikes of 0.25% each. To give it perspective, that’s two years away. They also discussed tapering bond purchases. That might give solace to bond bears, but the market is also aware that millions remain unemployed. As to jobs going unfilled, many who found themselves unemployed during the pandemic are now reassessing their life goals and ambitions, and slinging hash at MacDonald’s is probably not at the top of their choice as a career move. Restaurants are struggling to find workers, but restaurants are also notoriously toxic for employees, along with low pay. We note that this week’s initial claims actually rose to 412 thousand, well above the expected 359 thousand and above last week’s 375 thousand. There remains an unemployment problem that is not going to be easily solved overnight and that could persist even into 2022. So, what is this going to say about the June job numbers due out July 2? At this stage, the market isn’t expecting much.
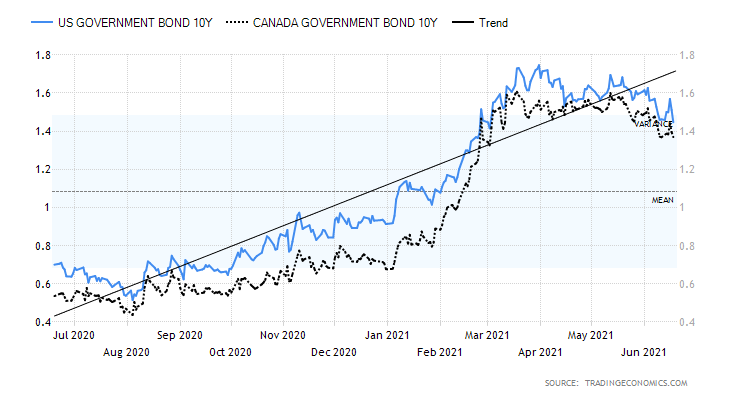
The reality is that any push to normalize rates remains off in the future and by then things could change. Were we surprised that bond yields had actually fallen? At one point the 10-year U.S. treasury note dropped to 1.41% before rebounding after the Fed announcement to rise to the settlement level at 1.45% after hitting as high as 1.57%. So, yes, that is up from last week but still well off the high of 1.74%. Clearly the market doesn’t seem too concerned about inflation. Overall, the Fed’s pronouncements were a bit more hawkish than many had thought. Hence, the stock market sold off, bond yields ticked back up, the U.S. dollar rose, and gold got crushed. Overreaction? Especially for gold? Possibly.
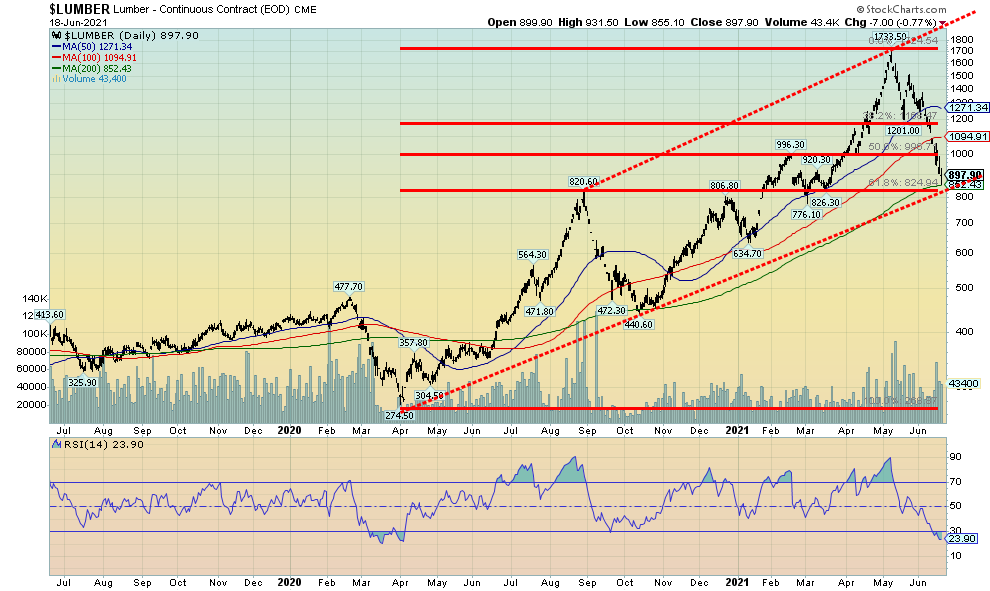
We were amused that Fed Chair Powell compared any coming inflation to lumber prices. Lumber prices soared out of the March 2020 crash low and at their peak were up 530% to record highs. Shortages, bottlenecks, and more were behind the rise. But after rising 530%, lumber prices have since plunged 50%. Now they are up only 250% from the March crash low. The point was that much of this inflation has been caused by bottlenecks and supply shortages, not from rising demand. Once these choke points are eliminated, prices should become more normalized. In other words, this fits with the Fed’s thoughts that the current inflation could be transitory and they won’t be overreacting to it, even if there are some expectations of inflation persisting for the time being.
When you get right down to it, there was nothing in the Fed pronouncements that should have been a surprise. Tapering will be discussed. We’ll monitor the July FOMC meeting and the August Jackson Hole meeting. Markets are awash with cash and people aren’t rushing to borrow. Banks may be choking on cash but the Fed is helping a little by hiking the reverse repo rate and reserve rate slightly. As well, it puts a floor on it and hopefully prevents negative interest rates, something the Fed doesn’t want. The Fed is actually encouraging more debt—odd in a world awash in debt. It keeps zombie corporations alive. The Western world is aging, so demographics along with debt are working against any big inflation. But asset bubbles could continue in stocks, housing, etc. If the U.S. (and Canada) are bad, it’s worse in Japan and the eurozone.
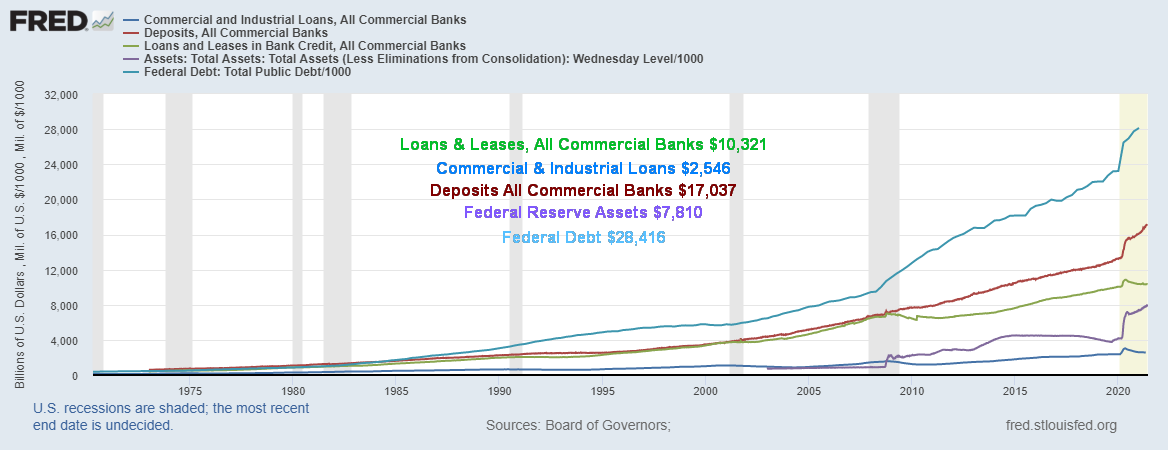
As the chart below shows, loans at banks (commercial loans, bank loans, leases) are actually falling, even as deposits at banks keep rising. Federal debt keeps rising as does the Fed’s balance sheet. The Fed is caught between a rock and hard place. The reality is, they can’t raise interest rates. They could taper but then end the repo program. Federal debt is going to keep on rising. Projections are that the federal debt could reach $40 billion by 2030. Global debt currently at $280 billion could reach $2 quadrillion in the next decade. Astounding. Could the financial system survive that?
Loans Banks, Deposits Banks, Fed Assets, Federal Debt 1970–2021
(Billions of Dollars)
Source: www.stlouisfed.org
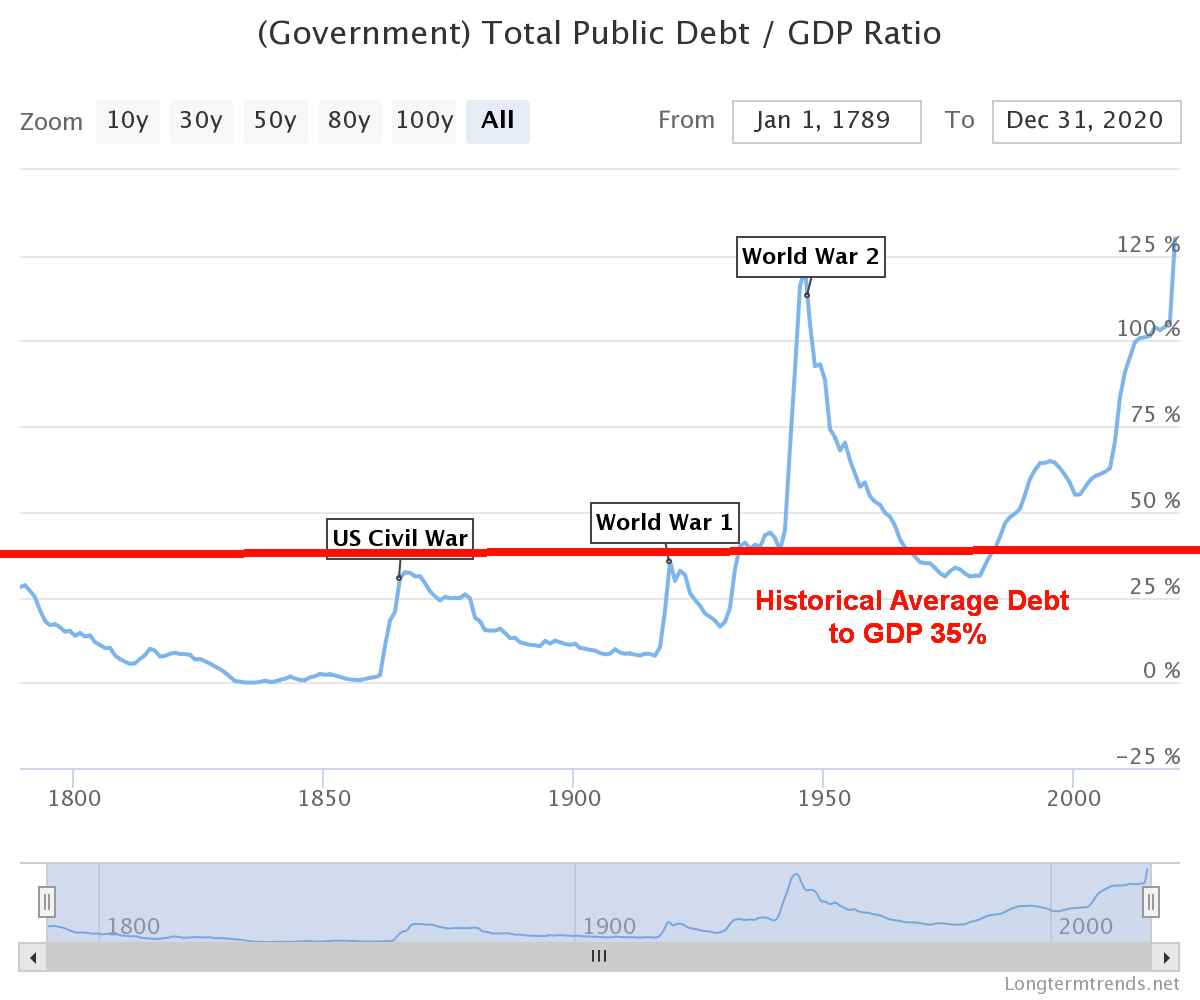
Another chart we are showing below is the long-term trend of U.S. Federal Debt to GDP. The historical average is 35% so at the current 128% it is 93 points above its long-term average. While we have highlighted federal debt, it is noted that the real problem lies with the huge corporate and household debt. The U.S. treasury is a money printing machine. As long as the world’s reserve currency remains the U.S. dollar, the U.S. has the capability of printing more money. But to what end? Corporations and households don’t have the luxury of money printing. Rising inflation makes everyone poorer over time. So today the U.S. and the rest of the Western world are at debt/GDP levels higher than they have ever been even during wartime which is when they usually soar. Is this sustainable? Ultimately, it is major drag on GDP growth and it keeps corporations (and banks – see China and Japan) artificially alive. So, what we face are asset bubbles and massive currency debasement.
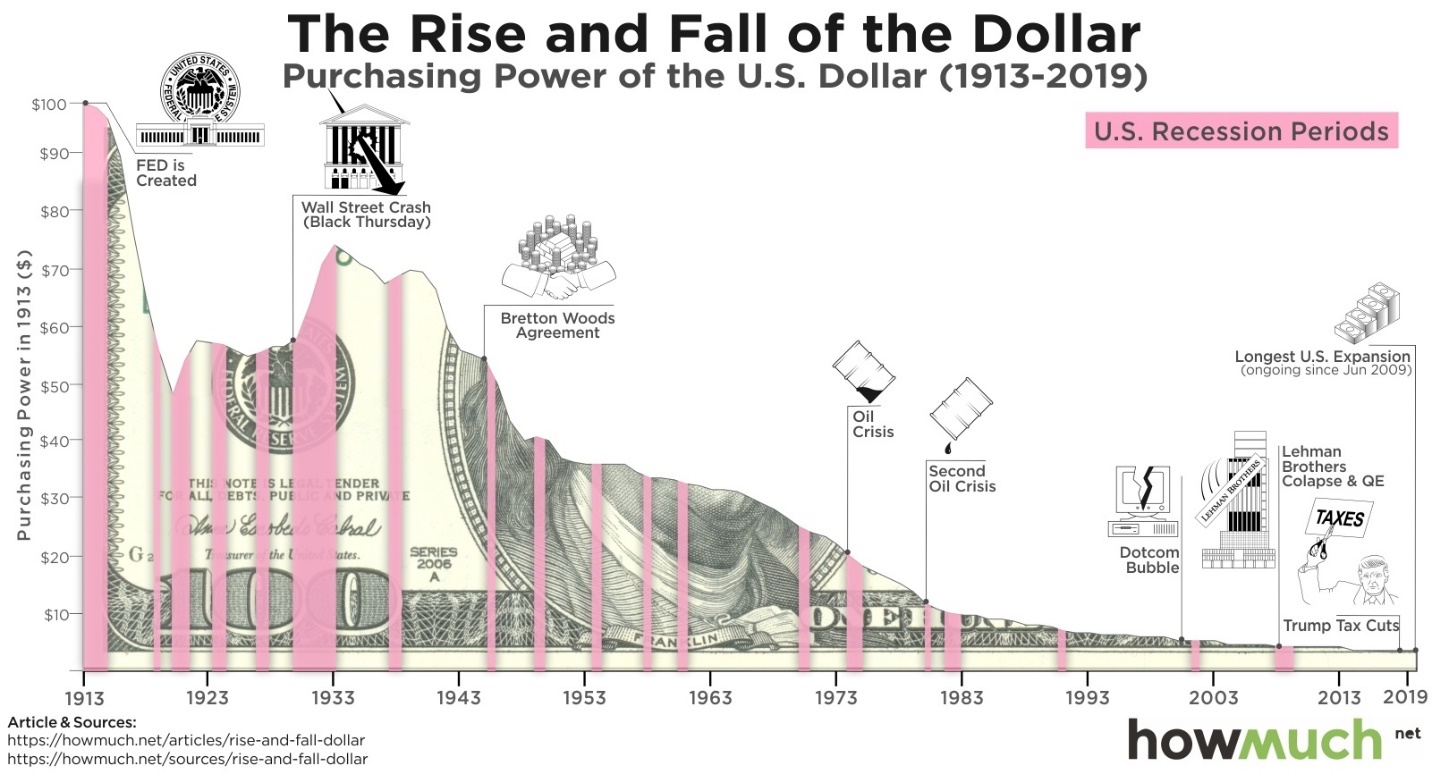
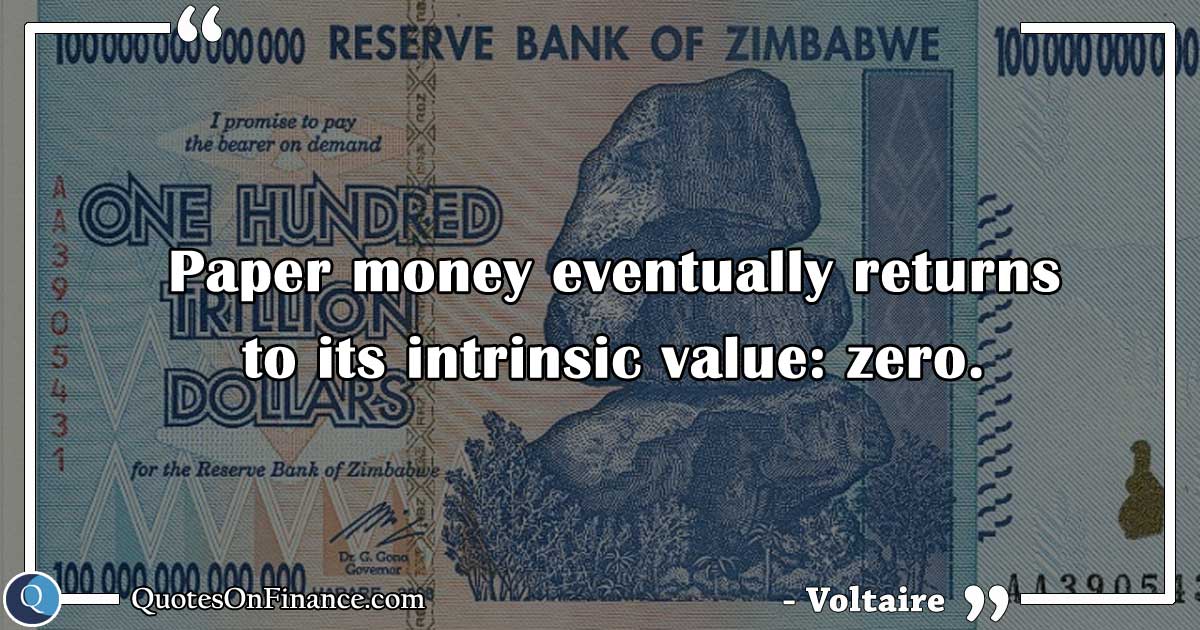
Effectively the two go hand in hand. As debt rises and money is printed, currency debasement follows—meaning, it takes more and more dollars (currency) to purchase the same item. At what point do people no longer accept the U.S. dollar as currency? It is not as if that hasn’t happened before: the collapse of the Roman Empire was also a monetary collapse. And more modern examples are Zimbabwe and Argentina. It can be a long, slow collapse or a sudden one, but as Voltaire said, “paper money eventually returns to its intrinsic value: zero.”
Source: www.longtermtrends.net
Source: www.howmuch.net
Source: www.quotesonfinance.com
The Pandemic Rages On!
The downward trend continues. The 7-day MA for cases has fallen to 362 thousand down from a peak of 825 thousand. Deaths are down to 8,275/day down from almost 14,000/day. In the U.S. the 7-day MA of cases is down to 11,832 from a peak of 251,374. The 7-day average of deaths has fallen to 301 from 3,465. Canada is also improving with the 7-day average of cases down to 1,016 from 8,680 and deaths down to 20 from 163. Brazil continues to be a disaster zone with deaths now surpassing 500 thousand. India is at almost 400 thousand deaths but that is believed to be highly underreported. In terms of cases India is rapidly approaching the U.S. now almost 30 million. But again that number is suspected to be seriously on the low side.
Sunday June 20, 2021 – 14:59 GMT
World
Number of cases: 179,077,031
Number of deaths: 3,877,791
Cases per million: 22,974
Deaths per million: 497.5
U.S.A.
Number of cases: 34,401,840
Number of deaths: 617,091
Cases per million: 103,347
Deaths per million: 1,854
Canada
Number of cases: 1,408,123
Number of deaths: 26,054
Cases per million: 36,996
Deaths per million: 685
Source: www.worldometers.info/coronavirus
Chart of the Week
Source: www.stockcharts.com
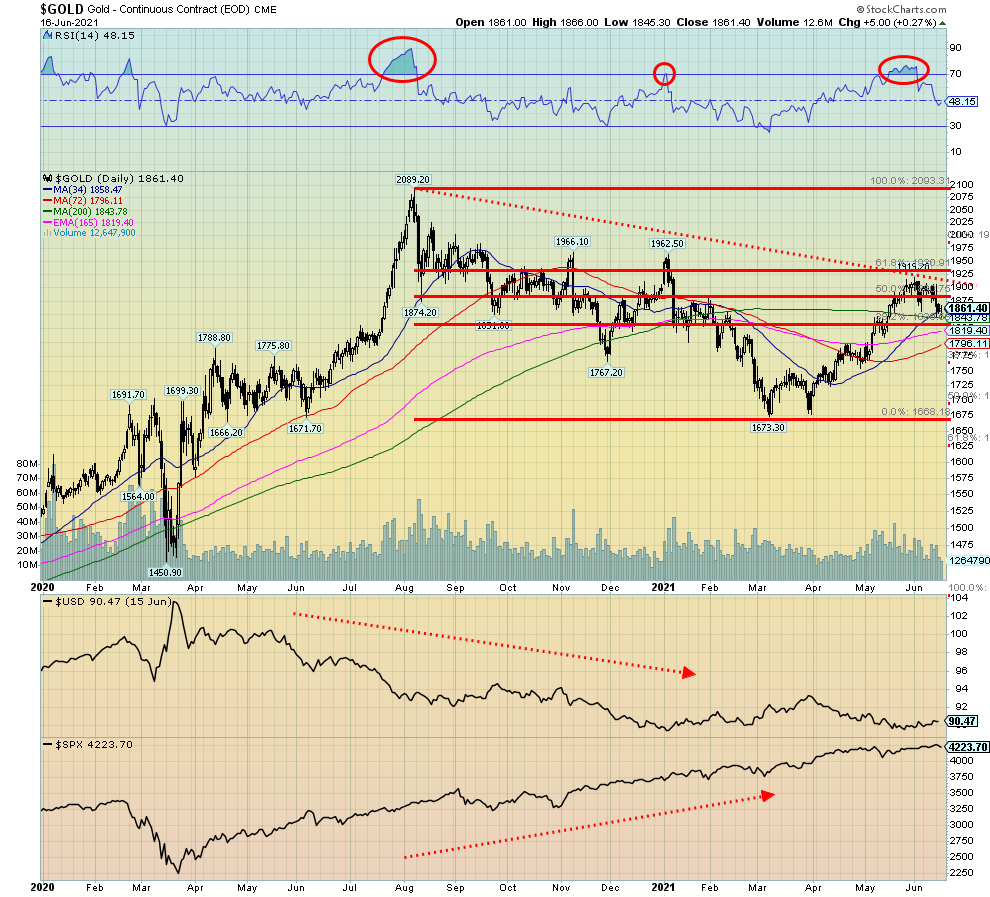
We guess this is a case of “which way next?” We happened to like symmetry and Przemyslaw Radomski noted this in a recent article in Gold-Eagle, “Gold Price Forecast: Bull-Bear Tug O’ War Is On,” (https://www.gold-eagle.com/article/gold-price-forecast-bull-bear-tug-o%E2%80%99-war). This is our take on it. Well worth noting.
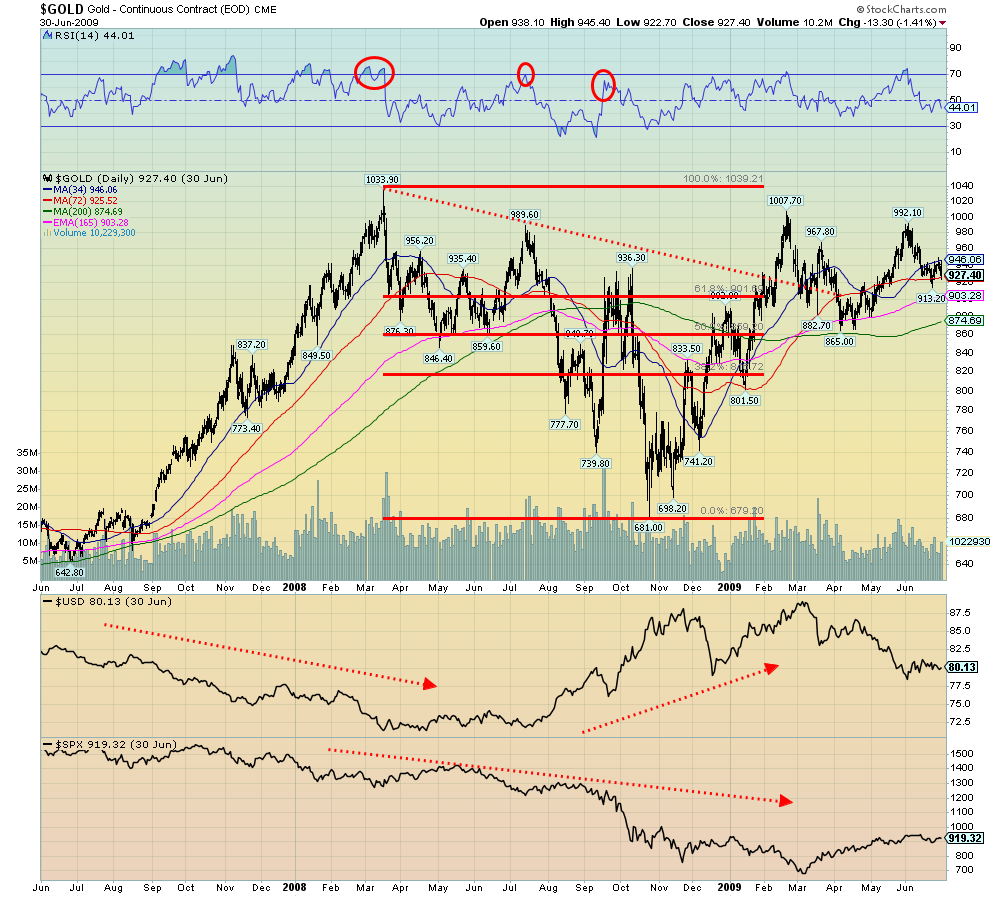
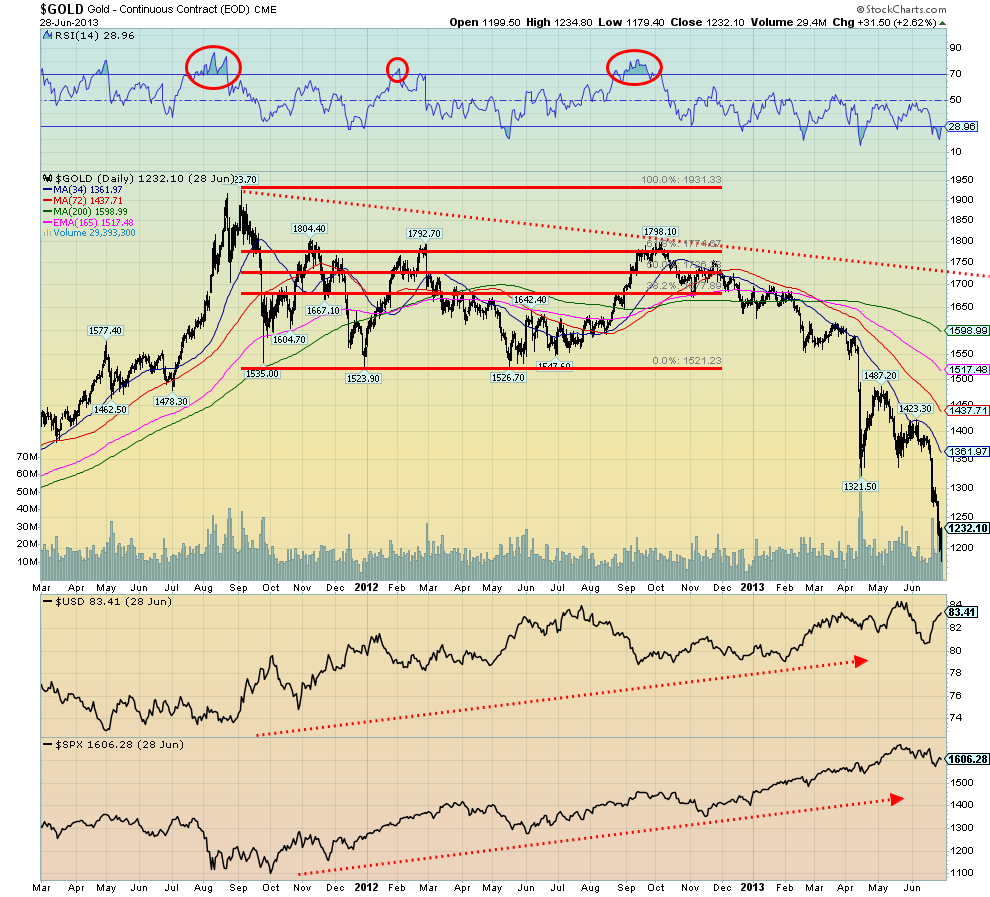
Three charts of gold, all eerily similar. The conclusion to the current market for gold for 2020–2021 is inconclusive, as it is still being written. In 2007–2008 the conclusion was gold broke out to the upside and moved to new all-time highs in 2011. In 2011–2012 the conclusion was the opposite. Gold collapsed into June 2013. So, let’s look at each one.
In the current market, the run from the depths of the March 2020 crash saw gold gain 44%. After topping in August 2020 at $2,089 gold embarked on a corrective down move, losing 15.4% into November 2020 (low $1,767). There followed a nice little rally, topping ironically on January 6, 2021, the day of the attack on Capitol Hill at $1,962. The gain: 11.1%. This was followed by another choppy decline, bottoming on March 8, 2021 at $1,673 for a loss of 14.7%. Then the next rally got underway with an upside reversal. The market then rallied until June 1, 2021 topping out at $1,919. We have now moved into a down mode and, as we noted, we do not know at this time where or when we will bottom. We view $1,790/$1,800 as important support and would prefer not to see gold break that level. The final major support zone is at $1,730. Below that, new lows are possible.
Now, flash back to 2007–2009.
 Source: www.stockcharts.com
We started this rally in June 2007 at $643 as gold ran swiftly to a top in March 2008 at $1,033 with a gain of 60.8%. What followed was a corrective down move that saw gold bottom, first in May 2008 at $846 for a loss of 18.1%. A good rally followed as gold ran up to $990 in mid-July 2008 for a gain of 16.9%. That was followed by another collapse during the crash of 2008 and gold bottomed in September 2008 at $740 for a loss of 25.2%. A swift rally followed, topping quickly in October 2008 at $936 for a gain of 26.6%. Then came the final October 2008 crash and gold bottomed on October 24 at $681, losing 27.3% in a hurry. This is where we are right now. The question, of course, is will we collapse to new lows below $1,673 or will we recover? The 2008 collapse recovered quickly and by February 2009 gold had regained above $1,000 (high was $1007) for a gain of 47.9%. As we know, the October 2008 low proved to be significant and gold went on to make its final top in September 2011 at $1,923 for a total gain of almost 183%. The bulls ultimately won.
Now, let’s look at 2011–2013.
Source: www.stockcharts.com
After making our major top at $1,923 in September 2011, gold had a swift correction, bottoming in December 2011 at $1,524 for a loss of 20.8%. The counter-trend rally took us up to $1,793 by February 2012, topping at $1,792 for a gain of 17.6%. This high was followed by another down move as gold lost 14.8%, making what appeared to be a double bottom at $1,526 in May 2012. The rally got underway and gold ran up again to a high of $1,798 in October. Gain: 17.8%. Gold then started to pull back once again just as we are doing this time. But this time the pullback didn’t stop. During April 12–15, 2013, a period that will live in gold infamy, gold suffered a massive $200 meltdown. The collapse didn’t stop until June 2013 and by that time gold was down 34.4% from the October 2012 high. From the September 2011 high gold fell almost 39%. It was not a happy time for gold bugs. Gold did not make its final low of this bear market until December 2015 at $1,045 for a total loss of about 46%. The gold stocks and silver suffered much more.
Notably, during the 2011–2013 collapse, the US$ Index and the S&P 500 were rising. In 2007–2008, the US$ Index fell initially, then rallied while the S&P 500 was itself in a meltdown. This time around, the S&P 500 has been on a tear to the upside while the US$ Index has, for the most part, been falling even as gold itself declined. While it is not conclusive at this time, the US$ Index has started to rise again. And that is not good for gold. The burning question now is, will this turn into 2013 or will it only see a shallow pullback before another rally gets underway, taking us to new heights à la 2009–2011?
There are similarities among all three charts with a top then down, a rally, then down again, and another rally followed by another decline. Will the current decline turn into a bull or a bear? In 2009 it turned into a bull. 2013 saw the market get ugly and it was a big bear. We are looking for the bull once this pullback concludes. But we are also wary of the bear.
We have often noted the cycles: specifically, gold’s 7.83-year cycle that last bottomed in 2015 and gold’s 23–25-year cycle that last bottomed in 1999–2001. Given gold’s short history of free trading, the 7.83 cycle (some just call it an 8-year cycle) has more than a few observations. However, there has so far only been the one good observation of the 23–25-year cycle. Before that the previous low was in 1976. We know we are due over the next few years for both cycles. The best time frame for the low is somewhere between 2022 to 2024. It could be that the August 2021 high was the final top for the current cycle and, if correct, that could see gold descend in an irregular manner over the next year or two. Potential downside targets could be anywhere between $950 and $1,390. Minimum targets are ironically $1,655, a price level recently almost achieved when gold bottomed at $1,673 in March 2021. Time-wise, however, it was probably too early.
If it is the bull case, we need to find a low and regain above $1,920 before year end. That would support the case for a bull run. The bear case is more complex. A break below $1,730 suggests that the March 2021 low of $1,673 could fall. New lows below $1,673 could confirm to us that the gold bull is over and we are entering a bear market.
MARKETS AND TRENDS
|
|
|
|
% Gains (Losses) Trends
|
|||||
|
|
Close Dec 31/20 |
Close Jun 18/21 |
Week |
YTD |
Daily (Short Term) |
Weekly (Intermediate) |
Monthly (Long Term) |
|
|
Stock Market Indices |
|
|
|
|
|
|
|
|
|
S&P 500 |
3,756.07 |
4,166.45 (new highs) |
(1.9)% |
10.9% |
neutral |
up |
up |
|
|
Dow Jones Industrials |
30,606.48 |
33,290.08 |
(3.5)% |
8.8% |
down |
up |
up |
|
|
Dow Jones Transports |
12,506.93 |
14,622.90 |
(4.6)% |
16.9% |
down |
up |
up |
|
|
NASDAQ |
12,888.28 |
14,030.38 |
(0.3)% |
8.9% |
up |
up |
up |
|
|
S&P/TSX Composite |
17,433.36 |
19,999.45 (new highs) |
(0.7)% |
14.7% |
up |
up |
up |
|
|
S&P/TSX Venture (CDNX) |
875.36 |
946.83 |
(3.4)% |
8.2% |
down (weak) |
up |
up |
|
|
S&P 600 |
1,118.93 |
1,330.67 |
(4.7)% |
18.9% |
down |
up |
up |
|
|
MSCI World Index |
2,140.71 |
2,363.58 (new highs) |
(0.7)% |
10.4% |
up |
up |
up |
|
|
NYSE Bitcoin Index |
28,775.36 |
36,733.58 |
(1.5)% |
27.7% |
down |
neutral |
up |
|
|
|
|
|
|
|
|
|
|
|
|
Gold Mining Stock Indices |
|
|
|
|
|
|
|
|
|
Gold Bugs Index (HUI) |
299.64 |
271.08 |
(11.8)% |
(9.5)% |
down |
down |
up |
|
|
TSX Gold Index (TGD) |
315.29 |
298.50 |
(8.4)% |
(5.3)% |
down |
down (weak) |
up |
|
|
|
|
|
|
|
|
|
|
|
|
Fixed Income Yields/Spreads |
|
|
|
|
|
|
|
|
|
U.S. 10-Year Treasury Bond yield |
0.91 |
1.45% |
(0.7)% |
59.3% |
|
|
|
|
|
Cdn. 10-Year Bond CGB yield |
0.68 |
1.37% |
flat |
101.5% |
|
|
|
|
|
Recession Watch Spreads |
|
|
|
|
|
|
|
|
|
U.S. 2-year 10-year Treasury spread |
0.79 |
1.20% |
(8.4)% |
51.9% |
|
|
|
|
|
Cdn 2-year 10-year CGB spread |
0.48 |
0.91% |
(12.5)% |
89.6% |
|
|
|
|
|
|
|
|
|
|
|
|
|
|
|
Currencies |
|
|
|
|
|
|
|
|
|
US$ Index |
89.89 |
92.21 |
1.8% |
2.6% |
up |
neutral |
down |
|
|
Canadian $ |
0.7830 |
0.8050 |
(2.1)% |
2.8% |
down |
up |
up |
|
|
Euro |
122.39 |
118.63 |
(2.0)% |
(3.1)% |
down |
neutral |
up |
|
|
Swiss Franc |
113.14 |
108.41 |
0.1% |
(1.6)% |
down |
down (weak) |
up |
|
|
British Pound |
136.72 |
138.09 |
(2.2)% |
1.0% |
down |
up |
up |
|
|
Japanese Yen |
96.87 |
90.75 |
(0.5)% |
(6.3)% |
down |
down |
down |
|
|
|
|
|
|
|
|
|
|
|
|
Precious Metals |
|
|
|
|
|
|
|
|
|
Gold |
1,895.10 |
1,769.00 |
(5.9)% |
(6.7)% |
down |
down (weak) |
up |
|
|
Silver |
26.41 |
25.97 |
(7.7)% |
(1.7)% |
up |
up |
up |
|
|
Platinum |
1,079.20 |
1,041.00 |
(9.6)% |
(3.5)% |
down |
neutral |
up |
|
|
|
|
|
|
|
|
|
|
|
|
Base Metals |
|
|
|
|
|
|
|
|
|
Palladium |
2,453.80 |
2,469.90 |
(11.2)% |
0.7% |
down |
up (weak) |
up |
|
|
Copper |
3.52 |
4.16 |
(8.4)% |
18.1% |
down |
up |
up |
|
|
|
|
|
|
|
|
|
|
|
|
Energy |
|
|
|
|
|
|
|
|
|
WTI Oil |
48.52 |
71.29 (new highs) |
0.5% |
46.9% |
up |
up |
up |
|
|
Natural Gas |
2.54 |
3.21 (new highs) |
(2.7)% |
26.4% |
up |
up |
up |
|
Source: www.stockcharts.com, David Chapman
Note: For an explanation of the trends, see the glossary at the end of this article.
New highs/lows refer to new 52-week highs/lows and in some cases all-time highs.
Source: www.stockcharts.com
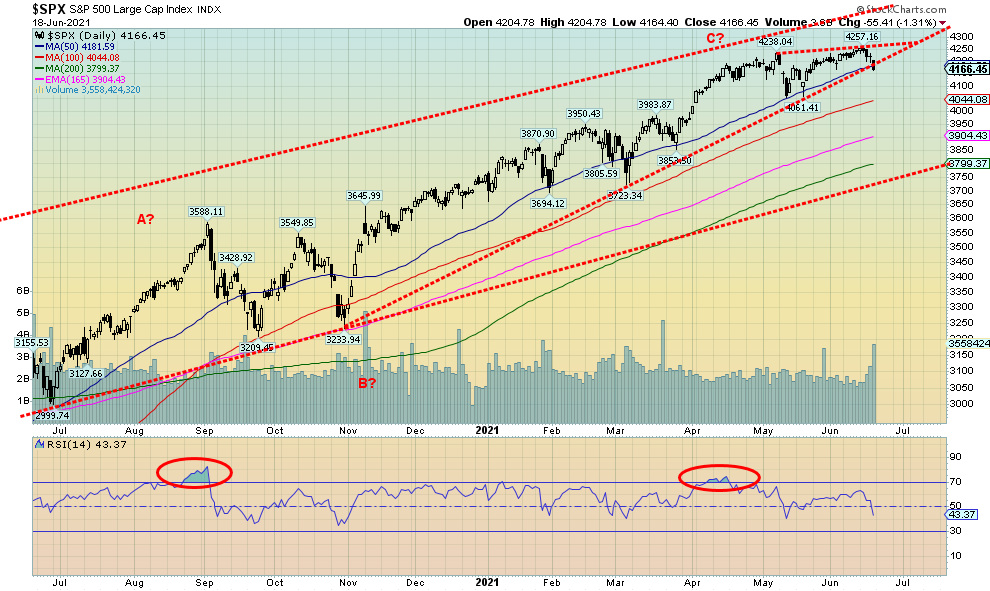
The Fed came and whacked the market. Everyone expected the Fed to discuss tapering while leaving the current regime in place (0%–0.25% interest rates, QE of $120 billion/month). However, the market was caught by surprise. The surprisingly hawkish Fed hinted at interest rate hikes in 2023 and was more sanguine about inflation, with expectations that it might remain high for at least a period of time. As well, it was taper if necessary and things improve. But as we note later, bond yields, after rising initially, turned around and fell, and actually closed lower on the week. Does the bond market know something we don’t know?
This past week the S&P 500 hit another new all-time high (barely), then reversed and closed lower, off 1.9%. It was also an outside week, meaning a higher high and a lower low than the previous week and closing below the previous week’s low. We call that a key reversal. Naturally, even a key reversal needs confirmation. So, we’d look for downside follow-through this coming week. A break of 4,060 would take out the May low and give us another confirmation. The S&P 500 also broke the uptrend line from the October 2020 low, another negative sign. Could it also be a double top? Under 4,060, the potential downside target is at least 3,860 and that’s not far from the 200-day MA near 3,800. Altogether, that would give us a 9.3% decline and fit with our thoughts of a decline of about 10%.
Other indices fared worse, with exceptions. The Dow Jones Industrials (DJI) fell 3.5% and closed below 33,500, indicating to us that there is more downside. The Dow Jones Transportations (DJT) lost 4.6% and appears to us as the weakest of the bunch. But the NASDAQ defied expectations as things perked up for tech stocks, losing only 0.3%. The small cap S&P 600 fell 4.7% and it too looks weak and headed lower. The S&P 500 equal weight index fell 2.7%, underperforming the weighted S&P 500. What that tells us is while small cap stocks perform well in a bull market, they underperform in a bear market.
In the EU, the London FTSE lost 0.8%, the Paris CAC 40 made new all-time highs and held on to an 0.8% gain, but the German DAX also made new all-time highs, then reversed and closed lower, off 1.6%. In Asia, China’s Shanghai Index (SSEC) fell 1.9% and the Tokyo Nikkei Dow (TKN) gained a tiny 0.1%. The TKN appears poised to roll over and fall again as it is making a lower high. Bitcoin soared back to $40,000 after Elon Musk gave headwind to it again, but it lost flight and closed the week lower, down 1.5%. The MSCI World Index made a new all-time high, then reversed and closed down 0.7%. So, a lot of reversals were seen this week and that is not positive.
Indicators were also generally negative. The VIX Volatility Index was up 32% on the week. Put buyers came back a little as the put/call ratio moved from 0.45 to 0.55. However, that is nowhere near tilted to put buyers as it would need to get over 0.80 to suggest that. The S&P 500 Bullish Percent Index (BPSPX) fell to 64.8 down from a peak of 83.40. The NYSE advance/decline line turned down from record territory. The percentage of stocks over their 200-day MA also fell from a very high 94.79 to 88.58. That is still very high. As an interesting aside, the Pro-shares Ultra Vix Short Term Future (UVXY) jumped almost 21% on the week. The UVXY is a leveraged play on increased volatility. Volume was triple what it is normally.
Notably, the DJI closed below its May low. That is another hint that the uptrend is over, at least for the moment. The next downside point for the DJI to break is around 32,070, the March low. As we noted, the S&P 500 broke its uptrend line and the next stop appears to be around 4,000 and breaking the May low of 4,061. Only new highs above 4,260 could change this scenario. The question we have on our mind is: is this a correction to the big up wave from March 2020 or is it the start of something bigger? We believe it’s the former. A minimum objective of a correction would be a decline to around 3,770. That coincides nicely with the 200-day MA, currently at 3,799. After that, we could actually rebound and make once again new all-time highs. But we turn more negative into 2022.
,
Source: www.stockcharts.com
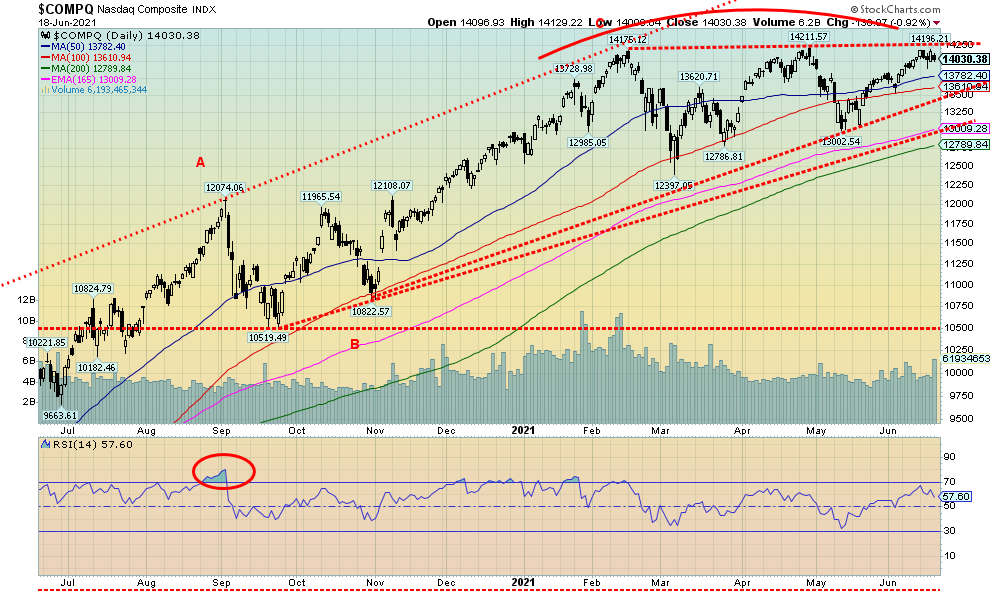
Is tech back in favour? You might think that, given that the NASDAQ was the best performing index of the week, losing only a small 0.3%. We now have what looks eerily like a potential triple top forming. Except we know from experience that triple tops (and bottoms) are actually quite rare. A breakdown under 13,000 would confirm a triple top. A breakdown under 13,500 would suggest that the rally is over as it would break that up trend line. The tech stocks that dominate the NASDAQ had a mixed week. Facebook fell 0.5%, but Apple was up 2.4% and Amazon jumped 4.2%. Netflix gained 2.4% while Google lost 0.1% after making fresh all-time highs. Microsoft gained 0.6%, Tesla was up 2.2%, Twitter +0.6%, Bidu -0.7%, Alibaba +0.3%, and Nvidia +4.6% and making new all-time highs. So, collectively, this group of FAANG stocks were winners. Meanwhile, the ultimate value stock Berkshire Hathaway fell a sharp 4.1% this past week. Triple tops are a rare occurrence and there have been many cases of triple tops that flamed out as the market faked, then ploughed through to new highs. The rising lows give a look as well of an ascending triangle that breaks to new highs. So, we have to watch which way it breaks before jumping to too many conclusions. Under 13,500 appears to start a decline and under 13,000 confirms with implications to fall to 11,700. New highs change all that.
Source: www.stockcharts.com
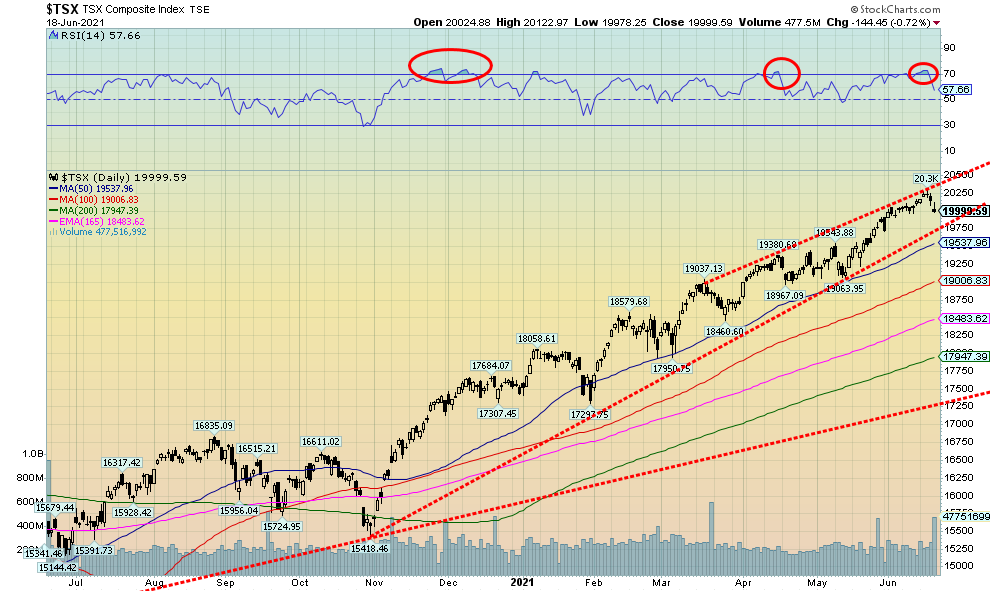
The TSX Composite appeared to be on its way to defying the odds once again, making new all-time highs, when the Fed hit everyone. When the dust cleared, the TSX had fallen 0.7% on the week. For the past week the TSX’s RSI was over 70, indicating overbought conditions. The result was, you knew that a pullback was probably coming; you were just never sure where or how long the conditions would prevail. By the week’s end the RSI had fallen to 58. The uptrend line lies just below at 19,750. A break of that line would send the TSX tumbling to 19,500. The final breakdown point is just above 19,000 as that would take out the May low. Ten of the fourteen TSX sub-indices finished in the red, led by Golds (TGD), down 8.4% and Metals & Mining (TGM), off 8.3%. Other significant losers were Materials (TMT) -7.7% and Health Care (THC) -7.6%. Energy (TEN) dropped 4.7% as the commodity-heavy sub-indices took it on the chin this past week. Saving the day was Information Technology (TKK) the leader, up 7.0%. The TKK also made fresh all-time highs. With the strong performance of technology stocks is it risk on again for them and sell value? It almost seems that way. The Financials (TFS) fell 0.6% after making new all-time highs. Other all-time highs were seen for Energy (TEN), Income Trusts (TCM) +0.8%, and Real Estate (TRE) +0.6%. The small cap TSX Venture Exchange (CDNX) did not have a good week, falling 3.4%. The TSX will, for the most part, continue to follow the U.S. indices. And given that they look vulnerable to lower prices, then the TSX no doubt will follow. New highs could change that.
U.S. 10-year Treasury Bond/Canadian 10-year Government Bond (CGB)
Source: www.tradingeconomics.com, www.home.treasury.gov, www.bankofcanada.ca
We keep asking ourselves that if inflation is such a problem and the Fed is being super-hawkish, then how come bond yields fell instead of going up? When things do the opposite to what you might expect, then we have to question the premise that inflation is going to soar and the Fed’s hawkishness is going to lead to higher interest rates. 2023 is still a good two years away and lot can happen (or not happen) during that time. The bond market is often a leader in terms of direction and will turn before other markets. And right now, the bond market appears to be giving short shrift to inflation and a hawkish Fed. The 10-year U.S. treasury fell to 1.45% this past week and that was after the initial knee jerk reaction following the Fed that took the 10-year to 1.54% first. Maybe it was the higher-than-expected initial claims that came in at 412 thousand when the market only expected 359 thousand. The previous week it was 375 thousand. Earlier in the week housing starts and building permits both came in below expectations, as did retail sales that fell 1.3% in May vs. an expectation of only a 0.3% decline. The NY Empire State Manufacturing Index also disappointed, coming in at 17.4 vs. the expected 23 and last month’s 24.3. So, what if the economy turns out to be weaker than everyone expected and the pace of job recovery is going to continue to be a big disappointment? Not surprisingly, the 2–10 spread which we call the recession spread also narrowed this past week, falling to 1.20%, down from 1.31%. Canada did the same; the 10-year Government of Canada bond (CGB) was unchanged but the 2–10 spread fell to 0.91% from 1.04%. No, the 2–10 spread is nowhere near showing a potential recession below zero, but the drop over the past few weeks is questioning the strength of the recovery.
M1, M2 and the Monetary Base – 1960-2021
Source: www.stlouisfed.org
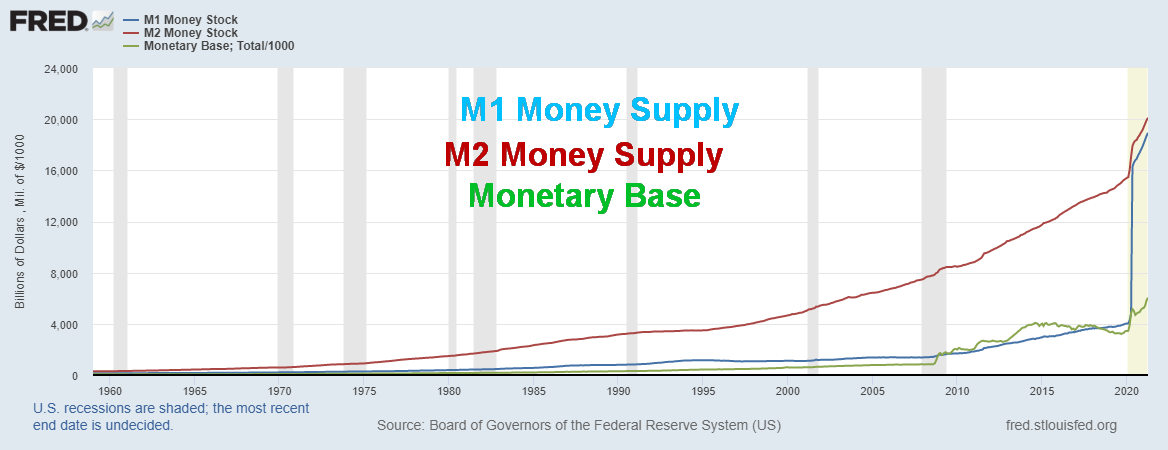
The exploding money supply! Astounding. If there is a problem it is in the sudden massive growth of money since the pandemic got underway. M1 money supply (aka narrow money – coins, notes in circulation, chequing accounts and other deposit accounts easily converted to cash) is the most astounding up 368% since March 2020. At $19,100.1 billion it is almost as big as M2 (M1 plus short-term time deposits and some money market funds) is up only 34% to $20,706.4 billion. There is also M0 which is the most liquid definition of money supply. M0 is M1 without the deposits and can also include central banks cash. The monetary base (includes notes and coins and commercial bank deposits at the central bank) is also up sharply 75% since March 2020 to $6,042.1 billion. The Fed’s balance sheet has also exploded upward by 94% to $8,064.3 billion.
Too much money floating around is not necessarily a good thing. It debases the currency and sparks inflation. Or specifically asset inflation – houses, stocks, antique cars, art, coins – whatever can be bought. Leonardo da Vinci’s painting of the Salvador Mundi last sold in 2017 for a mind boggling $450.3 million. What could it go for now? Possibly double that again? Too much money chasing too few goods.
Notice how money supply has increased exponentially since the world went off the gold standard in August 1971. There is a direct correlation. Money is just pieces of paper backed by nothing except a government saying this is what it’s worth. Fiat money. Might as well use monopoly money. How does it all end? See Zimbabwe or the Weimer Republic. Naturally we don’t know that but what we do know is that the current pace of money creation is unsustainable without consequences. To back at least the monetary base with gold thus making money worth something would require the price of gold to be $22,330 a far cry from the current price of $1,769. But then any form of a gold standard would constrain central banks and banks from money creation due to the limited supply of gold.
Source: www.stockcharts.com
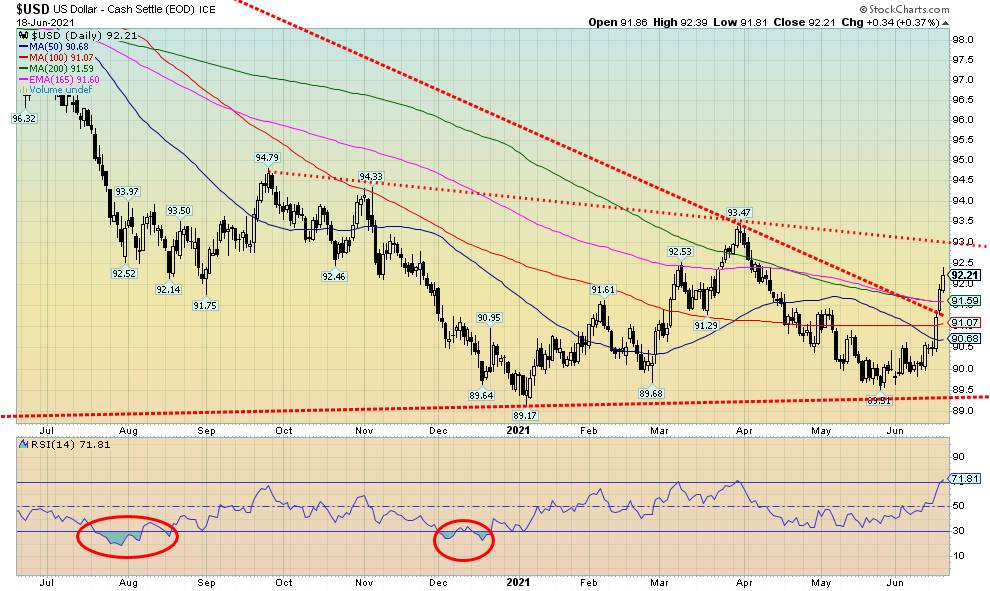
Thanks to the hawkish Fed, the US$ Index has broken out of the long downtrend line from the March 2020 spike high. We also now raise the potential for a double bottom forming with the 89.17 low in January 2021 and the 89.51 low in May 2021. The neckline is currently around 93 and a firm breakout over that level could project the US$ Index up to 98.60. Above 93.50 the double bottom breakout would be confirmed. A sharply rising US$ Index would have negative ramifications for a host of commodities priced in U.S. dollars, particularly gold and silver. This past week the US$ Index rose 1.8%. The currencies were all hit. The euro dropped 2.1%, the Swiss franc was off 2.6%, the pound sterling was down 2.2%, and the Japanese yen dropped 0.5%. The Canadian dollar broke uptrend support, falling 2.1%. Trends turned from up to down in a hurry. The move since the January 6 low at 89.17 all appears to be a corrective and not an impulse wave to the upside. As a result, we don’t wish to jump to quick conclusions that the US$ Index will break firmly above 93. However, we cannot dismiss the possibility, at least until we break back under 90.50.
Source: www.stockcharts.com
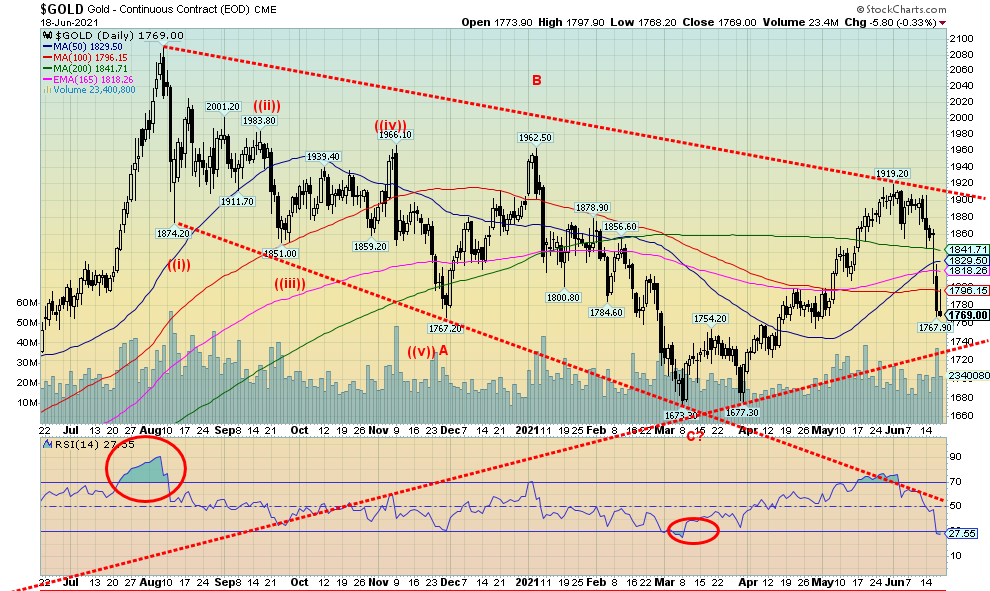
It was an “ouch” week for gold, silver, and the gold stocks. Gold’s shine was seriously tarnished following the hawkish Fed. On the week gold fell 5.9% while silver dropped 7.7%. Platinum was hit hard, down 9.6% and palladium suffered a big setback, falling 11.2%. Copper wasn’t spared either, falling 8.4%. The gold stocks tumbled with the Gold Bugs Index (HUI) down 11.8% and the TSX Gold Index (TGD) off 8.4%. So, is that it? Gold has topped? We raised the possibility that the $2,089 high of August 2020 may be it: the final high and crest of the 7.83 cycle and the 23–25-year cycle. It cannot be ruled out. Note that lower line. That line was drawn up from a low in May 2019 that connects up the March 2020 low and then the low in March 2021. So, the line is significant. The line currently lies around $1,740. So as long as we can hold above $1,730/$1,740 then we stand a chance of regrouping and returning to the upside. The action since the high of August 2020 continues to appear to us as corrective and not a potential impulse wave to the downside. However, that does not eliminate the fact that the decline this past week has probably spooked a number of traders. Yes, the Fed was more hawkish than expected. But if numbers over the following months continue to show that the economy isn’t as robust as many would like it to be, that could refocus things and everyone will realize that the Fed is trapped into its ongoing QE program, currently $120 billion/month. Moves in the gold market can be exaggerated as it is dominated by paper gold (i.e., futures). Leverage in the gold market is somewhere around at least 20:1. Compare that to the stock market where it is generally 0.5:1 or maybe 0.7:1. So when things turn quickly to the downside there is a mad scramble to bail to avoid having to put up more margin. Whether it is bullion banks involved or not is moot. It doesn’t take much to make the market move very sharply, very quickly.
We don’t have the Commitment of Traders (COT) report to muse over this week as it was put off to Monday, June 21 because of the Federal holiday declared for Juneteenth and taken on Friday the 18th of June. While we’ll see that Monday, we won’t see the result of this week’s sharp decline and whether positions were covered or not until next Friday’s June 25 report. The bottom line is, we do not want to see gold close below that line, currently near $1,740. The point of no return is at $1,730 so it emphasizes that entire zone. Below $1,730 new lows below $1,673 become probable. Everything got “whacked” this week, but as the saying goes, it’s not over until the fat lady sings. The fat lady sings under $1,730. Note the RSI has fallen to 27.55 below our 30 threshold that often indicates oversold conditions. Note how the RSI fell under 30 as well at the $1,673 low in March 2021. So that gives us some hope here that this coming week could see some consolidation and maybe even a bounce. But we won’t just turn around and shoot up from here. No doubt there will be many who want to get out on the bounce. We’ll feel more comfortable when we start closing over $1,840, but we really need to regain $1,900 once again to end thoughts of a downward collapse at this time. Nobody should be complacent and, as the saying goes, you can’t go broke taking a profit. As well, you can always get back in even if it is a slightly higher price, but getting out in a downward trending market is often difficult. Panic selling usually just exacerbates the sell-off.
Still, while the drop this week wasn’t as dramatic, it did bring painful memories of April 12–15, 2013 when gold collapsed in a massive wave, selling down over $200. That marked the $1,923 high in September 2011 as the high for practically the next decade until we broke that in June/July 2020. Silver, notably, is nowhere near its 2011 high, nor for that matter its 1980 high near $50. The gold stock indices are also well off their 2011 high. The HUI is still down 57% from that high while the TGD remains down 35%. At the August 2020 high the TGD was at that point down only 8% from the 2011 high. That gold made new all-time highs in the prior move while silver and the gold stock indices did not remains a potentially significant divergence. It implies that gold’s price is wrong and that eventually gold will collapse once again. It also implies the opposite that eventually silver and the gold stocks will catch up and they too will eventually move to new highs.
We are cautious here, but hopeful that what we have been seeing since August 2020 is a corrective move and not a setup for a more dangerous collapse. However, respect the $1,730/$1,740 line in the sand.
Source: www.stockcharts.com
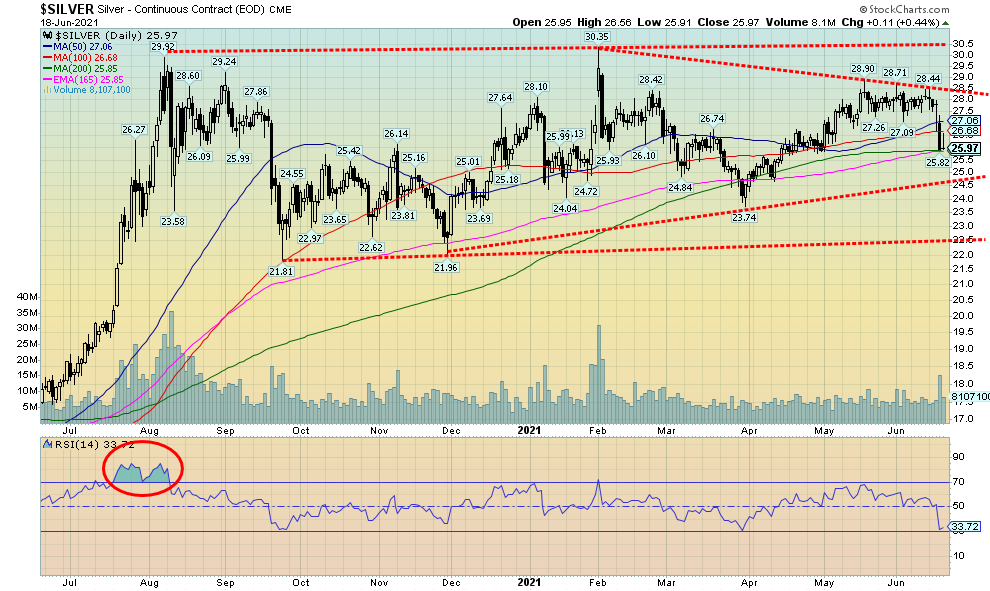
While silver had an unpleasant week along with all commodities to some extent, the silver uptrend remains intact. Silver fell 7.7% this past week, putting into doubt the potential to seek new highs above $30. So, it leaves some ambiguity and doubt about what the next move might be. We continue to view the action since August 2020 as the formation of a large triangle that, if correct, should break to the upside as that is normally what these triangles do. However, the breakdown this past week does throw a bit of doubt into that scenario. As long as we hold above $25 the damage should be limited. A breakdown now under $25 would suggest the potential for new lows below that November 2020 low of $21.96. Under $24 new lows become highly probable. However, silver has a lot of work to do to regain confidence. Regaining above $28.50 would suggest that the current pullback correction is over and we could then refocus on the upside. Even a move back over $27 could be viewed positively. So far, silver is holding at the 200-day MA and the uptrend line is, as noted below, near $25. While we remain positive that the next move will be up, we are cautious and wary of the downside until this current pullback runs its course.
Source: www.stockcharts.com
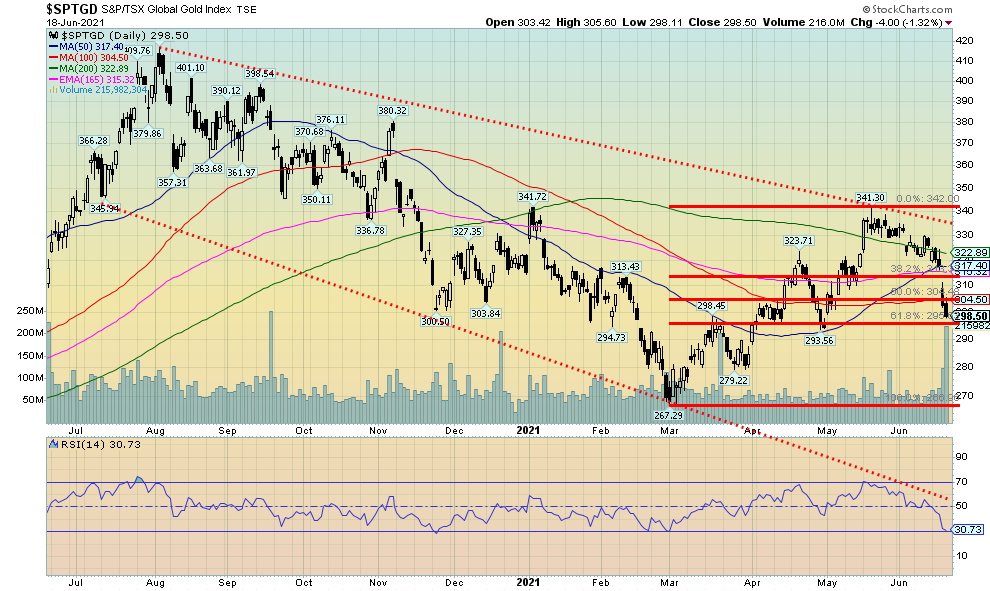
A most unpleasant week for the gold stocks. The TSX Gold Index (TGD) fell 8.4% while the Gold Bugs Index (HUI) was hit harder, down 11.8%. Most of the decline occurred following the Fed. Volume was the highest seen in weeks on the descent. The gold market is quite small, so any sustained selling (or buying) can and does cause exaggerated moves. We suspect as well that margin calls exacerbated the down move. That’s the bad news. The good news is the RSI has fallen to 30, suggesting that the market has become quickly oversold. Still, that hasn’t stopped both the daily and weekly (intermediate) trends to have turned down. We have fallen into an area of support that ranges down to 290/295. There is a gap now between 310 and 317 that needs to be filled. However, we wouldn’t be able to start to confirm that the down move is over until the TGD has at least regained 325. The breakout line is just above there at 335. So far, the TGD is showing that the 200-day MA (323) is a bit of a barrier as it failed to gain any strong traction once it cleared the key MA. To the downside, our point of no return is under 284. Below that level new lows below 267 are possible.
Source: www.stockcharts.com
Quite the rise followed by quite the tumble. Lumber has been the big commodity star. Now it is not looking too good. After a 530% rise out of the March 2020 crash low, lumber has now tumbled almost 50% from that high. But at minimum a bounce could soon develop. The RSI is at 24, a level as low as was seen back in March 2020. Lumber has retraced to the Fibonacci 61.8% level. And lumber is now very close to support of the 200-day MA along with the uptrend line from the March 2020 low. Despite what really constitutes a crash in lumber prices, any improvement in retail/wholesale lumber is not likely to be seen right away as current inventories are depleted. Nonetheless, the fall has to be welcomed and could help put a damper on all the inflation talk. Any rebound in prices is likely to cap out around $1,000.
Source: www.stockcharts.com
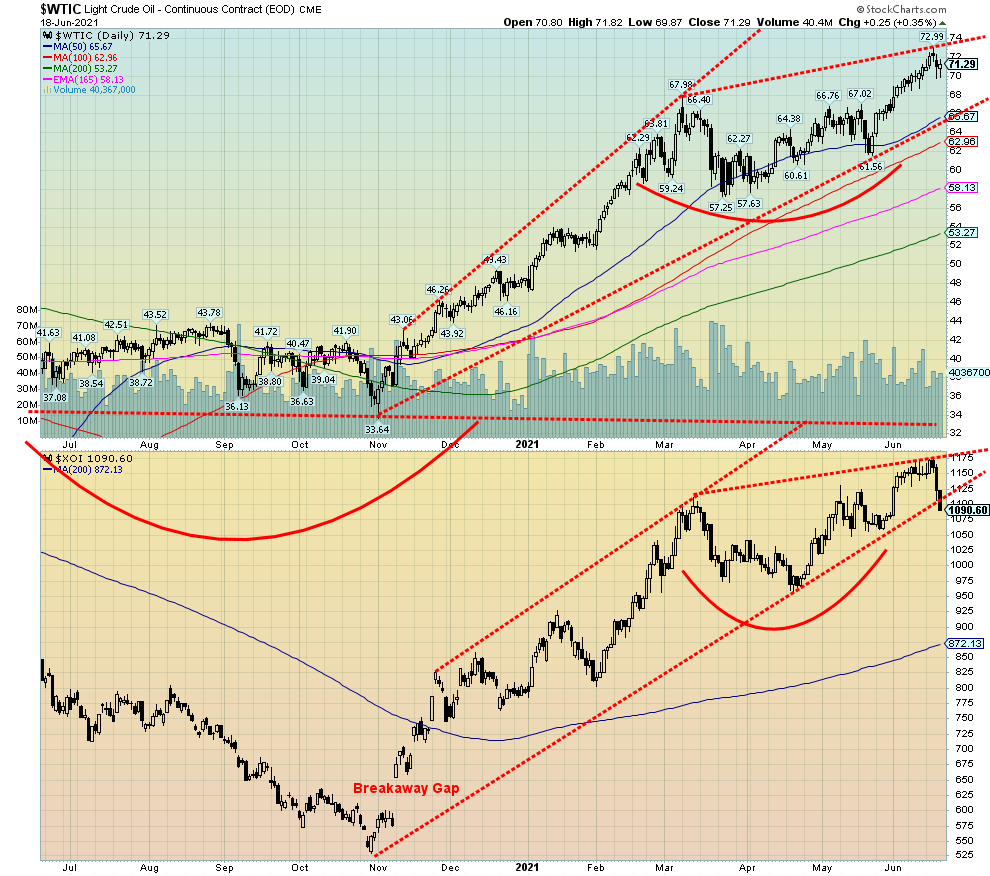
One has to wonder whether the oil rally, like other commodity rallies, is coming to an end. Yes, WTI oil gained 0.5% this past week but closed down roughly $1.50 or 2.3% from its 52-week high. It was the only success for the energy sector as natural gas (NG) fell 2.7%, and the energy stocks were hit as the ARCA Oil & Gas Index (XOI) fell 5.1% and the TSX Energy Index (TEN) dropped 4.7%. All three—NG, XOI, and TEN—had earlier made fresh 52-week highs during the week before turning south at the end of the week. The higher U.S. dollar sparked by the Fed’s ramblings about interest rate hikes and tapering impacted the energy sector just as it did the same for the precious metals and other commodities. Commodities are all priced in U.S. dollars and a higher U.S. dollar makes all commodities more expensive in foreign currencies. That in turn could lead to decreased demand.
Still, that didn’t stop some forecasts from still beating the mantra that $100 oil is possible. We read that there has been a lack of new investment in drilling and that in turn could lead to production issues down the road without new production coming on stream.
The steep uptrend for WTI oil might end but there is considerable support down to just under $66. However, a break under $65 could trigger a decline towards $63 and even down to $60. Since WTI oil started rallying back in November 2020, the rise has been persistent with only the consolidation between February and May. For the moment, at least, resistance is at the recent high of $73. The consolidation period seemed to imply a potential rally up to around $78/$79 so the current high of $73 only took us part way there. A break now under $62 would confirm that a high is in.
Copyright David Chapman, 2021
|
Charts and commentary by David Chapman Chief Strategist, Enriched Investing Inc. Phone: 416-523-5454 Email: david@davidchapman.com dchapman@enrichedinvesting.com Twitter: @Davcha12 June 21, 2021 |
Disclaimer
|
GLOSSARY Trends Daily – Short-term trend (For swing traders) Weekly – Intermediate-term trend (For long-term trend followers) Monthly – Long-term secular trend (For long-term trend followers) Up – The trend is up. Down – The trend is down Neutral – Indicators are mostly neutral. A trend change might be in the offing. Weak – The trend is still up or down but it is weakening. It is also a sign that the trend might change. Topping – Indicators are suggesting that while the trend remains up there are considerable signs that suggest that the market is topping. Bottoming – Indicators are suggesting that while the trend is down there are considerable signs that suggest that the market is bottoming.
|
David Chapman is not a registered advisory service and is not an exempt market dealer (EMD) nor a licensed financial advisor. We do not and cannot give individualised market advice. David Chapman has worked in the financial industry for over 40 years including large financial corporations, banks, and investment dealers. The information in this newsletter is intended only for informational and educational purposes. It should not be considered a solicitation of an offer or sale of any security. Every effort is made to provide accurate and complete information. However, we cannot guarantee that there will be no errors. We make no claims, promises or guarantees about the accuracy, completeness, or adequacy of the contents of this commentary and expressly disclaim liability for errors and omissions in the contents of this commentary. David Chapman will always use his best efforts to ensure the accuracy and timeliness of all information. The reader assumes all risk when trading in securities and David Chapman advises consulting a licensed professional financial advisor before proceeding with any trade or idea presented in this newsletter. David Chapman may own shares in companies mentioned in this newsletter. We share our ideas and opinions for informational and educational purposes only and expect the reader to perform due diligence before considering a position in any security. That includes consulting with your own licensed professional financial advisor.


