
Events have overtaken what we had prepared this past weekend. The question that is left on our mind is what will be the market reaction? We distribute prior to markets fully opening on Sunday evening and Monday morning. Our best assessment is that the reaction might not be good particularly since we have been witnessing numerous signs over the past few weeks that markets have been frothy and the number of negative divergences have been growing. But could it become a full-out panic? And how might gold, a safe haven, respond? Our conclusion from the attempted assassination of former president Donald Trump highlights the sharp political divisions that exist today not just in the U.S. but elsewhere as well. We live in dangerous times.
Following our week away in Ontario's near north we cover last week's job report. As usual, its apparent strength is questionable when one looks underneath. Inflation we note inevitably leads to higher unemployment but there is always a lag. Finally, the inverted yield is beginning to normalize signaling to us that we are getting closer to a recession. Marginally better inflation numbers once again has led to speculation that the Fed will cut rates by September.
Our chart of the week reexamines the gold/silver ratio. Here we are seeing signs that the ratio may have topped. But it hasn't broken down, yet. Silver has tendency to lead both in up and down markets and for far too long the ratio has generally favoured gold over silver. The same could be said about the gold stocks and this past week we saw the gold stocks put in a good up week even as both gold and silver were decidedly mixed. The gold stock indices along with more than a few individual stocks made 52-week highs. For example, Lundin Gold Inc. reported increased production and eliminated debt, pays a dividend, and is held in the Enriched Capital Conservative Growth Strategy.* Oil too languishes below a clear breakout but continues to show signs that it should break out to higher prices.
It was a week once again of all-time highs but last Thursday, July 11 the markets along with a number of MAG 7 stocks once again made all-time highs then reversed sharply to the downside putting in what we call a key reversal day. What is needed is follow through to the downside to confirm. Are the weekend events the catalyst to lower prices? The upcoming conventions - Republicans next week July 15-18 and Democrats Aug 19-22 ought to be interesting. -
We are back with a full report and follow up with our analysis of the stock markets, bond markets, currencies and the precious metals and energy.
Much of the world is experiencing a heat wave and in many countries it is extreme with temperatures between 40C and 50C (104F-122F) and sometimes even higher. Temperatures that high are killers and thousands have died as a result. We in more northerly regions can be thankful even as 30C (86F) is not low either. Irrespective it helps spawn deadly hurricanes along with extreme flooding and as well deadly wildfires.
As my friend Jack says "be careful out there". Have a good week!
DC
* Reference to the Enriched Capital Conservative Growth Strategy and its investments, celebrating a 5-year history of strong growth, is added by Margaret Samuel, President, CEO and Portfolio Manager of Enriched Investing Incorporated, who can be reached at 416-203-3028 or msamuel@enrichedinvesting.com
“We pay the debts of the last generation by issuing bonds payable by the next generation.”
—Lawrence J. Peter, Canadian educator and “hierarchiologist”, best known for The Peter Principle (1969); 1919–1990
“Regardless of current economic conditions, it’s always best to remember that the stock market is a barometer, not a thermometer.”
—Yale Hirsch, American author, founder of the Hirsch Foundation and creator of The Stock Trader’s Almanac (1968–); 1923–1921
“The problem with the world is that the intelligent people are full of doubts, while the stupid ones are full of confidence.”
—Charles Bukowski, German-American poet, novelist, short story writer, author of underground column called Notes of a Dirty Old Man in Open City where the FBI kept a file on him, author of Barfly (1980); 1920–1994
Spending a week in Ontario’s near north helps clear the mind. We say near north as we were on the French River or Wemitigoj-Sibi in the Ojibwe language, known as one of the routes of the voyageurs. It was a common route for the fur trade from around 1600 to 1820 and was part of the water highway from Montreal—up the Ottawa River, across to Lake Nipissing, then along the French River to Lake Huron, the second largest Great Lake. It’s north of Muskoka (also known as Ontario’s Hamptons because of the number of celebrities who have cottages there) but south of Sudbury and Northern Ontario. It’s a land of trees, rocks, and one of the largest concentration of lakes and rivers in the world. It’s all a part of the watershed of the Great Lakes.
While internet was available, it could be unreliable at times. Nonetheless, we peeked at market levels while there and especially at last Friday’s job numbers that came out in both Canada and the U.S. Yes, the job numbers that we wait for every month, seeking clues as to whether the economy is slowing or not. The U.S. nonfarm payrolls didn’t exactly surprise as they came in at 206,000, slightly above the expected 190,000 and down from the revised downward previous month’s 218,000.
The unemployment rate U3 rose to 4.1% from 4.0%, but the other measures of unemployment saw the U6 rate unchanged at 7.4% and Shadow Stats (www.shadowstats.com) also unchanged at 26%. One reason Shadow Stats is so high is that it includes all those considered not in the labour force and long-term unemployment after changes to how the unemployed are counted that was changed in 1994. The number not in the labour force actually fell 1,241,000 in June. Maybe they retired? But even with that, the civilian labour force rose only 277,000. Also, to no one’s surprise, the number of full-time jobs fell 28,000 while the number of part-time jobs rose 50,000.
As a result of all this, the labour force participation rate rose to 62.6% from 62.5%. A higher labour force participation rate helps raise the unemployment rate U3. So, all this indicated an incremental slowing of the economy but nowhere near what one would term a recession. Canada, too, reported disappointing job numbers as they actually lost 1,400 jobs, well below the expected gain of 15,000 jobs. The unemployment rate rose to 6.4%, above the expected 6.2%. As in the U.S., Canada lost full-time jobs and gained part-time jobs. Good-paying jobs with benefits were lost to poorer-paying jobs with little or no benefits.
U.S. Employed Persons – Rolling Over
U.S. Unemployed Persons – Slowly Rising
2014–2024
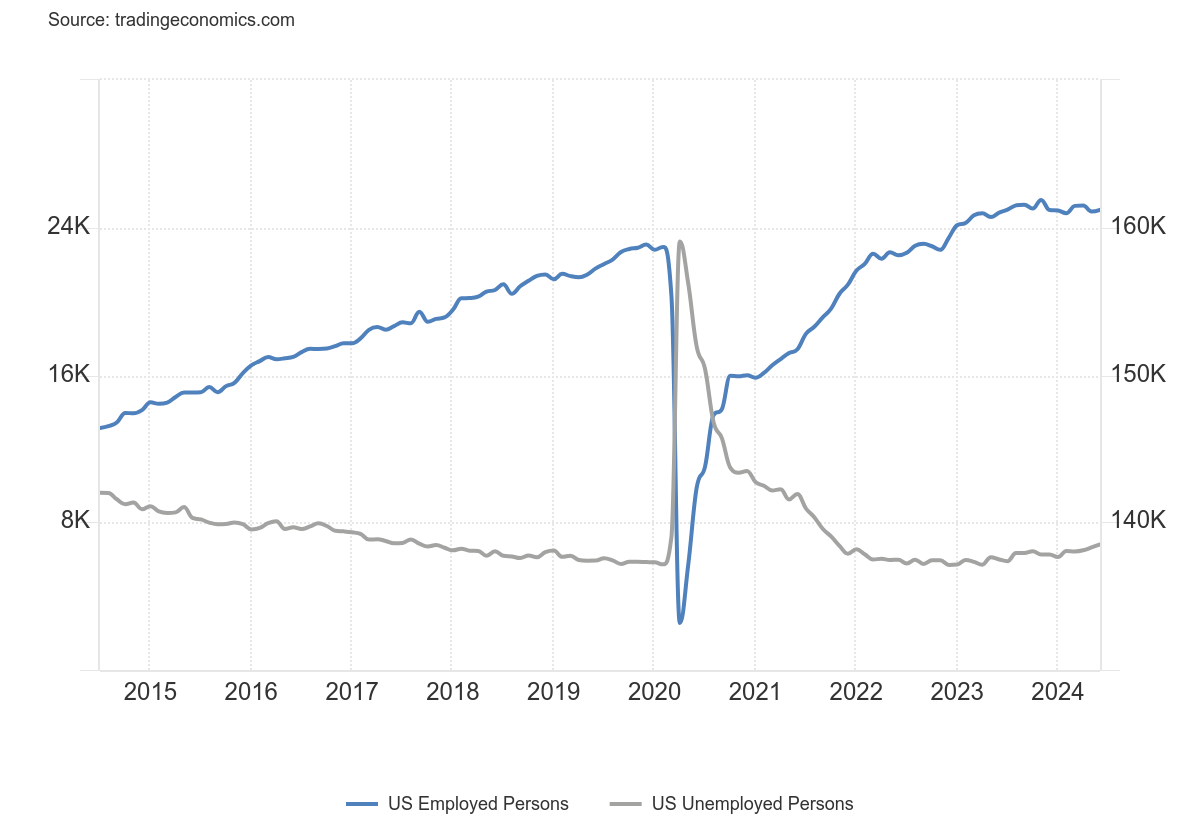
Source: www.tradingeconomics.com, www.bls.gov
One thing that has struck us is that the number of employed persons is up only about two million since February 2020, the month before the pandemic struck. That’s a 1.3% increase. Yet the population level, meaning all those 16 years of age and over and eligible for the labour force rose 8.8 million, a 3.4% increase. The civilian labour force rose 3.6 million or 2.2%. Retirees would count for part of the difference as that group rose 1.9 million or 3.2%. So, the question begs: where did everyone else go? School perhaps? The number of those considered not in the labour force rose 5.2 million or 5.5%. What that tells us is that more people are unemployed for longer periods of time. Shadow Stats unemployed, that takes all that into consideration, saw its unemployment rate go from 21.3% in February 2020 to 26% today. For the record, Canada saw the number of employed persons rise 6.8% in the same period or about the same growth as its population, thus outpacing the U.S. in terms of job growth.
Inflation Leads to Higher Unemployment 1948–2024
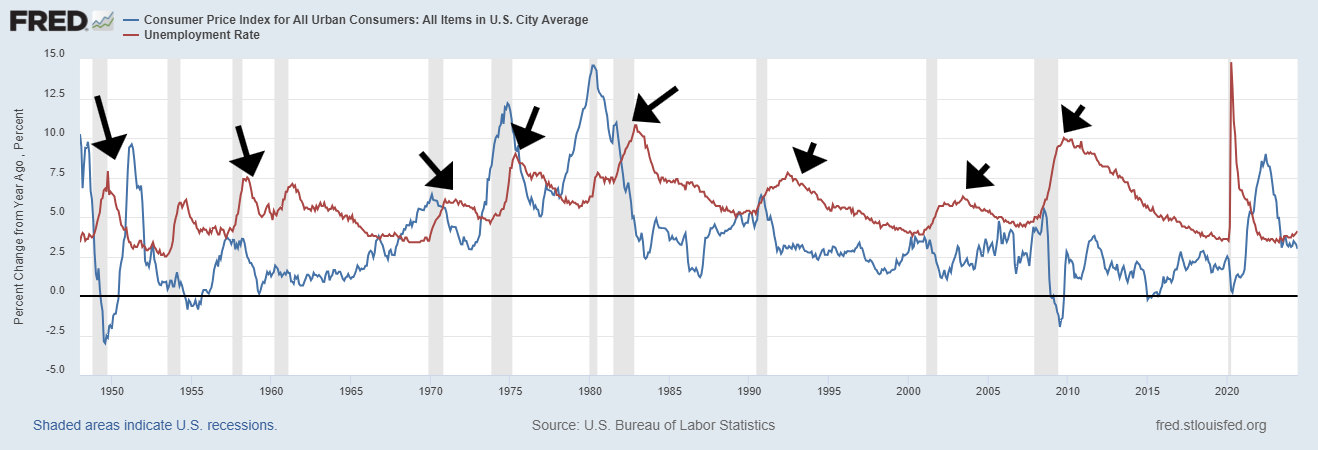
Source: www.stlouisfed.org
Another thing that caught our attention is that higher inflation appears to lead to higher unemployment. Our chart above shows year-over-year inflation in blue and the unemployment rate in red. With one exception, every rise in the inflation rate saw the unemployment rate rise after inflation rose. Naturally, there was a lag between inflation peaking and unemployment peaking. The exception was the pandemic year as inflation did not go up much before the pandemic hit. On average, the lag was 21 months between a peak in inflation and a peak in unemployment. However, the range was 7 months to 40 months. If averages hold, unemployment was due to peak by February 2024. That didn’t happen so we have to look at the longest range, which could take us to October 2026 before unemployment peaks. Unemployment bottomed only recently and now we are over 4% once again and the downtrend has been broken. All that suggests that unemployment has only one way to go—up.
A favourite recession sign is the inverted yield curve. As we have noted before, we’ve never seen such a prolonged period of an inverted yield curve. However, it is now beginning to normalize. It is when the yield curve normalizes that a recession typically gets underway. But, as the chart shows, we are still nowhere near normalization. The 2-year–10-year spread is down to negative (or is it up to?) 28 bp after peaking at negative 1.17 back in 2023. The 3-month–10-year spread is now negative 115 bp. up from a peak bottom of negative 197 bp, also back in 2023. Yes, we still have a way to go. but a normalized yield curve has often signaled the start of the recession, not the end of it. Given the length of time we’ve been in the
throes of an inverted yield curve, we are potentially looking for a deeper and even longer recession. The signs are certainly there.
U.S. 3-month–10-year spread, U.S. 2-year–10-year spread 1976–2024
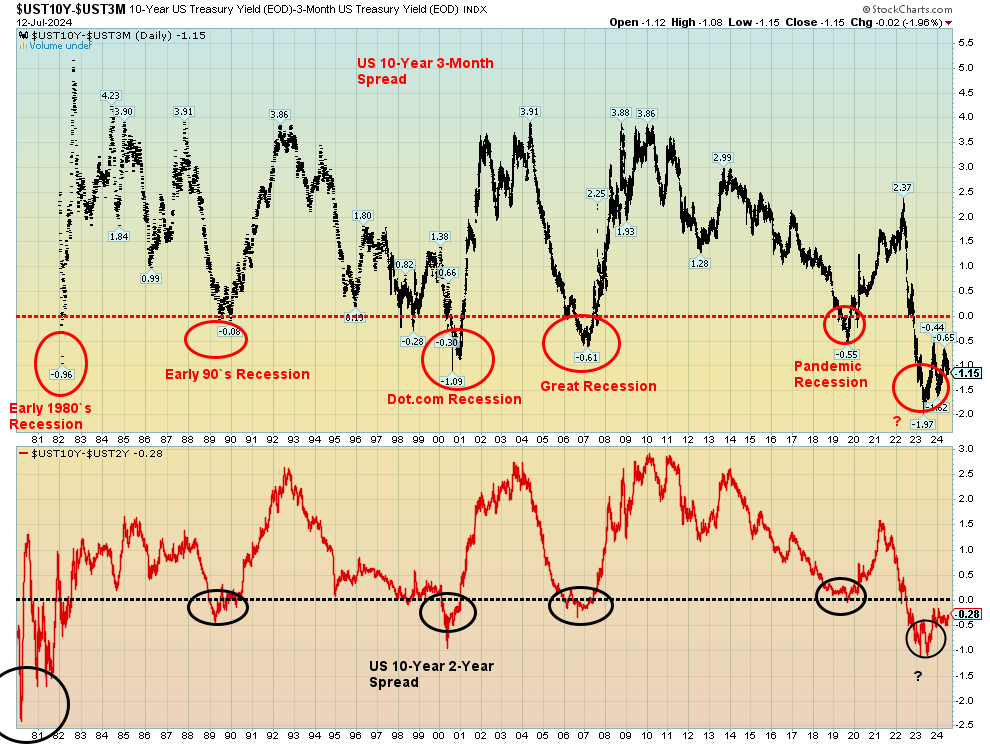
Source: www.stockcharts.com
This past week was the week of the inflation numbers. It was good news and bad news. The good news was that the inflation rate (CPI) eased this past month. The bad news was the Producer Price Index (PPI) rose this past week. Are they offsetting each other? The two tend to move together, but they can diverge slightly as the
CPI is at the consumer level while the PPI is at the wholesaler level. The market reaction was mixed. The weaker than expected CPI inflation rate (3% June vs. 3.3% in May and expectations of 3.1%) saw markets rebound, thinking the Fed might cut rates sooner than later. The PPI (2.6% June vs. 2.4% May and expectations of 2.3%) surprised the market and the result saw gold and silver sell off while the stock market held together. While the Fed looks at all of these, their core focus is normally on the Personal Consumption Index (PCE). The PCE was last reported at 2.6% in May vs. 2.7% in April. The June PCE is not due out until July 26 and it is currently expected to come in unchanged at 2.6%.
U.S. CPI and PPI 2014–2024
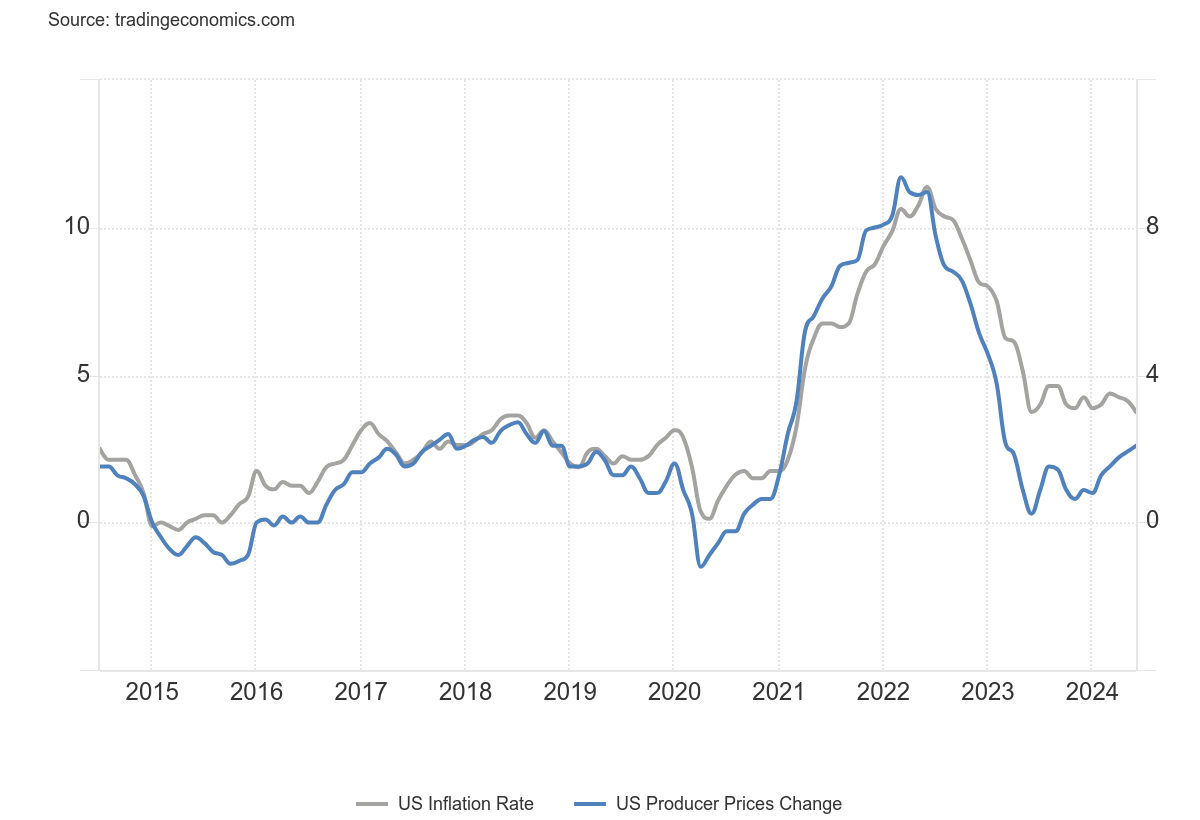
Source: www.tradingeconomics.com, www.bls.gov
Taken all together, signs continue to show we are headed for a recession. But will it be a mild one or a steep one? Based on what we are seeing, we expect it could be a deep one. There is just too much debt and bankruptcies are rising. And that feeds back into the banking system, which may be shakier than many realize.
Chart of the Week
Source: www.macrotrends.net
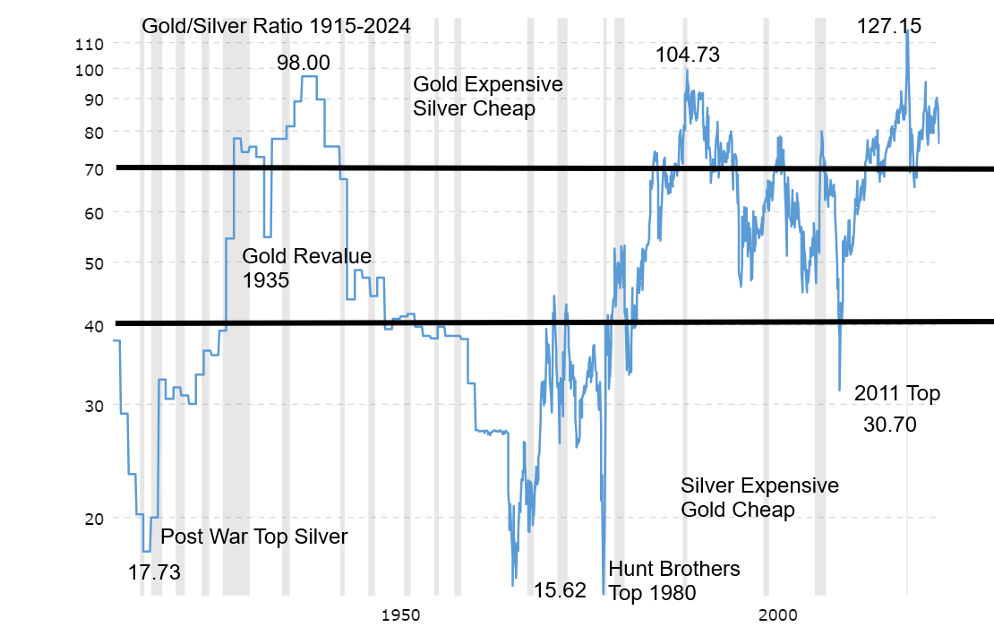
The gold/silver ratio has been falling of late in favour of silver. The ratio last peaked in February 2024 at 92.41. Today it is 76.25 and falling. But the ratio is still expensive for gold over silver. At current levels the ratio is nowhere near what it is supposedly in the ground. That ratio is estimated by geologists at around 19:1.
For years the gold/silver ratio was set by governments. It’s only recently that the ratio has fluctuated widely. The Roman Empire officially set the ratio at 12:1.1. The ratio reached 14.2:1 in Venice in 1305 and remained at this level until 1330 when it fell to 10:1.2. In 1350 it fell to 9.4:1 in some places across Europe. It climbed back to 12:1 in the 1450s. Source: Department of Economics, University of Toronto. "Medieval Monetary Problems: Bimetallism and Bullionism." The U.S. government fixed the ratio at 15:1 with the Coinage Act of 1792.
However, with the huge discoveries of silver in the Americas, the ratio began to fluctuate more. During the 20th century it ranged from a low of 15.62 in 1980 during the Hunt Brothers’ attempt to control the silver market. After that the ratio began to climb again, finally peaking out at an astounding 127.15 in 2020 as silver prices plummeted in relation to gold. Today we are down from that level but nowhere near the levels seen during 1970s after gold was set free with the end of the gold standard and Bretton Woods in 1971. Most of the time since it has traded between 40 and 70. The average for the 20th century was 47:1. One other important peak for the ratio was seen in 1941: near 98 after Roosevelt revalued gold upward to $35/ounce in 1934 with the Gold Reserve Act.
The gold/silver ratio is important to investors as a way to hedge. Rather than going long in silver outright, as an example, one can buy silver and short gold. Investors may also look at the ratio as a signal for which metal to buy.
Source: www.stockcharts.com
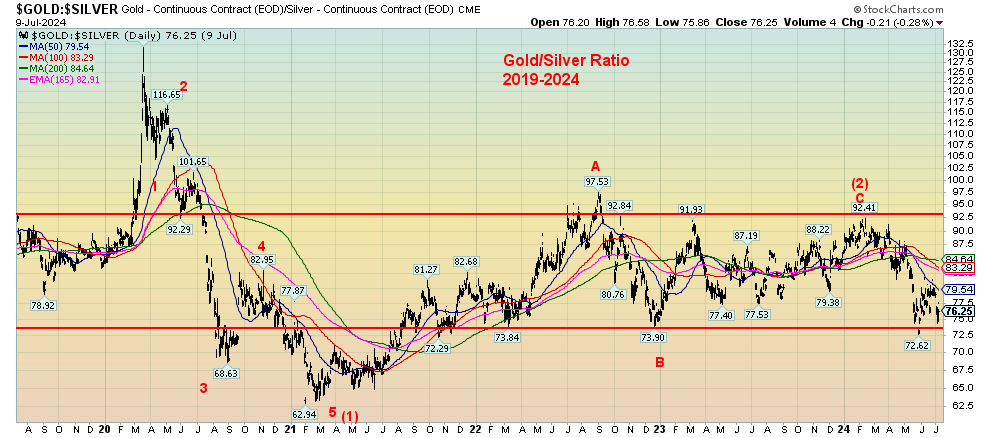
A closer look at the ratio reveals that the gold/silver ratio has been trading at around 73–93 over the past two years. After peaking at 127, ironically at the height of the pandemic scare in March 2020, the ratio fell sharply to 63 by early 2021 when both gold and silver soared out of the pandemic low. We could interpret that as an intermediate wave 1 down. Note how it fell in five waves, indicating to us that this could be a primary wave to the downside. Since then, the sideways pattern that has formed appears as a corrective wave. It should break to the downside. That would come when the ratio breaks under 72.50. A better signal would come when the ratio breaks under 70. The caveat is that we would not want to see the ratio regain above 85. That could signal that the unfolding pattern is an ABCDE correction with the D wave completed and the E wave to the upside to come.
Mostly, however, all this is pointing to silver outperforming gold going forward. By extension, silver stocks would also be favoured.
Markets & Trends
|
|
|
|
% Gains (Losses) Trends |
|
||||
|
|
Close Dec 31/23 |
Close Jul 12, 2024 |
Week |
YTD |
Daily (Short Term) |
Weekly (Intermediate) |
Monthly (Long Term) |
|
|
Stock Market Indices |
|
|
|
|
|
|
|
|
|
S&P 500 |
4,769.83 |
5,615.35 (new highs)* |
0.9% |
17.7% |
up |
up |
up |
|
|
Dow Jones Industrials |
37,689.54 |
40,000.90 (new highs)* |
1.6% |
6.1% |
up |
up |
up |
|
|
Dow Jones Transport |
15,898.85 |
15,522.86 |
1.6% |
(2.4)% |
up |
neutral |
neutral |
|
|
NASDAQ |
15,011.35 |
18,398.45 (new highs)* |
0.3% |
22.6$ |
up |
up |
up |
|
|
S&P/TSX Composite |
20,958.54 |
25,673.52 (new highs)* |
2.8% |
8.2% |
up |
up |
up |
|
|
S&P/TSX Venture (CDNX) |
552.90 |
593.70 |
1.4% |
7.4% |
neutral |
up |
down |
|
|
S&P 600 (small) |
1,318.26 |
1,350.46 (new highs)* |
5.3% |
2.4% |
up |
up |
up |
|
|
MSCI World |
2,260.96 |
2,416.44 (new highs)* |
2.2% |
6.9% |
up |
up |
up |
|
|
Bitcoin |
41,987.29 |
57,551.60 |
2.1% |
37.1% |
down |
neutral |
up |
|
|
|
|
|
|
|
|
|
|
|
|
Gold Mining Stock Indices |
|
|
|
|
|
|
|
|
|
Gold Bugs Index (HUI) |
243.31 |
300.90 (new highs) |
5.9% |
23.7% |
up |
up |
up |
|
|
TSX Gold Index (TGD) |
284.56 |
353.93 (new highs) |
5.7% |
24.4% |
up |
up |
up |
|
|
|
|
|
|
|
|
|
|
|
|
% |
|
|
|
|
|
|
|
|
|
U.S. 10-Year Treasury Bond yield |
3.87% |
4.19% |
(2.3)% |
8.3% |
|
|
|
|
|
Cdn. 10-Year Bond CGB yield |
3.11% |
3.44% |
(2.6)% |
10.6% |
|
|
|
|
|
Recession Watch Spreads |
|
|
|
|
|
|
|
|
|
U.S. 2-year 10-year Treasury spread |
(0.38)% |
(0.27)% |
15.6% |
29.0% |
|
|
|
|
|
Cdn 2-year 10-year CGB spread |
(0.78)% |
(0.44)% |
2.2% |
43.6% |
|
|
|
|
|
|
|
|
|
|
|
|
|
|
|
Currencies |
|
|
|
|
|
|
|
|
|
US$ Index |
101.03 |
104.08 |
(0.8)% |
3.0% |
down |
neutral |
up |
|
|
Canadian $ |
75.60 |
73.49 |
flat |
(2.8)% |
up |
neutral |
down |
|
|
Euro |
110.36 |
109.08 |
0.6% |
(1.2)% |
up |
up |
neutral |
|
|
Swiss Franc |
118.84 |
111.61 |
0.6% |
(6.1)% |
up (weak) |
down (weak) |
up |
|
|
British Pound |
127.31 |
129.86 |
1.3% |
2.0% |
up |
up |
neutral |
|
|
Japanese Yen |
70.91 |
63.37 |
1.9% |
(10.6)% |
neutral |
down |
down |
|
|
|
|
|
|
|
|
|
|
|
|
|
|
|
|
|
|
|
|
|
|
Precious Metals |
|
|
|
|
|
|
|
|
|
Gold |
2,071.80 |
2,420.70 |
1.0% |
16.8% |
up |
up |
up |
|
|
Silver |
24.09 |
31.16 |
(1.7)% |
29.4% |
up |
up |
up |
|
|
Platinum |
1,023.20 |
1,013.30 |
(3.1)% |
(1.0)% |
neutral |
up |
up (weak) |
|
|
|
|
|
|
|
|
|
|
|
|
Base Metals |
|
|
|
|
|
|
|
|
|
Palladium |
1,140.20 |
972.30 |
(6.5)% |
(14.7)% |
up (weak) |
down (weak) |
down |
|
|
Copper |
3.89 |
4.59 |
(1.3)% |
18.0% |
down (weak) |
up |
up |
|
|
|
|
|
|
|
|
|
|
|
|
Energy |
|
|
|
|
|
|
|
|
|
WTI Oil |
71.70 |
82.21 |
(1.1)% |
14.6% |
up |
up |
neutral |
|
|
Nat Gas |
2.56 |
2.33 |
0.4% |
(9.0)% |
down |
neutral |
down |
|
Source: www.stockcharts.com
Note: For an explanation of the trends, see the glossary at the end of this article.
New highs/lows refer to new 52-week highs/lows and, in some cases, all-time highs.
- * New All-Time Highs
Source: www.stockcharts.com
Once again, the bells, whistles, and birthday horns came out as markets made all-time highs. Most of them, anyway. Yes, the S&P 500 (SPX), the NASDAQ, the Dow Jones Industrials (DJI)—yes, the Dow finally—the NYSE, the Dow Jones Composite (DJC), the NASDAQ 100, the S&P 100 (OEX), the S&P 600 (Small), the Wilshire 5000, and the Russell 1000, 2000, and 3000. The big surprise was the S&P 600 and the Russell 2000, all small-cap indices, suggesting that the market is broadening out beyond the Magnificent Seven. Or it could be last hurrah. However, lest we forget, the NY FANG Index also made new all-time highs before reversing sharply to the downside. And some markets outside the U.S. also made new all-time highs, notably the TSX Composite, the Tokyo Nikkei Dow, and the MSCI World Index.
On the week, the SPX was up 0.9%, the DJI gained 1.6% as did the Dow Jones Transportations (DJT) which is still nowhere near its all-time high, the NASDAQ was up about 0.3% after an outside key reversal day, the S&P 400 (Mid) was up 4.3%, and the S&P 600 (Small) gained 5.3%. The NY FANG Index was down 2.5% and the S&P 500 Equal Weight Index was up 2.9% but did not make all-time highs.
In Canada, the TSX Composite gained 2.8% while the TSX Venture Exchange (CDNX) was up 1.4%. In the EU, the London FTSE was up 0.6%, the EuroNext gained 0.8%, the Paris CAC 40 was up 0.6%, and the German DAX gained 1.5%. In Asia, China’s Shanghai Index (SSEC) was up 1.0%, the Tokyo Nikkei Dow (TKN) gained 0.7%, and Hong Kong’s Hang Seng (HSI) was up 2.9%. Joy all around, it seems.
However, as we have noted, there are negative divergences everywhere. They are generally across all time frames (daily, weekly, monthly) and numerous other measurements are also flashing warning signs. We are also quite overbought with RSIs through 70. They’ve been that way for days and even a few weeks, off and on. We’ve wondered if we could survive the summer. And that is despite hints of the Fed cutting interest rates. But the monetary aggregates continue to fall, albeit slowly, which implies tightening. The debt continues to be astronomical, the political divisions are irreconcilable, bankruptcies are rising, numerous banks are having trouble, the unfunded liabilities are out of this world, and the deficit in infrastructure needs is in the trillions. The rock meets a hard place. But for the stock markets it hasn’t seemed to matter. That is the true sign that all is well, even if it is the 1% that benefits the most.
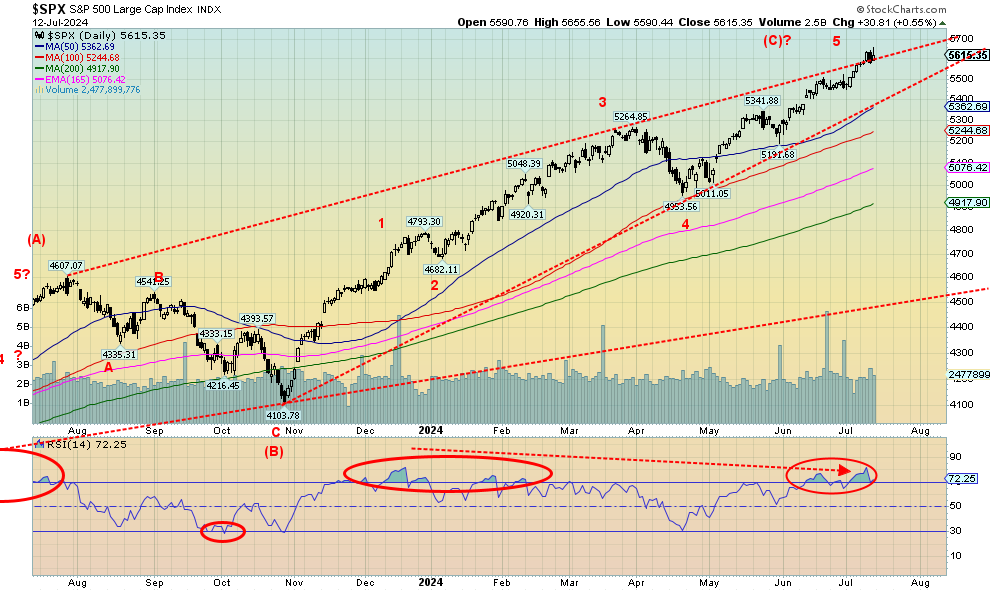
We deliberately showed the SPX appearing to break out over its upper channel line. Is it a breakout? Or an overthrow? We don’t know just yet, but far too many made outside day reversals on Thursday or, as we say in the parlance, key reversal days. And that is normally negative. But we need to confirm the breakdown. For the SPX we won’t know that until we break first under 5,450, and then second under 5,400. That still looks like an ascending wedge triangle up from that low in October 2023. New highs will keep the illusion alive that all is well.
Nonetheless, most will ignore the outside key reversal day and pile into the pullbacks with the old “buy the dip” mentality. But, is it safe?
Source: www.stockcharts.com
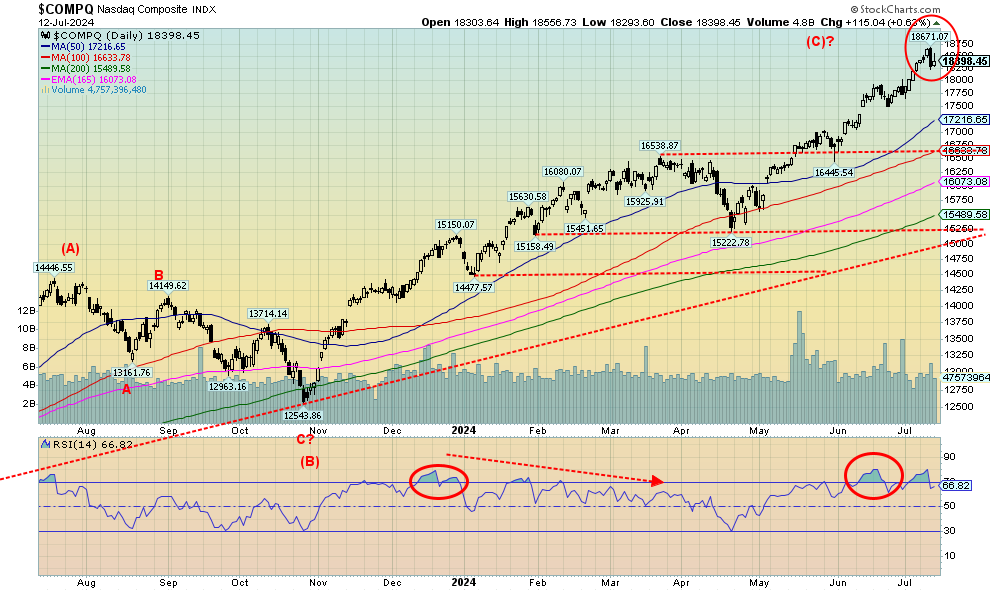
We can’t say it was a successful week for the NASDAQ. Yes, once again it made a new all-time high, then promptly reversed on Thursday, putting in an outside potential key reversal day. Naturally, it needs to follow through to the downside. But the reality is the Magnificent Seven may have finally met their maker. The NASDAQ eked out a 0.3% gain but its main component, the NY FANG Index, fell 2.5%. Many of the Mag 7 had a lousy week: Meta down 7.6%, Amazon down 2.8%, Netflix off 6.2%, Google down 2.7%, Microsoft off 3.0%, and Snowflake down 5.1%. But before they fell, some made all-time highs such as Meta, Apple, Amazon, and Google. Oh yes, Apple was the only one with a gain, up 1.9%. Tesla fell 1.3% after being up sharply earlier in the week. We didn’t forget Nvidia that actually gained 2.7% but, as we note next, the stock is looking a little sickly. As my colleague Mike Ballanger of GGM Advisory says, maybe the millennials will stop talking about AI and embrace junior mining developers. After all, as Mike points out, that iPhone they are carrying is full of mineral elements. Apparently 46 elements and they all come from the earth somewhere. Included in those 46 elements are gold, silver, palladium, copper, and platinum, with gold being a key element. Yet the junior miners are largely ignored. The junior TSX Venture Exchange (CDNX) is down 82% from its all-time high in 2007. The NASDAQ is up 258% from what was then a frothy top at the peak of the dot.com bubble in 2000 and up 1,560% from its post-dot.com peak bottom of 2002. The CDNX is made up of over 50% junior exploration miners.
Nonetheless, the babble is about the Mag 7, not about junior gold miners. Unless, as Mike again points out, you look east to Asia where they do embrace gold. And, might we add, so do central banks, it seems, as they shed U.S. treasuries for gold. But this short piece is supposed to be about the NASDAQ. So, our bottom line here is that we are getting negative signs and the Mag 7 appear to be headed for a fall. It’s a nice drop alone to the 50-day MA currently near 17,200. That alone is an 8% drop. Go to the 100-day MA and it’s an 11% drop. As for the 200-day MA, it’s a 17% drop as we inch closer to an official bear market.
Source: www.stockcharts.com
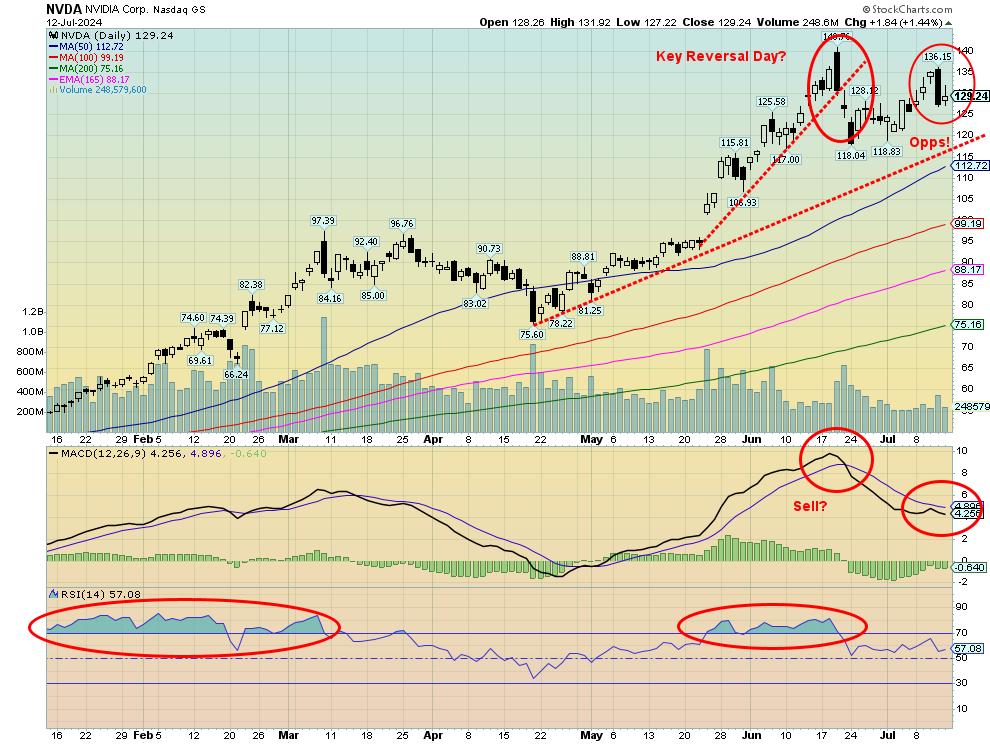
Is it really over? It was on June 20 that Nvidia put in a outside potential key reversal day. Now again on July 11 Nvidia and the rest of the Magnificent Seven were hit. Nvidia fell 5.6% that day. The rest of the Mag 7 followed. When you see a key reversal day followed by a drop and then return action that fails to make new highs, even as others of the Mag 7 did make new highs, that is a deadly signal. The MACD indicator that earlier gave us a sell signal tried to give us a buy signal but never crossed. We call it a kiss and run. Regardless of what
happened on July 12, the odds favour that the next significant move for Nvidia and the Mag 7 is most likely to the downside. All July 12 was, was an inside day. Can anything save it? Of course. New highs. A break now under that earlier low at $118.04 and especially under 113 most likely signals, at minimum, a good correction.
Source: www.stockcharts.com
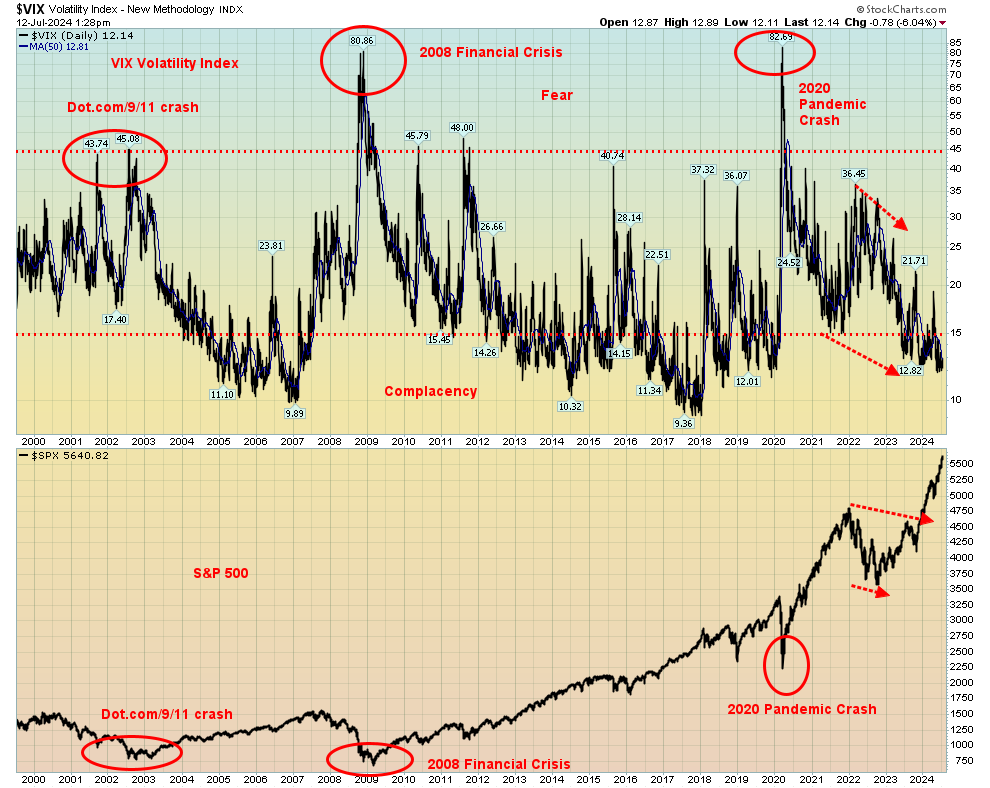
With a VIX Volatility indicator down at 12 and the S&P 500 screaming to new all-time highs, we are most likely signalling max complacency. All we need is confirmation that a sell-off is likely underway. The only thing missing are divergences between the index and the VIX. A divergence would take place if the SPX made new highs while the VIX did not. That remains possible. But regardless of when, the end is nigh.
Source: www.stockcharts.com
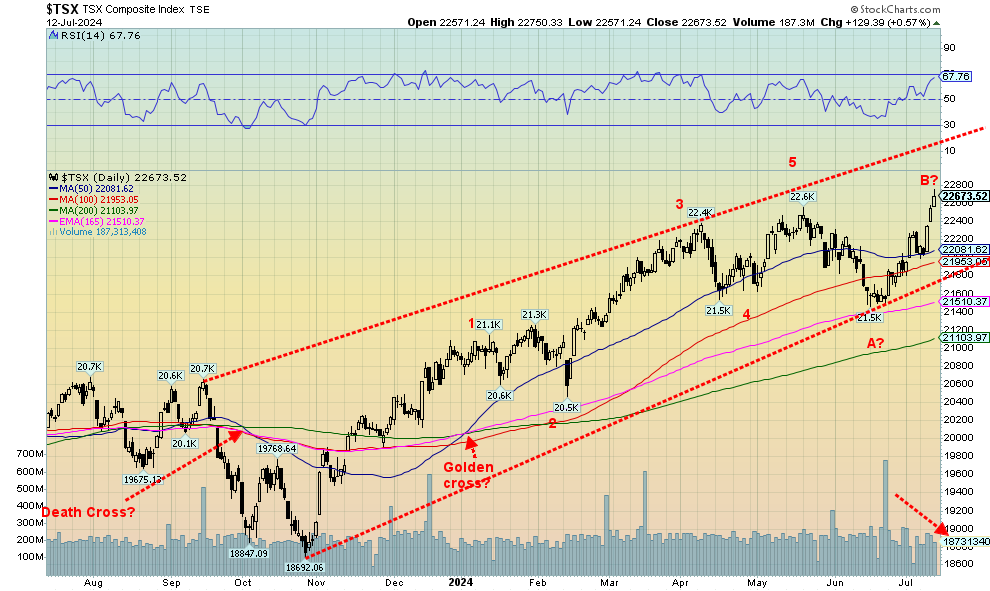
The TSX Composite joined the land of the new all-time highs (finally) this past week. The more senior TSX 60 also made new all-time highs. Overall, the TSX was up 2.8% while the TSX 60 gained 2.7%. The junior TSX Venture Exchange (CDNX) also gained but by a more modest 1.4%. The sub-indices all had cause for celebration as all 14 were up on the week. Big gainers came from the interest-sensitive sector as Income Trusts (TCM) jumped 5.9%, Real Estate (TRE) was up 5.4%, Financials (TFS) gained 3.3%, and Utilities (TUT) was up 3.8%. New all-time highs were also a feature as Consumer Discretionary (TCD) was up +4.5%, Consumer Staples (TCS) +2.6%, and the previously mentioned Financials (TFS) all made all-time highs. Golds (TGD) made 52-week highs, up 5.7%. The biggest loser, or in this case the weakest gainer, was Energy (TEN), up a paltry 0.9%. Eight of the 14 sub-indices were up 2% or higher with Income Trusts (TCM) the big winner. TCM is still down on the year, off 1.4%, and did not make new all-time highs despite the gain. The TSX has room to move higher towards 23,600 and the top of that channel. On the negative side, we noticed volume tailed off this past week even as we made new all-time highs. Maybe it’s because of the holiday season that still prevails.
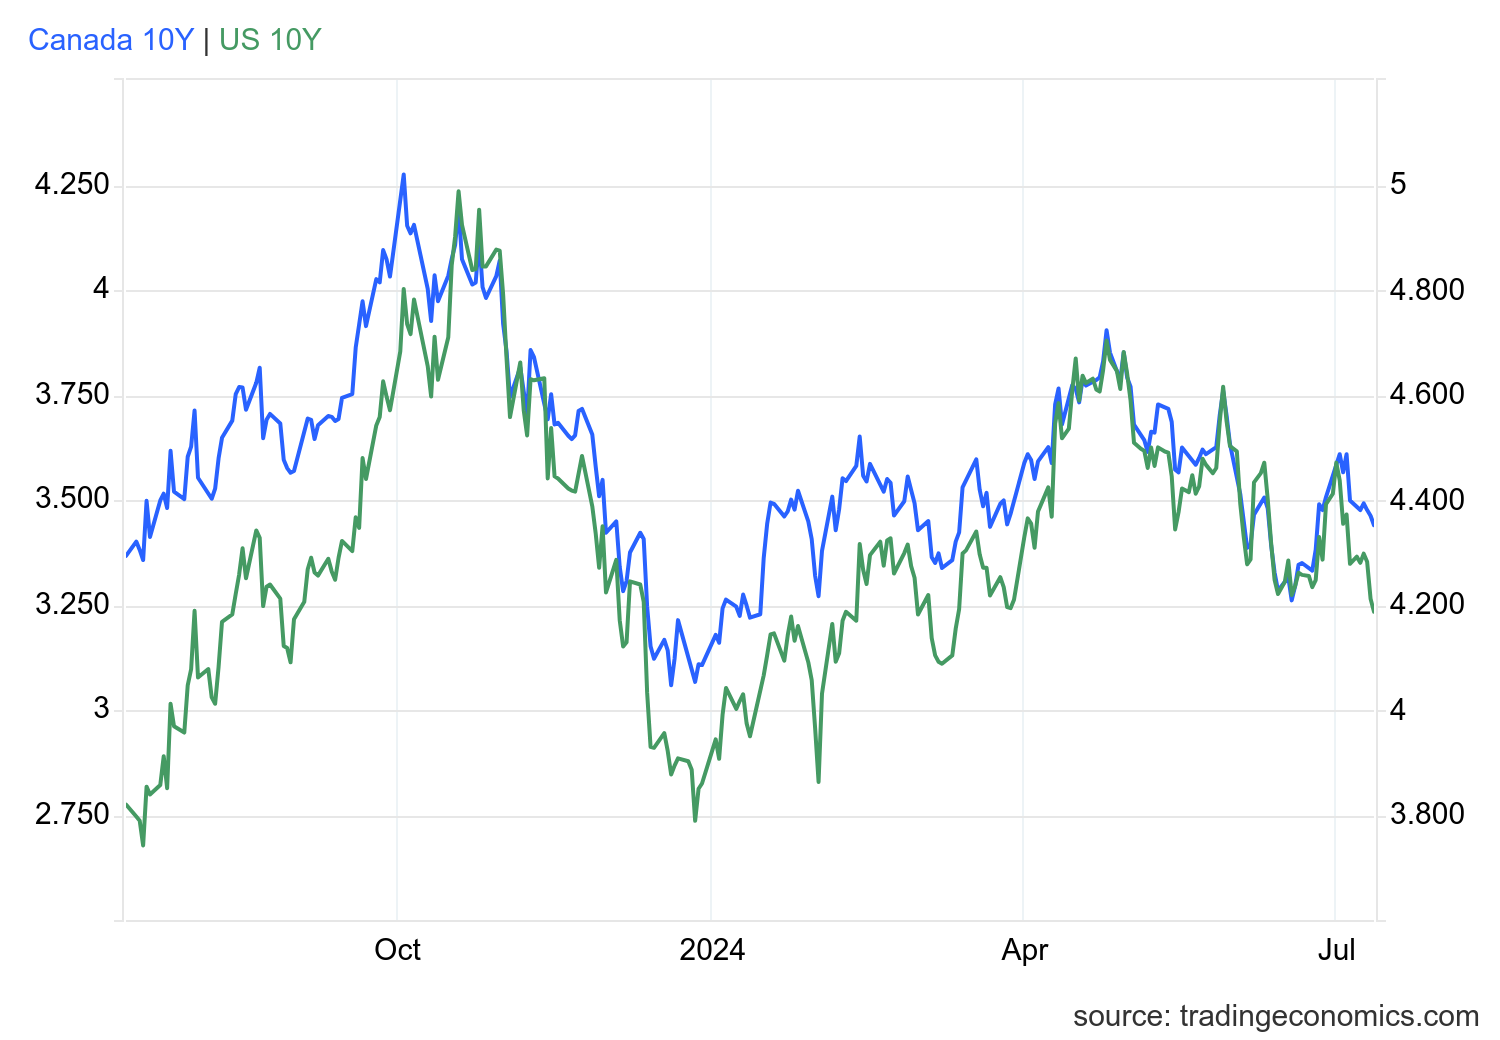
U.S. 10-year Treasury Note, Canada 10-year bond CGB
Source: www.tradingeconomics.com, www.home.treasury.gov, www.bankofcanada.ca
With what appears to be an ongoing ebbing of inflation, despite the slight pickup in Friday’s PPI, bond yields fell again this past week and continue to inch closer to unchanged on the year. The U.S. 10-year treasury note fell to 4.19%, down from 4.29% but still above the close of 2023 at 3.89%. The Canadian 10-year Government of Canada bond (CGB) also fell to 3.44% from 3.53% and inched closer to unchanged at 3.11%. All that helped to narrow the inverted yield curve as the U.S. 2–10 fell to negative 27 bp from negative 32 bp and the Canadian 2–10 dropped to negative 44 bp from negative 45 bp. Hopes continue to rise for the Fed to lower interest rates by September, following the example of the Bank of Canada (BofC) which has already dropped rates. None of that has helped the beleaguered housing market as sales plummet, but nobody wants to drop prices much. Meanwhile mortgage delinquencies are rising. No, prices have not yet dropped, but eventually the log jam will break and desperate sellers will appear and take losses rather than continue to hold on to a house they no longer can afford. Condos, of which there are far too many of one-bedroom investor-purchased type, are not moving at all. The last time we checked, families of four have a hard time living in a one-bedroom apartment. However, lots of them were built (and still are) rather than 3-bedroom homes or even apartments for families. However, the latter are priced out of the reach of most families.
We covered most of last week’s economic numbers in our opener so there is little else we can note, except the weekly job claims that came in at 222,000 below the expected 236,0000 and last week’s 239,000. And we note that used car prices fell 8.9% in June, following a 12.1% decline the previous month. So, when will housing prices follow them lower?
This coming week Canada reports its inflation numbers and the U.S. reports retail sales and a few manufacturing indices like the NY Empire State Index and the Philly Fed. It’s not a lot that could ignite the market unless retail sales fall off the map. They are expecting a feeble 0.1% gain in June for retail sales.
Nonetheless, the inverted yield curve continues to inch towards normalization, so it’s a matter of when not if a recession gets underway.
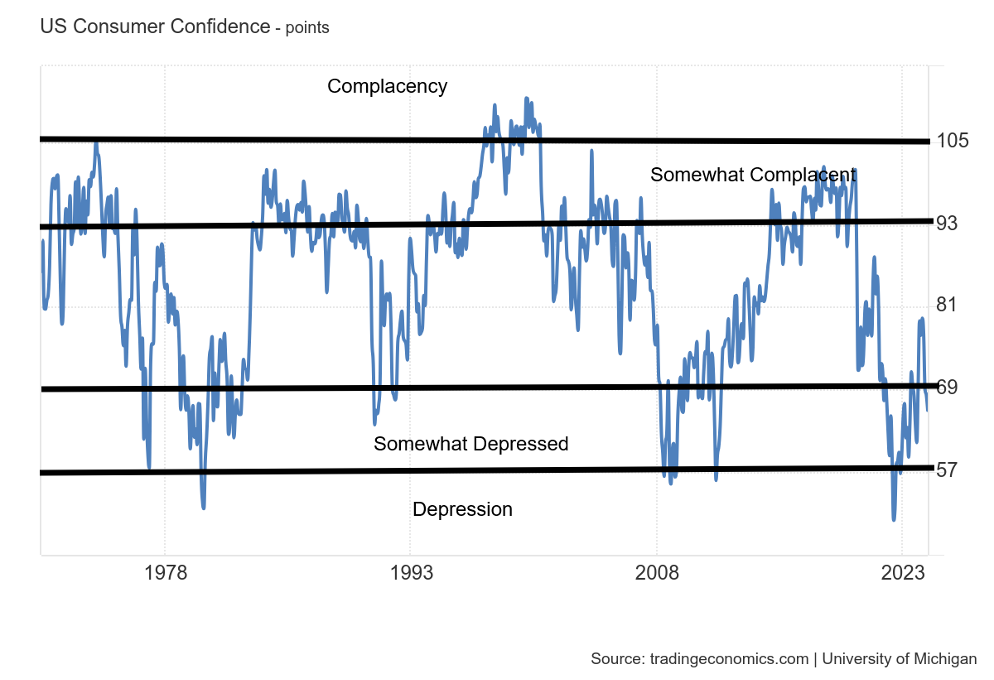
Source: www.tradingeconomics.com, www.umich.edu
The University of Michigan consumer sentiment for the U.S. fell for a fourth straight month to 66 in July 2024, the lowest since November, from 68.2 in June and well below forecasts of 68.5. Nearly half of consumers are still concerned about high prices and economic uncertainty persisting as an upcoming divisive election looms. The current conditions gauge declined to 64.1 from 65.9 and the expectations subindex fell to 67.2 from 69.6. Meanwhile, both the year ahead and the five-year inflation expectations decreased to 2.9% from 3%. No matter how we look at it, consumers are down. By this measurement, consumers are depressed almost as deeply as they were during the pandemic.
Source: www.stockcharts.com
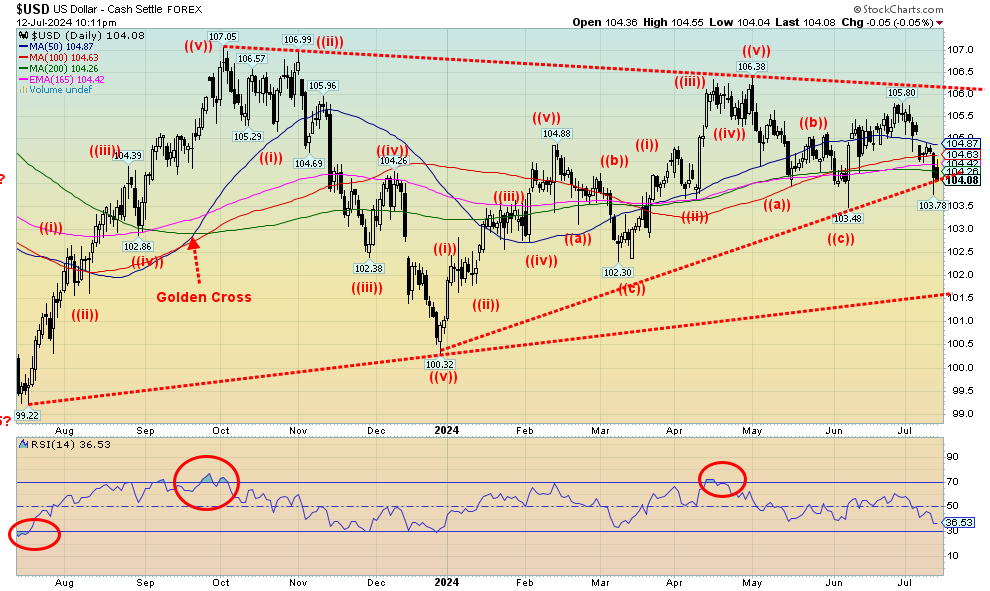
Given the lower than expected inflation numbers this past week (CPI) and thoughts of a Fed rate cut dancing in everyone’s dreams, the US$ Index fell this past week by 0.8%. A weaker US$ Index was positive for gold as it rose about 1% this past week. The US$ Index seemed to shake off the marginally higher than expected PPI numbers but was dampened further by the lower than expected Michigan consumer confidence report. As to the other currencies, the euro rose 0.6%, the Swiss franc was up 0.6% as well, the pound sterling rose 1.3%, and the Japanese yen finally came to life, rising 1.9%. The Cdn$ was flat. The US$ Index dipped under its uptrend line but held it on a close basis. Another solid break of 104 could, however, send the US$ Index lower, towards next good support near 102/102.25. Under 102, we could fall to long-term support near 101.50. Below 101.50, we are officially in a bear market.
Source: www.stockcharts.com
The precious metals (PMs) market was decidedly mixed this past week. Gold, encouraged by thoughts that the Fed could cut rates by September as well as encouraging inflation numbers and falling consumer confidence, rose about 1% this past week and closed over $2420. Silver, however, disappointed and actually fell 1.7%. Platinum was worse, down 3.1%. The near PMs also saw palladium fall 6.5% and copper drop 1.3%. The only real encouragement came from the gold stocks that saw both the Gold Bugs Index (HUI) and the TSX Gold Index (TGD) break out to 52-week highs. The HUI was up 5.9% and the TGD rose 5.7%. But the gold bugs focus mostly on gold, sometimes ignoring the others, even as they are important as well. We want to see all the PMs rising together, not some up and some down or, in the past week, gold up but everyone else down.
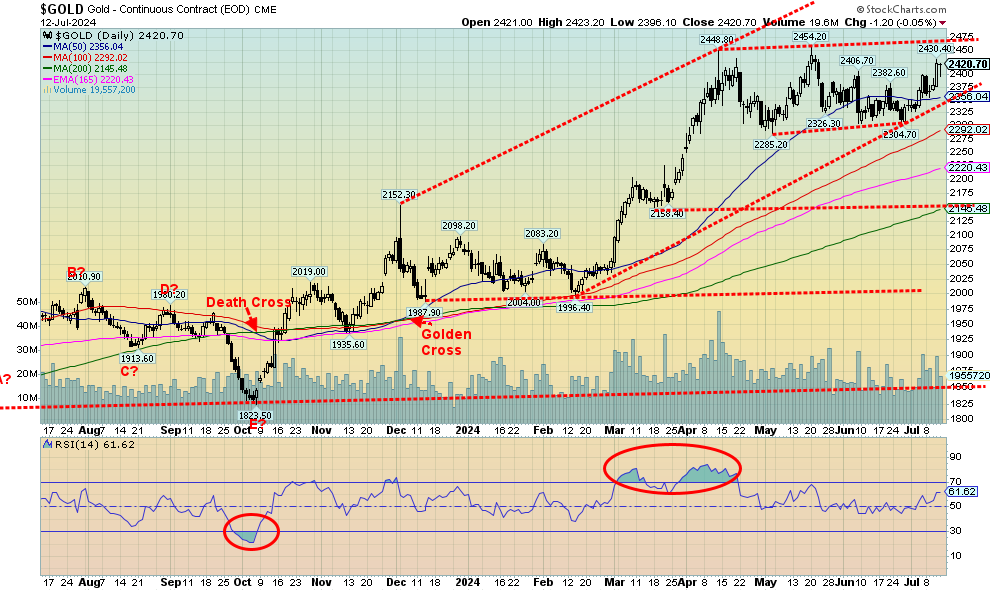
Given that gold is now over $2,420, it suggests that we could see new all-time highs above $2,454. Of course, the corollary to that is gold is forming a triple top, instead of a possible head and shoulders top. The other side of this is that gold is forming a trading range consolidation pattern. Usually, those patterns unfold in five waves: ABCDE. So far, we see ABCD, with D being the current wave, so an E wave to the downside could still be in play. Seasonally, that would fit as July lows for gold are not unusual until the more positive seasonals kick in in August. Not helping is a commercial COT at 19%, although when we include options on futures the commercial COT rises to 27%. The RSI is still at a fairly neutral 61 so we are nowhere near overbought. That could give us room to rise further.
Gold in other currencies is also languishing, except for gold in Japanese yen which recently made new all-time highs. As well, the Gold/GDX and Gold/GDXJ (GDX – senior/intermediate gold stocks, GDXJ – junior gold stocks) continue to show favour to the gold stocks, particularly the junior gold stocks. If gold stocks are the leaders, they are performing as they should. Both gold and silver will follow.
With the exception of the risk of another pullback where gold should hold above $2,300, we remain bullish on the sector. A firm break to new all-time highs should set us on the way to $2,500 and even $2,600 this coming year. There is just too much risk, particularly given the astronomical amounts of debt, rising bankruptcies, potential threats to the banking system, softening inflation, and political risk given the deep political divisions that exist today. As a few have pointed out, a Trump presidency could be quite positive for gold, given thoughts of huge tax cuts and a rise in trade wars.
Source: www.stockcharts.com
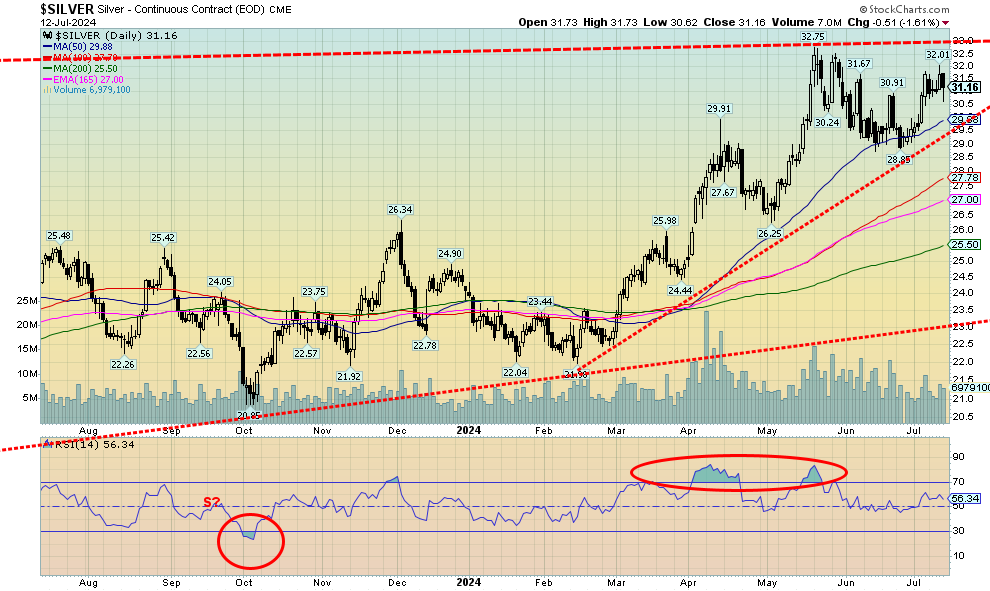
Silver disappointed this past week as it fell 1.7%, thanks to a bad Friday following the release of the marginally higher PPI numbers. Resistance remains at $32, a level that was hit this week but that failed to break. Based on the recent high at $32.75, we need to break over $33 to suggest we are on our way to projected levels of $39/$40. Silver is not in any danger unless we were to break under $29/$29.50. If that happened, we could soon fall back to $27/$28. Very long-term support is seen down near $23, a level we are not expecting. Most discouraging is the 22% commercial COT that suggests there may be a fall in price, not a rise. Still, silver is in demand deficit and supplies are dwindling. Discoveries are slow. Volume on the recent rise has not been impressive so we could yet face another pullback. The RSI is at a pretty neutral 56. However, silver stocks have done well and could be leading the way. As we noted, the gold/silver ratio has recently been falling in favour of silver, although this past week has not done any favours for silver as the ratio is currently at a still lofty 77.7. As we noted, we still need to get that ratio under 70 to suggest silver is finally gaining.
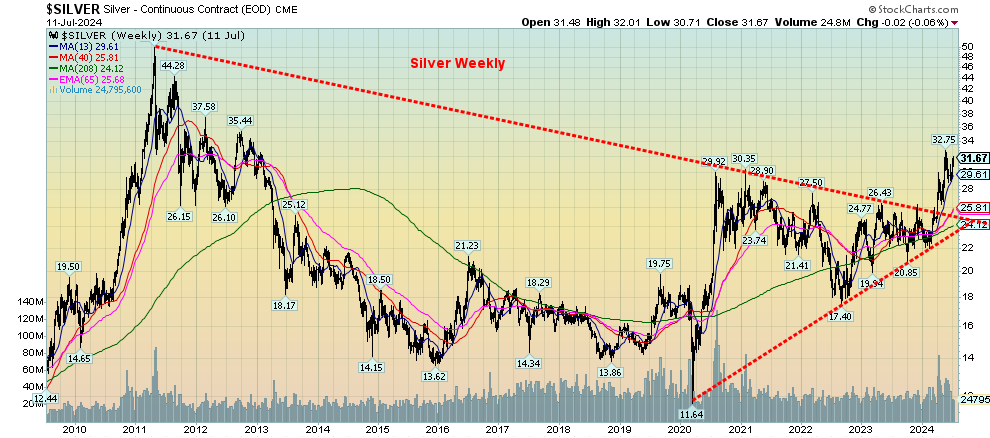
Source: www.stockcharts.com
Despite the disappointing showing of silver this past week, we wanted to show that silver has broken out of a long multi-year downtrend. That occurred when we broke successfully over $26 and confirmed with a breakout to new highs above $31. As well, recent pullbacks have been encouraging, holding above $29. The multi-year breakout has a potential target up to $63 which, if achieved, is good double from current levels. It would also be new all-time highs, given that twice silver hit about $50 in 1980 and 2011. The 1980 high remains, however, the real benchmark as today that would require silver to hit $190. That’s a seemingly impossible level, but nonetheless one that some analysts are predicting silver to rise to. Potentially more achievable is $70, a level that would equal the 2011 high on an inflation-adjusted basis.
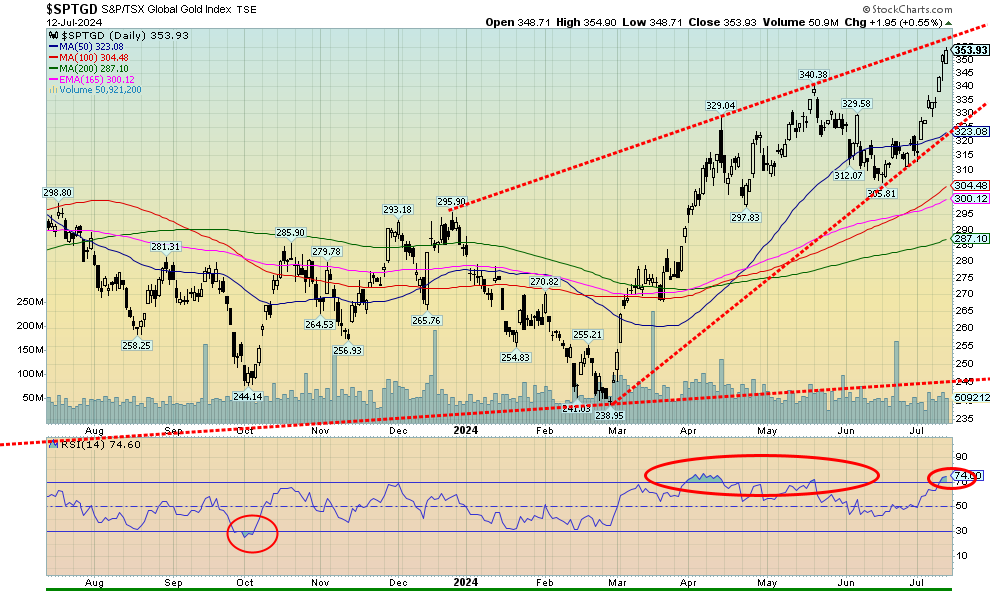
Source: www.stockcharts.com
As we had noted, the breakout this past week of the gold stocks was encouraging, despite the mixed performance of gold and silver. The TSX Gold Index (TGD) broke over 340, closing near 354 and gaining 5.7%. The Gold Bugs Index (HUI) broke over 300 up 5.9%, closing just above that level near 301. Both indices made 52-week highs and some of the stocks we follow also made new 52-week highs. All of this is encouraging. More encouraging would be if they can hold above those levels this coming week and even add to the gains. Are the gold stocks leading? Certainly, in a bull market we need to see the gold stocks along with silver leading. We note they also lead in a bear market but to the downside. We do have two concerns for the TGD. First, we are somewhat overbought with the RSI above 70. Second, we note we appear to be nearing the top of a channel that could be an ascending wedge triangle (bearish). The top of that channel is currently near 358. The HUI shows a somewhat similar pattern as the top of its channel is near 306 and the HUI too has an RSI over 70. But overbought levels can remain for some time. Encouraging is the fact that neither gold or silver are overbought with RSIs near 60. That suggests to us that the gold stocks, at least, could move higher with little concern about the high RSI. Given the move, however, we need to see the TGD continue to hold above 340 on any pullback. At this point, a full breakdown doesn’t occur until under 325. We continue to be positive about gold, silver, and the gold stocks. Even some of the junior exploration stocks are showing some life. For that moribund market, it would be a welcome relief. Gold stocks are also being helped by good results. Indeed, their most recent quarterly results are the best on record. That in turn should attract more professional investors and funds.
Source: www.stockcharts.com
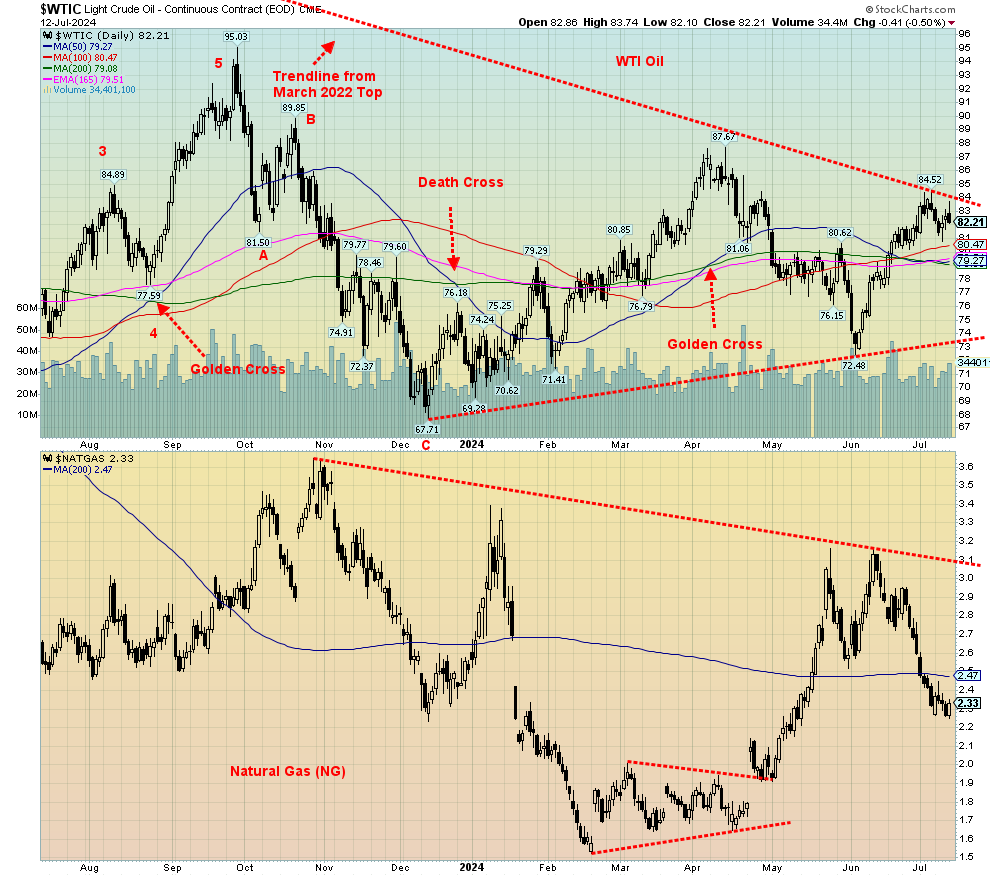
WTI oil prices have been consolidating below our $84 breakout level. Maybe make that $85 now as WTI recently hit a high of $84.52 but failed to break through. Brent has been consolidating near $86 but did hit a high near $88. Like many, the energy market is awaiting the Fed to cut rates, premising somehow that could result in increased demand. Hurricane Beryl turned out to be less than what was expected, given that any damage was limited. Falling inflation also helps. On the negative side, signs that China’s recent resurgence is
slowing could impact demand. And, despite sanctions and more, Russia appears to be having little trouble moving its oil.
On the week, WTI oil fell 1.1% and Brent dropped 1.7%. Natural gas (NG) at the Henry Hub gained a small 0.4% while EU NG at the Dutch Hub fell 4.3%. The EU has ample in storage but still is concerned about potential supply disruptions. The energy stocks were mixed as the ARCA Oil & Gas Index (XOI) fell 0.2% but the TSX Energy Index (TEN) rose 0.9%.
There is not a lot to say this week about energy prices. WTI hovers below breakout at $84/$85, but is holding above breakdown at $79/$80. NG has pulled back from resistance near $3 and is currently below its 200-day MA near $2.50. If NG is to go higher, it needs to regain above $2.90 and not fall any further; otherwise, the bear market for NG could return. Maybe NG is trying to form a huge head and shoulders bottom. That’s a good reason why we wouldn’t want to see NG fall further below $2.10. Otherwise, the potential pattern would be defunct.
Copyright David Chapman 2024
GLOSSARY
Trends
Daily – Short-term trend (For swing traders)
Weekly – Intermediate-term trend (For long-term trend followers)
Monthly – Long-term secular trend (For long-term trend followers)
Up – The trend is up.
Down – The trend is down
Neutral – Indicators are mostly neutral. A trend change might be in the offing.
Weak – The trend is still up or down but it is weakening. It is also a sign that the trend might change.
Topping – Indicators are suggesting that while the trend remains up there are considerable signs that suggest that the market is topping.
Bottoming – Indicators are suggesting that while the trend is down there are considerable signs that suggest that the market is bottoming.
Disclaimer David Chapman is not a registered advisory service and is not an exempt market dealer (EMD) nor a licensed financial advisor. He does not and cannot give individualised market advice. David Chapman has worked in the financial industry for over 40 years including large financial corporations, banks, and investment dealers. The information in this newsletter is intended only for informational and educational purposes. It should not be construed as an offer, a solicitation of an offer or sale of any security. Every effort is made to provide accurate and complete information. However, we cannot guarantee that there will be no errors. We make no claims, promises or guarantees about the accuracy, completeness, or adequacy of the contents of this commentary and expressly disclaim liability for errors and omissions in the contents of this commentary. David Chapman will always use his best efforts to ensure the accuracy and timeliness of all information. The reader assumes all risk when trading in securities and David Chapman advises consulting a licensed professional financial advisor or portfolio manager such as Enriched Investing Incorporated before proceeding with any trade or idea presented in this newsletter. David Chapman may own shares in companies mentioned in this newsletter. Before making an investment, prospective investors should review each security’s offering documents which summarize the objectives, fees, expenses and associated risks. David Chapman shares his ideas and opinions for informational and educational purposes only and expects the reader to perform due diligence before considering a position in any security. That includes consulting with your own licensed professional financial advisor such as Enriched Investing Incorporated. Performance is not guaranteed, values change frequently, and past performance may not be repeated.
About the author


Website: https://www.enrichedinvesting.com
Disclaimer: David Chapman is not a registered advisory service and is not an exempt market dealer (EMD) nor a licensed financial advisor. We do not and cannot give individualised market advice. David Chapman has worked in the financial industry for over 40 years including large financial corporations, banks, and investment dealers. The information in this newsletter is intended only for informational and educational purposes. It should not be considered a solicitation of an offer or sale of any security. The reader assumes all risk when trading in securities and David Chapman advises consulting a licensed professional financial advisor before proceeding with any trade or idea presented in this newsletter. David Chapman may own shares in companies mentioned in this newsletter. We share our ideas and opinions for informational and educational purposes only and expect the reader to perform due diligence before considering a position in any security. That includes consulting with your own licensed professional financial advisor.