
The world is becoming more dangerous with the seizure of world leaders, threats against other countries, seizure of oil tankers, and unrest on the streets. Yet stock markets the world over appear to shrug and keep going up. Why not, with promises of lower interest rates, increased liquidity through quantitative easing (QE), and repos. All that money has to go somewhere. Not in bonds, it seems, as interest rates remain elevated but steady. Instead, it's the stock market. Oh, and gold and silver too. Doesn't matter that it is largely the wealthy and the large financial institutions that are pumping the market, even as signs of deterioration are elsewhere for the majority. The K economy.
The December jobs report came out for both the U.S. and Canada. Neither was particularly good, but not a disaster either, or at least not yet. The jobs reports are the subject of our chart of the week.
Stock markets the world over rose this past week. The big winners were the gold stocks, picking up where they left off in 2025. The precious metals (gold, silver, platinum, etc.) also rose. A number of new all-time highs were seen. OceanaGold Corporation, for example, reported record quarterly revenue, strong free cash flow, pays a dividend, and is held in the Enriched Capital Conservative Growth Strategy.* Currencies wobbled as the US$ Index rose while the remaining currencies were off. Oil rose slightly with unrest in Venezuela and Iran. But the oil stocks did little.
This week, we get the December inflation reports. They are expected to remain benign but elevated. Investors anxiously await the central bank decisions (Fed, BofC) later in the month. Will they lower interest rates or not? We might even get a new Fed Chairman at some point this month. Trump wants lower interest rates. Will the Fed accommodate?
It's been a dreary, damp winter so far. Kind of like the pall settling on the world, with the only sunshine being the markets.
Have a great week!
DC
* Reference to the Enriched Capital Conservative Growth Strategy and its investments, celebrating a 7.92-year history of 147.47% growth (annual 12.13%), is added by Margaret Samuel, President, CEO, and Portfolio Manager of Enriched Investing Incorporated, who can be reached at 416-203-3028 or msamuel@enrichedinvesting.com
“Imagination is more important than knowledge.”
—Albert Einstein, German-born theoretical physicist, best known for developing the theory of relativity, contributed to quantum theory with the formula E = mc2, won the Nobel Prize for physics in 1921; 1879–1955
“He who knows nothing is confident of everything.”
—anonymous
“The death of contrarians has been greatly exaggerated. The reason is that the crowd is the market for most of any cycle. You cannot be a contrarian all the time; otherwise, you end up simply fighting the tape the whole way up (or down), therefore being wildly wrong.”
—Barry L. Ritholz, American businessman, founder and CIO, Ritholtz Wealth Management, a noted contrarian, formerly Chief Market Strategist of Maxim Group; b: 1961
Wall Street is all-in on 2026 being bullish, just like 2025. The Bloomberg track of the index, 21 sell-side analysts, forecast that the S&P 500 will be bullish for 2026 (www.maudlineconomics.com). Yes, that is the prediction, despite the backdrop of a sliding job market, consumer sentiment at multi-year lows, retail sales being held up by the 10%–20%, wars, a rogue U.S. snatching world leaders and oil tankers, and uprisings on the street. It all seems rather implausible. But instead, it’s real. The market will just keep on rising until it doesn’t.
Why? It’s the K economy. Stocks are rising, even as all around it things are slowly sinking. Since March 2009, when the S&P 500 reached its significant low, ending the bear market of the financial crisis and Great Recession, the S&P 500 has gained 645%. Is that the greatest rise ever? No. The bull market from 1982 to 2000 rose by over 1,500%. The Roaring Twenties bull went up only 496%. Interestingly, all the bull markets were fueled by technological advances. Oh yes, low interest rates and lots of liquidity. So, this one has been quite remarkable with a few hiccups along the way, particularly in 2018–2020 when there was both the 2018 drop due to Trump I tariffs and 2020 due to the pandemic. But 1982–2000 saw the crash of October 1987 and the Russian/LTCM collapse in 1998.
It's not difficult to figure out. Through most of the period, interest rates were held artificially low, particularly after the Great Recession in 2007–2009 and the 2020 pandemic. The word was quantitative easing (QE), a method whereby funds were channeled through the Federal Reserve into the financial system to prevent an economic collapse. The strategy worked. While the stock market was rising 645%, Money Supply M1 was rising 1100%. U.S. debt rose 400% or $28.9 trillion. All U.S. debt (government, corporations, consumer) rose over 200% or $56.2 trillion from 2008. Sounds amazing, but over 80% of all U.S. debt has been accumulated in the past 25 years. Budget deficits were the norm, today averaging about 6% of GDP, the highest in the G7. There is little sign that this will end anytime soon, and it’s threatening to rise more.
There were periods of tightening (quantitative tightening or QT) in 2015–2016 and 2022–2023, but in all cases, that dissipated, and they went right back to pumping the financial system with funds. The bulk of the funds winds up in the hands of banks and other financial institutions. Where does it all go? The stock market and whatever else they find of investment value (gold?).
S&P 500 2009–2026
Performance S&P 500, M1, Gold

Source: www.stockcharts.com
Now we see the Fed once again becoming more accommodative through repos and the ending of QT. They are also lowering interest rates, but so far, interest rates have remained above the rate of inflation. That’s unlike what happened for the most part from 2002 to 2022, when interest rates were consistently lower than the rate of inflation, thus making it ultimately inflationary even if there was a delay. But now the focus is turning again to accommodation and, with the upcoming appointment of a new Fed Chairman to replace Jerome Powell, the Fed may get even more accommodative.
Another bullish thing we see is Trump’s desire to increase the military budget to $1.5 trillion from $1.0 trillion. He also wants the Treasury to buy $200 billion in mortgage bonds that might help bond yields to fall, which is also bullish for the stock market. He’s been calling for the Fed to lower the Fed rate to 1%. Will a new Fed Chairman be accommodative? And don’t forget the positive impact of the Big, Beautiful Bill. Irrespective of this, it promises budget deficits far into the future. But it also promises that stocks could continue higher into 2026.
That is bullish for the stock market but ultimately bullish for inflation as well. It is also bullish for gold and silver. Gold was up over 400% from 2009 to 2026, while silver gained over 600%. Except, as we have noted, gold and silver are the canaries in the coal mine. They are a warning against the backdrop of geopolitical unrest, domestic political unrest, a weakening economy, and a stock market that won’t stop.

Source: www.home.treasury.gov, www.usa.gov, www.biancoresearch.com
The rise of U.S. debt has been remarkable. Practically all the U.S. debt ever accumulated has occurred since 2000. Sure, there was a sharp increase in the 1980s as the U.S. spent to take down the Soviet Union. The 1990s mostly saw surpluses. But all that disappeared in the 2000s as spikes grew, due to the 2000–2002 dot.com crisis, 9/11, and the wars against Afghanistan and Iraq. The 2008 financial crisis brought on another huge spike as deficits reached over 10% of GDP. Deficits eased again during the 2010s. However, in the late 2010s, they started to rise once again, spiking during the pandemic crisis of 2020 and reaching a mind-boggling 18.1% of GDP in March 2021. Once again, the deficit was brought down during the early part of the 2020s but has now begun to rise.
By 2030, the deficit is expected to grow from $38.5 trillion to $43.1 trillion, given an acceleration of wars and the Big Beautiful Bill. Debt to GDP is 124% and is not expected to come down anytime soon. Only Italy and Japan have a higher debt-to-GDP ratio than the U.S in the G7.
Fed Rate, US 10-year Note, German 10-year Bund, Japan 10-year Bond 2000–2026 
Source: www.stockcharts.com
Rising interest rates are a killer for huge deficits. Nobody has been immune. Since that low in 2020–2021, the Fed rate has increased 365 bp or over 6000%, the U.S. 10-year Treasury note is up 316 bp, the German 10-year bund is up 336 bp, and the Japanese 10-year bond is up 217 bp. Germany may have the best debt profile as compared to GDP, but all, especially Japan, are vulnerable to rising interest rates. Japan suppressed interest rates for years, so, given a massive debt/GDP ratio of 252%, Japan is actually the most vulnerable to rising interest rates. For the U.S., interest on the debt is already up to $1.2 trillion annually, exceeding the defense expenditure by roughly $200 billion.
None of this is sustainable. Foreigners own $9.2 trillion of the U.S. debt, led by Japan with $1.2 trillion. China has fallen to number 3 and is down some $71 billion in the past year. The slack has been picked up by others, but notably, foreign purchasing of U.S. treasuries has slowed over the past year. That puts more pressure on U.S. financial institutions, U.S. agencies, and the Fed to replace foreigners. Ultimately, it also puts upward pressure on interest rates. The spread between the U.S. 10-year notes and Fed Funds has been rising. Previous periods of a rising spread were followed by a recession.
Ultimately, what will be the impact on the U.S. dollar? It’s already under pressure, having fallen over 9% in 2025 and down almost 14% from its last significant high in 2022. Don’t even think about the all-time low made in 1985. Yes, it’s down 60%. But then all fiat currencies have been falling. The U.S. dollar is the world’s reserve currency. Can it continue to be that? No wonder gold is rising – the alternative currency with no liability.
Chart of the Week
US Job Numbers
U.S. Nonfarm Payrolls, Unemployment Rate 2021–2026

Source: www.tradingeconomics.com, www.bls.gov
Following a week of volatility and drama, it was almost a relief that the December U.S. job numbers came in largely as expected. Nonfarm payrolls rose 50,000 in December, roughly on estimate. The unemployment rate fell to 4.4% from 4.5%. The U6 unemployment rate, the highest reported by the Bureau of Labour Statistics (total unemployed, plus all persons marginally attached to the labour force, plus total employed part-time for economic reasons, as a percent of the civilian labour force, plus all persons marginally attached to the labour force (U-6)) fell to 8.4% from 8.7%, in some ways a dramatic drop.
The prior two months were revised down by 76,000. Over the past year, nonfarm payrolls have been steadily falling, averaging only about 49,000/month, well down from the previous 12 months’ average of 167,000/month. The labour force retracted by 46,000 (deportations?) while the number considered not in the labour force rose 929,000. The labour force participation rate fell to 62.4 from 62.5, while the employment population rate rose to 59.7 from 59.6. There is an army of people considered not in the labour force. Only a certain percentage of them are employable because their expertise is not necessarily where the needs are or they lack the skills required. The category also includes retirees, full-time students, the disabled, and stay-at-home caregivers.
Oddly, the employment level rose 232,000, with full-time employment up 890,000 and part-time employment down 740,000. This sounds weird, but it may be that those who were let go during the shutdown went back to work full-time from part-time. We note that, because of the shutdown, October numbers are not available. The employment level rose by 232,000 while the unemployment level fell by 279,000. The population level rose by 183,000. The number of multiple job holders fell by 444,000. Prime gainers of jobs were in health care, social assistance, leisure and hospitality, while employment fell in construction, retail, and manufacturing.
As to the length of unemployment, the number for those unemployed 27 weeks or longer fell by 2,000 while the average weeks unemployed rose to 24.4 weeks vs. 23.1 weeks. The median weeks unemployed rose to 11.1 weeks from 10 weeks.
The response was that stocks rose, bonds were steady, and gold and silver rose. Expectations are now that the Fed will stay on hold for the time being, awaiting further numbers. That, of course, won’t please President Trump, who is expected to name the new Fed chief sometime this month. For Powell to cut rates, inflation must fall further, and unemployment must rise further.
The Fed next meets on January 27–28. That meeting’s going to be an interesting one.
Canada Job Numbers
Canada Employed Persons, Unemployed Persons 2021–2026

Source: www.tradingeconomics.com, www.statcan.gc.ca
Canada’s employment gains continue, despite all that is happening behind with tariffs, etc., and Canada’s ongoing economic war with the U.S. Employment gains in December were 8,200, well behind November’s gain of 53,600. However, that should come as no surprise. The previous three months saw employment gains of 181,000. Forecasters had expected a decline of 5,000. Full-time employment jumped 50,200, while part-time employment fell 42,000. The labour force participation rate rose to 65.4% from 65.1%. More people were working, so, as no surprise, that impacted the unemployment rate, which rose to 6.8% from 6.5%. The R8 unemployment rate (plus discouraged searchers, waiting group, and portion of involuntary part-timers) rose to 8.5% from 8.4%. The rise in unemployment rates isn’t surprising, given that Canada saw an influx of 81,000 into the labour force. Many newcomers weren’t finding jobs yet.
Gains were primarily in health care, social assistance, and repair services, while employment in professional, scientific, and technical services fell. Employment gained in Quebec but fell in Alberta. Most of the influx of entrants into the labour force occurred in Ontario. The number of unemployed persons rose by 72,900 – no surprise, given the rise in unemployment and the influx of entrants to the labour force.
Canada is feeling the strain of the ongoing trade dispute with the U.S. It’s impossible to avoid. Canada added 263,000 new jobs in 2025, barely a gain from 2024. Job vacancies also fell, indicating softer hiring needs. Areas that can avoid the trade disputes fared best – hence, the gain in health care and social assistance.
The Bank of Canada (BofC) next meets on January 28. It will be a quandary for Tiff Macklem and the BofC in deciding whether to cut rates or not.
Markets and Trends
|
|
|
|
% Gains (Losses) Trends |
|
||||
|
|
Close Dec 31/25 |
Close Jan 9/26 |
Week |
YTD |
Daily (Short Term) |
Weekly (Intermediate) |
Monthly (Long Term) |
|
|
|
|
|
|
|
|
|
||
|
S&P 500 |
6,845.50 |
6,966.28 (new highs) * |
1.6% |
1.8% |
up |
up |
up |
|
|
Dow Jones Industrials |
48,063.29 |
49,504.07 (new highs) * |
2.3% |
3.0% |
up |
up |
up |
|
|
Dow Jones Transport |
17,357.19 |
18,184.62 (new highs) |
3.7% |
4.8% |
up |
up |
up |
|
|
NASDAQ |
23,241.99 |
23,671.35 |
1.9% |
1.9% |
up |
up |
up |
|
|
S&P/TSX Composite |
31,712.76 |
32,612.93 (new highs) * |
2.3% |
2.8% |
up |
up |
up |
|
|
S&P/TSX Venture (CDNX) |
987.74 |
1,052.18 (new highs) |
6.0% |
6.5% |
up |
up |
up |
|
|
S&P 600 (small) |
1,467.76 |
1,543.51 (new highs) |
4.1% |
5.2% |
up |
up |
up |
|
|
ACWX MSCI World x US |
67.18 |
69.25 (new highs) * |
2.5% |
3.1% |
up |
up |
up |
|
|
Bitcoin |
87,576.98 |
90,304.99 |
0.4% |
3.1% |
up (weak) |
down |
up |
|
|
|
|
|
|
|
|
|
|
|
|
Gold Mining Stock Indices |
|
|
|
|
|
|
|
|
|
Gold Bugs Index (HUI) |
701.49 |
763.21 (new highs) * |
8.9% |
8.8% |
up |
up |
up |
|
|
TSX Gold Index (TGD) |
817.76 |
897.22 (new highs) * |
9.7% |
9.7% |
up |
up |
up |
|
|
|
|
|
|
|
|
|
|
|
|
% |
|
|
|
|
|
|
|
|
|
U.S. 10-Year Treasury Bond yield |
4.17% |
4.17% |
(0.5)% |
flat |
|
|
|
|
|
Cdn. 10-Year Bond CGB yield |
3.44% |
3.39% |
(2.3)% |
(1.5)% |
|
|
|
|
|
Recession Watch Spreads |
|
|
|
|
|
|
|
|
|
U.S. 2-year 10-year Treasury spread |
0.69% |
0.63% |
(11.3)% |
(8.7)% |
|
|
|
|
|
Cdn 2-year 10-year CGB spread |
0.85% |
0.84% |
(2.3)% |
(1.2)% |
|
|
|
|
|
|
|
|
|
|
|
|
|
|
|
Currencies |
|
|
|
|
|
|
|
|
|
US$ Index |
98.26 |
99.13 |
0.7% |
0.9% |
up (weak) |
neutral |
down |
|
|
Canadian $ |
72.87 |
0.7187 |
(1.3)% |
(1.4)% |
neutral |
up (weak) |
down (weak) |
|
|
Euro |
117.48 |
116.38 |
(0.7)% |
(0.9)% |
down (weak) |
up |
up |
|
|
Swiss Franc |
126.21 |
124.89 |
(1.0)% |
(1.1)% |
down (weak) |
up |
up |
|
|
British Pound |
134.78 |
134.07 |
(0.4)% |
(0.5)% |
down (weak) |
neutral |
up |
|
|
Japanese Yen |
63.83 |
63.33 |
(0.7)% |
(0.8)% |
down |
down |
down |
|
|
|
|
|
|
|
|
|
|
|
|
|
|
|
|
|
|
|
|
|
|
Precious Metals |
|
|
|
|
|
|
|
|
|
Gold |
4,311.97 |
4,508.58 |
4.1% |
4.6% |
up |
up |
up |
|
|
Silver |
71.16 |
79.34 |
9.2% |
11.5% |
up |
up |
up |
|
|
Platinum |
124.81 |
2,278.00 |
6.3% |
11.3% |
up |
up |
up |
|
|
|
|
|
|
|
|
|
|
|
|
Base Metals |
|
|
|
|
|
|
|
|
|
Palladium |
1,619.50 |
1,874.00 |
12.2% |
15.7% |
up |
up |
up |
|
|
Copper |
5.64 |
5.84 (new highs) * |
3.4% |
3.6% |
up |
up |
up |
|
|
|
|
|
|
|
|
|
|
|
|
Energy |
|
|
|
|
|
|
|
|
|
WTI Oil |
57.44 |
58.80 |
2.6% |
2.4% |
up (weak) |
down |
down |
|
|
Nat Gas |
3.71 |
3.16 |
(13.4)% |
(14.8)% |
down |
down (weak) |
neutral |
|
Source: www.stockcharts.com
* New All-Time Highs
Note: For an explanation of the trends, see the glossary at the end of this article.
New highs/lows refer to new 52-week highs/lows and, in some cases, all-time highs.
Source: www.stockcharts.com
A positive start to the new year. Stock market bulls must be happy with that. On the week, the S&P 500 (SPX) rose 1.6%, the Dow Jones Industrials (DJI) was up 2.3%, the Dow Jones Transportations (DJT) gained 3.7%, while the NASDAQ was up 1.9%. SPX and DJI made new all-time highs. DJT made new 52-week highs and is closing in rapidly on the 2021 all-time high. The NASDAQ failed to follow. A divergence? The odds suggest we’ll make that new high for the DJT and possibly for the NASDAQ as well. The S&P 400 (Mid) was up 3.3% while the S&P 600 (Small) rose 4.1%. The S&P 500 Equal Weight Index (SPXEW) rose 2.5% while the NY FANG Index was up 1.6%. The Mid and Small both made 52-week highs, and the SPXEW made all-time highs, in line with the SPX.
In Canada, the TSX Composite gained 2.3% and the TSX Venture Exchange (CDNX) was up 6.0%. Bitcoin kept pace, gaining 0.4%, but it’s sorely lagging and nowhere near its former high. In the EU, the London FTSE rose 1.8% to new all-time highs, the Paris CAC 40 was up 2.1%, the German DAX gained 2.9% to new all-time highs, while the EuroNext was up 2.1% to new all-time highs. In Asia, China’s Shanghai Index gained 3.8% to new 52-week highs, the Tokyo Nikkei Dow rose 3.2%, and Hong Kong’s Hang Seng (HSI) fell 0.4%. We’ve added India’s Nifty Fifty Index, which started the year down 2.5%. The MSCI World Index (ex USA) represented by the ETF rose 1.6% to new all-time highs.
All in all, a good start for 2026. Our first five days’ indicator saw the S&P 500 gain 1.8 for the week, potentially a positive sign for markets in 2026. Now we await all of January for the January effect.
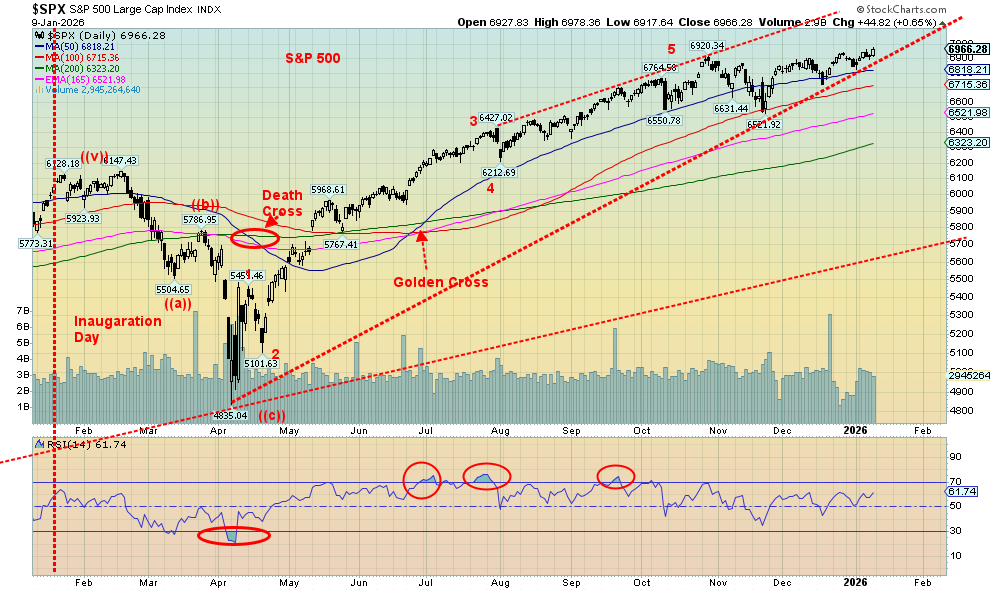
The technical pattern for the SPX looks positive, so we are continuing to expect higher prices. That recent low in November near 6,500 is key. A break of that level could signal further losses. Long-term support is near 6,300. There is room to move higher in that bull channel. Currently, the top is nicely over 7,000. As we noted in our opening, we expect that stocks could do well in the first half of 2026, but as to the second half, maybe not so well.
2025 was a good year as SPX rose 16.4%, DJI was up 13.0%, DJT gained 9.2%, and the NASDAQ was up 20.4%. Of the foreign indices we follow (setting aside Canada), the winner was Hong Kong’s Hang Seng (HSI), up 27.8%. The FTSE, the DAX, and TKN all had gains above 20%. 2025 was a happy year, even as all around things were deteriorating.
Selected Performance since Inauguration Day, January 20, 2025

Source: www.stockcharts.com
Starting the new year, gold is still comfortably in the lead since Election Day in November 2024, up almost 67%. At the other end is WTI oil, down 24% while Bitcoin is also down 13.1% and the US$ Index is down 9.3%. A distant second is the ETF representing the MSCI World Index (ex USA), up 35.3%. The S&P 500 is up 16.2% and the TSX is up 30.1%. Silver, which is not on this chart, is up 161%. Hi-ho, silver.
Fear & Greed Index

Source: www.cnn.com
This is the CNN Fear & Greed Index, a measurement of fear and greed in the stock markets. It measures from extreme greed to extreme fear. For analysts, it is another tool in the toolbox to measure the psychology of the stock market.
The Fear & Greed Index is a way to gauge stock market movements and whether stocks are fairly priced. The theory is based on the premise that excessive fear tends to drive down share prices, and too much greed tends to have the opposite effect.
How is the Fear & Greed Index Calculated?
The Fear & Greed Index is a compilation of seven different indicators that measure some aspect of stock market behavior. They are: market momentum, stock price strength, stock price breadth, put and call options, junk bond demand, market volatility, and safe haven demand. The index tracks how much these individual indicators deviate from their averages compared to how much they normally diverge. The index gives each indicator equal weighting in calculating a score from 0 to 100, with 100 representing maximum greediness and 0 signaling maximum fear.
Currently at 51, the market is neutral.

Source: www.stockcharts.com
Is the NASDAQ our laggard, the canary in the coal mine? Are the days of the Magnificent 7 numbered? All appear to be rolling over. Sure, the NASDAQ was up 1.9% in the first week of 2026, but it lagged the SPX, DJI, and DJT. It even lagged the SPXEW. The NY FANG Index gained only 1.6%, also a laggard. The SPX and DJI made new all-time highs while the DJT made 52-week highs, inching closer to new all-time highs. We look over at the MAG7 and note that Apple fell 4.2% to start the year. The others were up, with the big winner being Amazon, up 9.3%. Google gained 4.4% to new all-time highs. None of the others did. Netflix fell 1.7% while Broadcom was off 0.8%. NASDAQ volume has tailed off. The pattern being formed by the NASDAQ could be a symmetrical triangle top. On the other hand, we could also give it bullish characteristics. The break will tell us which way. Above 24,000, we go higher; below 22,800, we go lower. The FAANGS led the way up. Has new leadership taken over?
Source: www.stockcharts.com
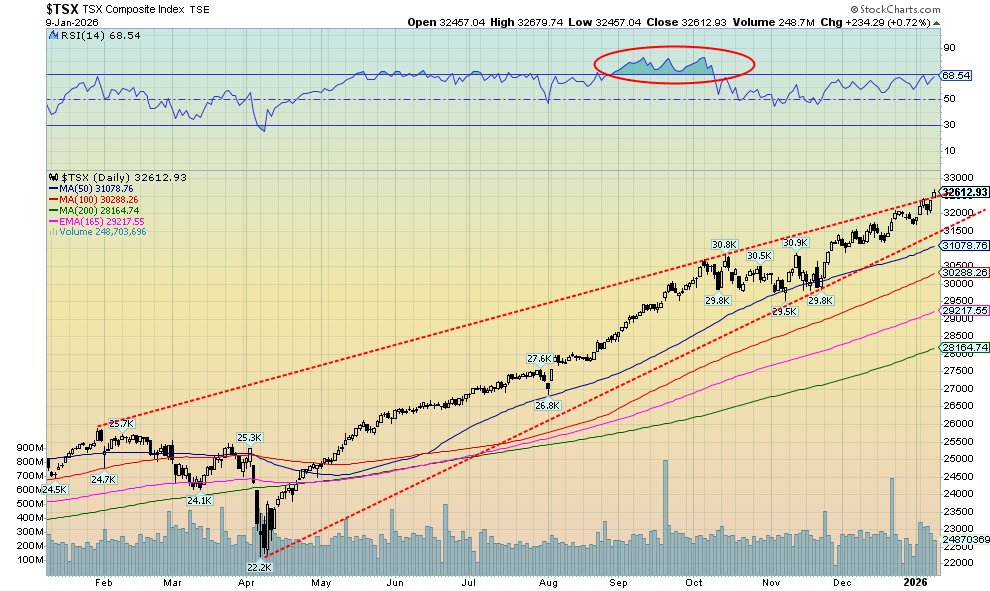
The TSX Composite wiggled its way to new all-time highs once again this past week. The TSX jumped 2.3% and is up 2.8% on the year so far. 2025 saw a stellar performance for the TSX, up 28.3% vs. the S&P 500, up 16.4%. The TSX even beat the NASDAQ, which was up 20.4%. As to the sub-indices in 2025, the winners were Golds (TGD), up 142.7%, Metals & Mining (TGM), up 82.5%, and Materials (TMT), up 98.2%. Other strong performers were Financials (TFS), up 30.8%, and Consumer Discretionary (TCD), up 28.2%. The only loser was Health Care (THC), down 14.9% in 2025. It was Materials (golds, metals, forestry) that helped push the TSX to record levels.
Are we breaking out? It’s hard to say yet. A move above 33,000 would confirm a breakout. Support appears to be good down to around 30,000. Under 29,000, we could be in trouble with longer-term support down to 28,000. What’s key is the Materials sector, off to a good start in 2026 already. This past week, Consumer Discretionary, Financials, Golds, Metals & Mining, and Materials all made fresh all-time highs. They remain the areas to be in.

Source: www.stockcharts.com
The TSX Venture Exchange (CDNX) closed above its October highs this past week – not by much, but above. Since the “Liberation Day” low in April 2025, the CDNX has gone up almost 93%. The CDNX gained 65% in 2025 and was up 6% this past week to new highs. The CDNX is around/over 50% junior mining developers or small producers. At just over 1,000, the index has substantial room before it could challenge the 2007 all-time high near 3,300. Volume has been ticking up on the recent up move, even as we have moved to overbought territory. But overbought has been seen twice, just in the past seven months. After a correction, we start up again. We suspect the junior miners are just getting underway. For 2025, they lagged their more senior miners that form the TSX Gold Index (TGD) and Gold Bugs Index (HUI). A catch-up may be underway. 3000 is still 2000 points from current levels, and those junior miners can move higher quickly when investors switch their focus from the seniors to the juniors. Without the juniors, where would the seniors find their product?
U.S. 10-year Treasury Note, Canada 10-year Bond CGB

Source: www.tradingeconomics.com, www.home.treasury.gov, www.bankofcanada.ca
After all the goings-on of the past week and the increase in volatility, the U.S. Treasury market essentially flatlined. The U.S. 10-year Treasury note closed at 4.17%, down 2 bp from the previous week. Canada fell even more, with the 10-year Government of Canada bond down 8 bp. The 2–10 spreads were largely unchanged and continue to point to a recession. The Friday job numbers didn’t do much for bond yields. The expectation so far is for two rate cuts in 2026, with some predicting four. We also get the appointment of a new Fed Chairman, possibly this month. Jerome Powell’s tenure doesn’t end until May. President Trump has been pushing for a dovish Fed Chair and is slowly trying to get his appointees as Fed governors as well. How the market might view that is unknown.
Both bonds appear to be correcting following a recent rise from lows seen in October. At the other end, we still have a way to go to take out the recent highs. Bonds reflected uncertainty this past week. The U.S. economy is weakening, but inflation remains sticky. In Canada, under 4.05% U.S., under 3.30% one could expect lower yields. Above 4.20% and 3.45%, we are going higher.
Source: www.tradingeconomics.com, www.umich.edu
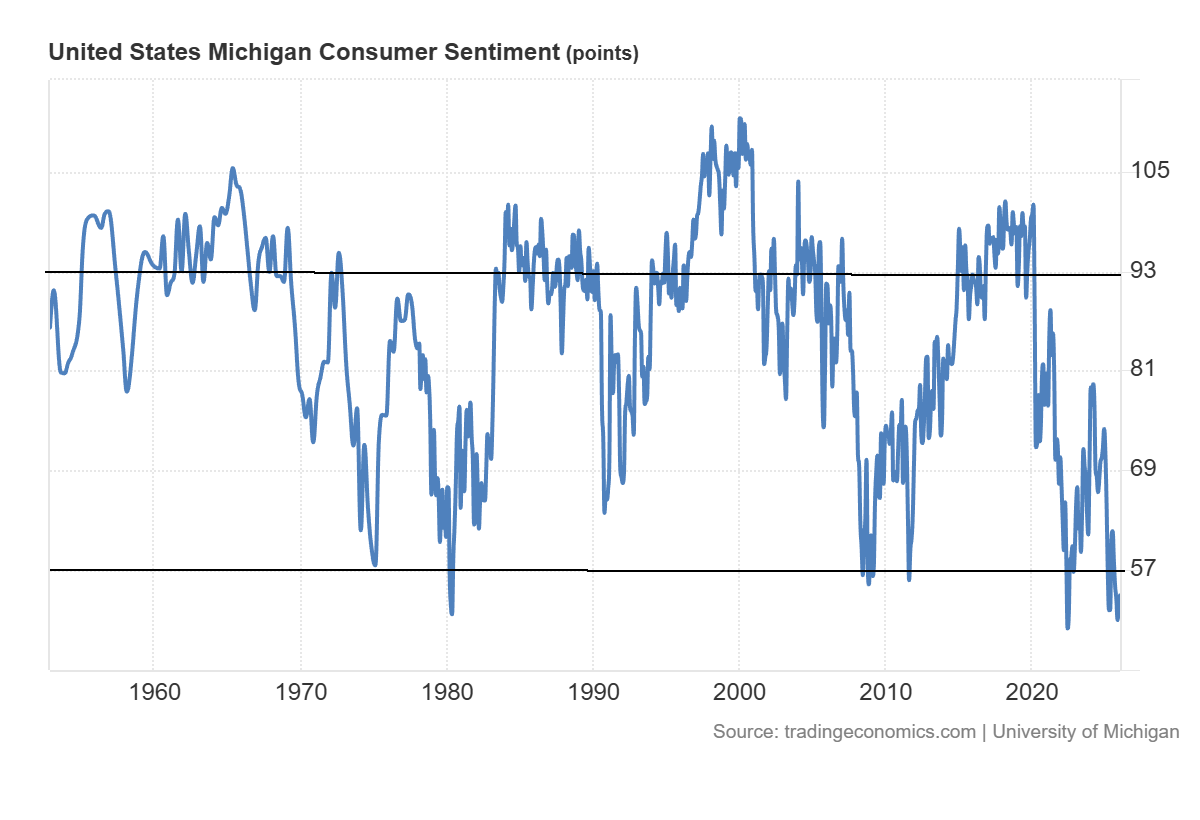
This chart is the first preliminary reading of the University of Michigan Consumer Sentiment Index. It has ticked up a bit for the second consecutive month. It is mildly better than the expected 53.5 vs. 54 actual. Nonetheless, sentiment in the U.S. remains buried in the cellar. And as we have pointed out many times, it’s at levels that were seen at the bottom of the 1980–1982 recession/bear market and the 2020 pandemic and mini-crash. Concerns appear to be limited to economic issues, ignoring the growing strife on the streets of several cities. Still, the reading is some 25% below a year ago. Inflation expectations remain high at 4.2%. We’d hardly view this minor improvement as being significant.

Source: James W., fixed income portfolio manager, Prudential Asset Management, Hong Kong
We couldn’t resist showing this chart of Venezuelan bonds. Venezuelan bonds have soared since the capture of Maduro, on the expectation that happy days are here again, so buy Venezuelan securities. Trade of the year? Okay, only if you are an institution. James W. discusses Venezuelan bonds here: https://www.linkedin.com/posts/james-w-stuff_bonds-oil-fidelity-activity-7414410023042375680-qrw1?utm_source=share&utm_medium=member_desktop&rcm=ACoAADO6GAABmcaCagsEwtNQecZTccU80xFok14

Source: www.stockcharts.com
Is the U.S. dollar still a safe haven? That could be the case as the US$ Index started off the year with a gain of 0.7%. Other currencies suffered with the euro down 0.7%, the Swiss franc off 1.0%, the pound sterling down 0.4%, and the Japanese yen off 0.7%. The Cdn$ fell 1.3% as it was triggered by fears about Venezuelan oil and a rise in the unemployment rate.
Despite the rise in the US$ Index, the bullion indices (gold, silver, and platinum) enjoyed a strong week. We look at the preceding chart and see potential for a further rise for the US$ Index. Instead of breaking down, we appear to be making a possible bottom pattern. Since that five-wave collapse into an April 2025 low at 97.92, we have failed to successfully break down even as we made new lows. However, the movements have all been corrective, suggesting that this could end with a run to higher levels for the US$ Index. Based on the pattern, a firm break above the recent high at 100.39 could see a run to 105–106. We’re currently hanging around the 200-day MA (98.75), so new highs above 100.39 could see the start of a move higher. The U.S. dollar is still viewed globally as not only the reserve currency but the currency of choice when geopolitical tensions rise. Money is coming in from elsewhere, but it’s going into gold/silver and U.S. stocks, not necessarily U.S. treasuries.
Irrespective of a rise in the US$ Index, we continue to expect gold/silver to perform well in Q1.
Source: www.stockcharts.com
2025 was a golden year. Gold rose 63%, silver was up 143%, and platinum gained 125%. Even the near precious metals chimed in with palladium up 78% and copper up 40%. Copper, the laggard, could be the surprise of 2026, given falling supply and rising demand (AI, military, etc.)
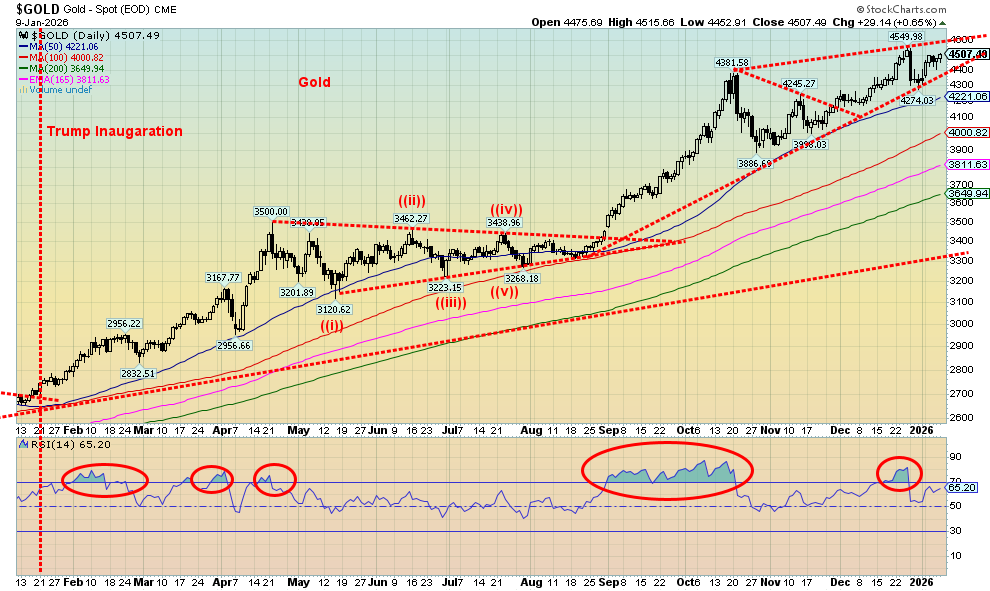
This past week, gold rose from the mini-crash of December 29, 2025, up 4.1% and up 4.6% since December 31, 2025. Is another golden year on its way? We are always wary of potential surprises, so taking profits as one moves higher is a wise idea. Strong bull markets for gold have happened before. The most notable ones were during 1976–1980, when gold rose 700% and in 2008–2011, when gold rose 182%. Note that we didn’t count from the absolute lows but from the point where a strong up move got underway. In this round, the absolute low was in December 2015 at $1,045. But this move started in October 2022 at $1,614. Since then, we are up 180%, pretty much the same as in 2008–2011. We are expecting more.
The reasons for owning gold have not budged. Geopolitical and domestic political instability, a slowing economy, debasing of fiat currencies, and falling interest rates encourage moving to gold as a safe haven. As we always note, gold has no liability. It’s been the ultimate safe haven for 3,000 years and the reserve currency or a system of gold-backed currencies for centuries. The current fiat experiment got underway in August 1971 when President Richard Nixon took the world off the gold standard. Note that upwards of 99% of all fiat currencies have ultimately failed.
Sloppy job numbers this past week, thoughts of rate cuts in 2026 (the current prediction is for two), the appointment of a dovish Fed Chairman, continued geopolitical tensions (Venezuela), and domestic unrest (clashes on the street vs. ICE), also clashes in Iran and the threat of attacks on the country are among some of the reasons why gold should continue to rise into 2026.
Gold was up 4.1% this past week, silver up 9.2%, and platinum gained 6.3%. Palladium was up 12.2% while copper jumped 3.4%, setting new all-time highs at $6.06 before settling at $5.84. The gold stocks soared with the Gold Bugs Index (HUI) up 8.9% and the TSX Gold Index (TGD) up 9.7%, both to new all-time highs.
A break of $4,275 would be of concern. Under $3,890 points to even lower prices. Nonetheless, we see no sign of a top. We’ve already passed the point that would suggest new highs ahead ($4,485 vs. the close $4,509). Stay long but be wary of break points. We’re setting up for another golden year, but remember that anywhere along the line, a sharp correction could take place. Volatility reigns.

Source: www.stockcharts.com
Hi-ho silver, away! Silver appears to be starting off the New Year where it left off in 2025. After a 143% gain, what could silver do next? Well, how about 9.2% in the first week and 11.5% up since December 31, 2025? Yes, there is that rather niggly, potentially key reversal day seen on December 29, 2025. We hit a high (all-time) of $83.62 and then reversed, closing down almost 9% at $72.15. We have since recovered, but we are uncertain at this time of new highs. However, given that the reversal day was a result of the CME raising margin requirements, sparking margin calls and a mini-panic, and not due to fundamental reasons, recovery is possible. There is still the fact that there are roughly 365 ounces of paper silver for every ounce of physical silver. Physical silver is in short supply, selling at premiums to paper silver. But we need new highs to confirm that. Exceeding $80.82 on a close basis raises the odds of new highs. We did rise above that level, but did not close above $80.82.
With gold stocks making new highs this past week, it raises the odds that both gold and silver will make new highs once again. A steady stream of analysts is calling for new highs in 2026, including some fantastical predictions for gold at $5,000 or higher and silver at $100, even $200. It’s not to disbelieve them, but remember they are opinion forecasts. Our preferred route is setting a target, but be wary of where the breakdown points are. Currently, silver is fine. As long as it stays above $69.25, the chance of a mini panic is low. It had been a steep rise from that consolidation pattern seen in October/November 2025, so a pause was no doubt expected as we became quickly overbought. And so far, that’s all it is: a pause to ease the overbought conditions.
As we noted with gold, the conditions that brought us here remain. The trend is up, stay long, add on dips.
Source: www.stockcharts.com
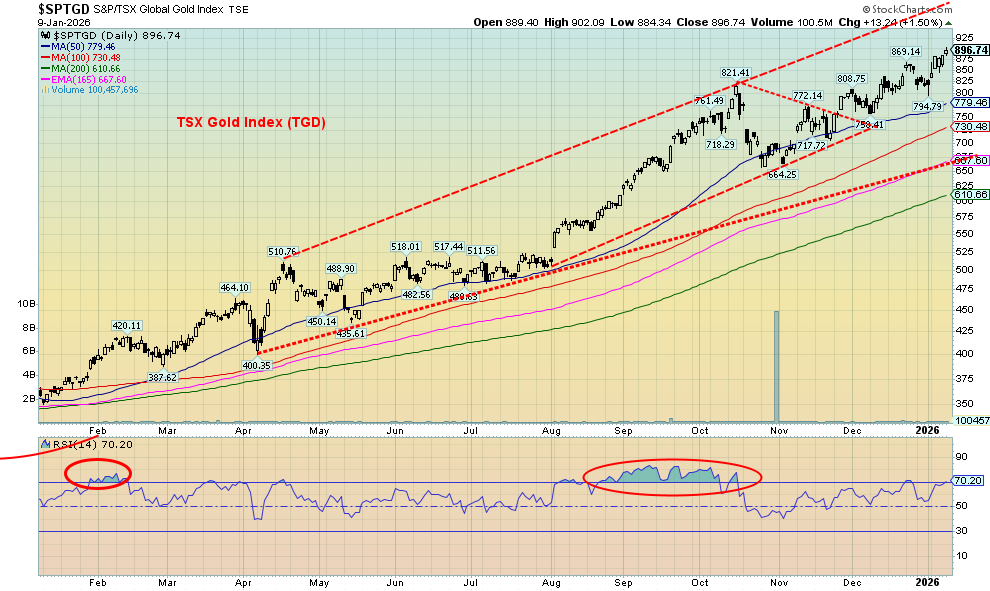
The gold stocks took off in 2026 the way they ended in 2025, rising sharply. On the week, the TSX Gold Index (TGD) rose 9.7% while the Gold Bugs Index (HUI) jumped 8.9%. This follows gains of 142.8% and 154.6% respectively, in 2025. Gold stocks have been the stars. We are also seeing more positive signs with the junior developers that dominate the TSX Venture Exchange (CDNX). If they explode upward, as we noted earlier, 2026 promises to be a good year. As well, both the TGD and the HUI once again made all-time highs. But beware of the sharp spike.
By the week’s end, the RSI was just over 70, in overbought territory. No, that doesn’t signal an immediate pullback. In the most recent surge into August/October, the RSI remained consistently above 70 before a much-needed correction set in. It has been a spectacular ride for the gold stocks, as it was the place to be in 2025. A reminder, however, that the surge in 1979 and 2010–2011 ended abruptly. The subsequent fall wiped out some 80% of the gain. Taking profits as we go higher is a wise idea, even if one misses the actual top.
Nonetheless, like gold and silver, the conditions remain positive. That is, until they aren’t. The TGD has support down to 760, but under 665, a steeper correction would set in.
Source: www.stockcharts.com
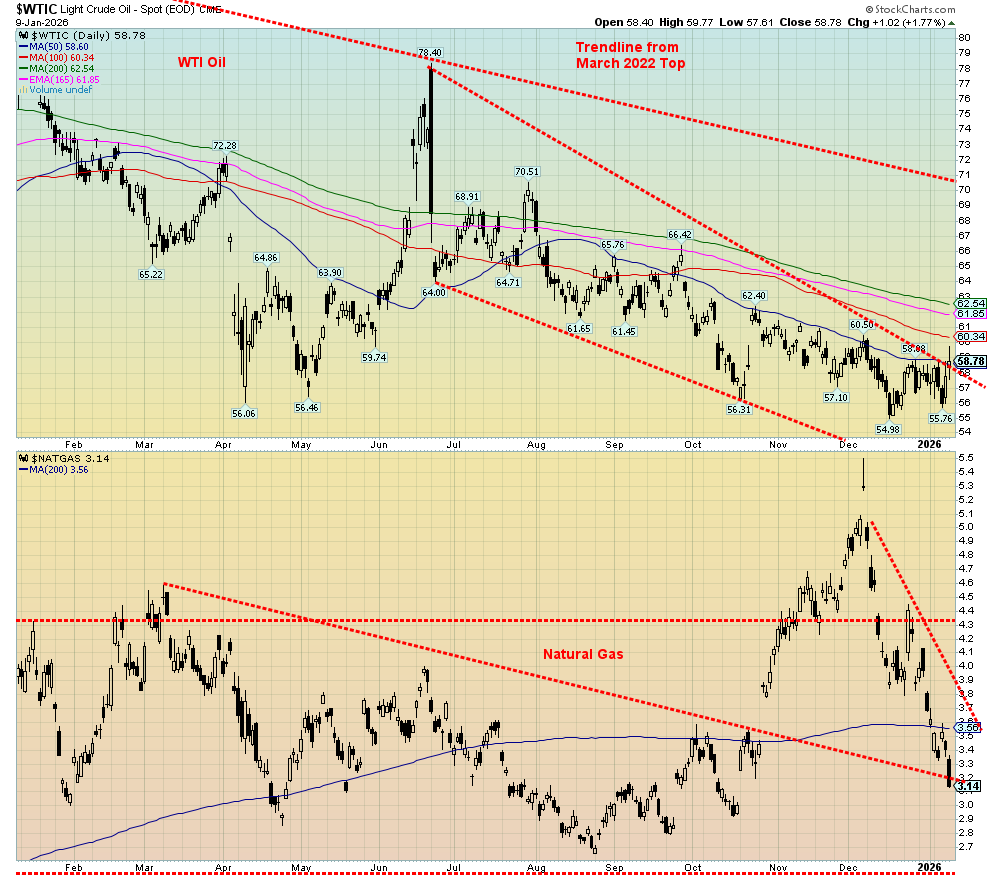
No peace deal between Russia/Ukraine; Maduro of Venezuela has been seized, but the regime remains in place; U.S. oil companies will not invest in Venezuelan oil without security, or, as the oil company executives say, Venezuela is uninvestible; continued seizure of Venezuelan oil tankers, including a Russian-flagged tanker; unrest in Iran, potentially threatening to tighten supplies. All that helped WTI oil and Brent crude rise for the third week in a row. WTI rose 2.6%, while Brent crude rose 3.7%. All things considered, it was a pretty lame rise.
Natural gas (NG) fell, thanks to forecasts for warmer weather that help reduce demand. NG at the Henry Hub fell 13.4% but NG at the EU Dutch Hub dropped only 1.0%. The energy stocks didn’t do much, with the ARCA
Oil & Gas Index (XOI) up about 2.0%. However, the TSX Energy Index (TEN) fell 2.2%, fueled by fears that Venezuelan oil would come on stream quickly, thus dampening demand for Canadian oil. However, it looks like that’s not happening, so the TEN was bouncing back by the week’s end.
It was all a somewhat volatile start to the new year, but in the end, movement wasn’t really that much, except for the sharp drop in Henry Hub NG. However, what happens in the weeks ahead may be more positive for oil prices, which have remained down through 2025. In 2025, WTI oil fell almost 20%, making it one of the weakest commodity performers. No wonder the Commodity Research Bureau Index (CRB) only rose a feeble 0.5% in 2025. Energy is the largest component.
Is WTI trying to break that descending wedge triangle? Possibly, but it’s not clear just yet. We’re starting a potential rise as WTI oil’s recent low was a higher low. However, we need to successfully break over $63 to help confirm a breakout – otherwise, this is just another wiggle.
We remain bullish on energy prices for 2026. Notably, while oil was falling in 2025 and NG was barely up, the energy stocks represented on the XOI and the TEN rose 5.3% and 12.5% respectively. We view that divergence as positive for energy going forward.
2026 is off with a bang in the first week. Will it continue?
Copyright David Chapman 2026
GLOSSARY
Trends
Daily – Short-term trend (For swing traders)
Weekly – Intermediate-term trend (For long-term trend followers)
Monthly – Long-term secular trend (For long-term trend followers)
Up – The trend is up.
Down – The trend is down
Neutral – Indicators are mostly neutral. A trend change might be in the offing.
Weak – The trend is still up or down but it is weakening. It is also a sign that the trend might change.
Disclaimer
David Chapman is not a registered advisory service and is not an exempt market dealer (EMD) nor a licensed financial advisor. He does not and cannot give individualised market advice. David Chapman has worked in the financial industry for over 40 years including large financial corporations, banks, and investment dealers. The information in this newsletter is intended only for informational and educational purposes. It should not be construed as an offer, a solicitation of an offer or sale of any security. Every effort is made to provide accurate and complete information. However, we cannot guarantee that there will be no errors. We make no claims, promises or guarantees about the accuracy, completeness, or adequacy of the contents of this commentary and expressly disclaim liability for errors and omissions in the contents of this commentary. David Chapman will always use his best efforts to ensure the accuracy and timeliness of all information. The reader assumes all risk when trading in securities and David Chapman advises consulting a licensed professional financial advisor or portfolio manager such as Enriched Investing Incorporated before proceeding with any trade or idea presented in this newsletter. David Chapman may own shares in companies mentioned in this newsletter. Before making an investment, prospective investors should review each security’s offering documents which summarize the objectives, fees, expenses and associated risks. David Chapman shares his ideas and opinions for informational and educational purposes only and expects the reader to perform due diligence before considering a position in any security. That includes consulting with your own licensed professional financial advisor such as Enriched Investing Incorporated. Performance is not guaranteed, values change frequently, and past performance may not be repeated.
About the author


Website: https://www.enrichedinvesting.com
Disclaimer: David Chapman is not a registered advisory service and is not an exempt market dealer (EMD) nor a licensed financial advisor. We do not and cannot give individualised market advice. David Chapman has worked in the financial industry for over 40 years including large financial corporations, banks, and investment dealers. The information in this newsletter is intended only for informational and educational purposes. It should not be considered a solicitation of an offer or sale of any security. The reader assumes all risk when trading in securities and David Chapman advises consulting a licensed professional financial advisor before proceeding with any trade or idea presented in this newsletter. David Chapman may own shares in companies mentioned in this newsletter. We share our ideas and opinions for informational and educational purposes only and expect the reader to perform due diligence before considering a position in any security. That includes consulting with your own licensed professional financial advisor.