
“Let me put it this way: I'm standing in front of a burning house, and I'm offering you fire insurance on it.”
—Jared Vennett, speaking about credit default swaps (CDS), played by Ryan Gosling from The Big Short (2015)
“Look at these people. Wandering around with absolutely no idea what's about to happen.”
—Peter Sullivan, played by Zachary Quinto from Margin Call (2011)
“When the dust settled from the collapse, 5 trillion dollars in pension money, real estate value, 401k, savings, and bonds had disappeared. 8 million people lost their jobs, 6 million lost their homes. And that was just in the USA.”
—epilogue, The Big Short (2015)
There is a scene in The Big Short (2015) where Jared Vennett (Ryan Gosling) is seen walking into a toilet talking on the phone with Mark Baum (Steve Carell) and Baum says to Vennett, “Jared? It’s chaos down here! Where are we at?” Vennett replies, “And Caesar wept, for there were no more worlds to conquer.” It was at that moment both realized the world was about to come unraveled. Vennett referred to J.P. Morgan taking some heavy losses and he says to Baum, “Your ship might be taking on water. Might be time to get our lifejacket and get out.” The irony that Vennett was speaking from a toilet was not lost. When the dust cleared, the Dow Jones Industrials (DJI) was down 54% from its October 2007 high. The S&P 500 was down 57%. Other markets were down even more. It was September 2008. Lehman Brothers had collapsed.
We were sitting on a bank money/foreign exchange dealing desk on October 19, 1987 when chaos broke out, culminating in the crash of ‘87 that saw upwards of one-third wiped off of stock markets in a heartbeat. The event turned out to be only a very sharp correction in a long bull market that started in August 1982 and ended in January/March 2000. Still, it took until Q1 1990 before the DJI recovered its August 1987 high. As always, stock markets proved that at the end of the day they always go up. One just has to endure the corrections and the bear markets that happen along the way.
In our working lifetime in the markets, we’ve experienced seven market crashes of varying depths and been through eight recessions. The next one may soon be upon us.
Inflation lowers the value of the stock market. At 7% inflation one has to earn a return of 8% just to obtain a 1% return after inflation. It took until 1954 (25 years) on a nominal basis for the DJI to regain its September 1929 high. But it took until 1958 (29 years) for the DJI to regain its September 1929 high on an inflation-adjusted basis. Same with the 1966–1982 bear. On a nominal basis the stock market cleared its series of highs by 1983. But on an inflation-adjusted basis it took until 1994. The bear market of 2000–2009 saw its 2000 high taken out by 2012. But on an inflation-adjusted basis it took until 2015/2016. Japan is still looking for its highs
of January 1990 some 32 years later.
Recessions are not uncommon. Depressions are less common. We’ve actually had two depressions in the past 125 years: The Great Depression of 1929–1933, which really lingered as the Great Depression and war of 1929–1949, plus the overlooked one—the short-lived depression of 1920–1921 that followed World War I and the Spanish Flu pandemic.
We’ve also had 24 recessions during that period as well. That’s one every five years at least. The 25th may soon be upon us. Will it also be accompanied by a crash? The probability is good. We’ve come through a pandemic and now a war is upon us. There is little doubt that it will cause disruptions in the global economy. We are already seeing it through the financial sanctions, sharply-rising commodity prices, and supply-chain disruptions.
The sanctions not only target individuals in Russia but also banks and, most importantly, the central bank: the Central Bank of the Russian Federation or, more colloquially, the Bank of Russia (CBR). The sanctions prevent the CBR from accessing at least half of the $634 billion they hold in foreign reserves. They also block the CBR’s ability to convert assets held in U.S. dollars and euros to rubles. The measures also prevent it from tapping into its emergency sovereign wealth fund and the National Wealth Fund (NWF). Some Russian banks were cut off from SWIFT, the global payment system. The U.S. was also looking into how to prevent Russia from selling its gold reserves, a move that could rock the gold market, tightening supplies. Russian refiners have already been banned from the LBMA.
All of this alone brings into question whether your foreign reserves really yours, it questions the integrity and safety of holding reserves in other jurisdictions, and it also questions the integrity and safety of the global payments system SWIFT. The entire global financial system comes into question. Is this the equivalent of the financial nuclear option? As one pundit stated, “if you don’t hold it, you don’t own it.” This also brings into question the viability of the U.S. dollar as the world’s reserve currency.
Russia is now the most sanctioned country in the world, far surpassing number two, Iran. Other sanctioned countries besides Iran include Syria, North Korea, Venezuela, Myanmar, and Cuba. One major difference, however, is that none of the others, either individually or collectively, come anywhere near the national debt of Russia, estimated at $310 billion and the external debt of Russia, estimated at $610 billion.
A default by Russia, something which many are now acknowledging could happen, could shake the global financial system to its core. Contagion is a word that the central banks of the world don’t want to hear. But a Russian default could set off a round of contagion that impacts not just the debt directly held but which could spread throughout the entire financial system, especially through the trillion-dollar world of global derivatives. Some $41 billion is tied up in Credit Default Swaps (CDS) and if Russia defaults, somebody(s) will have to pony up $41 billion. Recall that in 2008 AIG, through subsidiary AIG Financial Products, was brought to its knees because of CDSs written on billions of dollars of debt that had now defaulted. AIG could not cover the subsequent call. For every dollar of Russian debt there is more debt behind it that could also be in jeopardy. Debt default begets debt default begets debt default. Do the central banks of the world have the wherewithal to bail out the financial system once again, having already had to bail out the 2008 financial crisis and the 2020 pandemic crisis? What are the limits? Are there any?
However, the potential debt collapse and losses related to the banning of Russian companies extends even further. The reality is that global investors are going to suffer huge losses or are suffering them right now. Estimates are that there are at least $200 billion of Russian stocks owned by foreigners. At least $68 billion is in the U.S. Blackrock, the world’s largest hedge fund, is already acknowledging $17 billion in losses. The losses extend into banks, bond funds (Pimco, one of the world’s largest bond funds, is facing up to $2.6 billion in losses), pension funds, and more. Heavily exposed are EU banks such as Deutsche Bank, BNP Paribas, and Credit Suisse. With EU and North American companies quitting Russia in droves, they are discovering that they will lose everything as their assets are seized and nationalized. This is a direct response to the seizing of Russian assets, including the assets of sanctioned oligarchs. Look at this more deeply and it could spell the end of financial globalization. As The Big Short put it succinctly, everything could go down the toilet.
We have already seen the impact on global commodity prices. There is considerable disruption to supply, there is the physical destruction of infrastructure, and then there are the sanctions. While it appears Russia’s oil and gas will not be banned, the effect is as if they are because Russian ships with oil are being denied dockage and air trade is disrupted with bans on Russia flying through everybody’s airspace and bans by Russia on everyone else flying through their airspace. The result of all of this is that commodities everywhere have soared in price—oil, gas, base metals, precious metals, and grains and as well fertilizers.
The most extreme impact of the disruption was seen with nickel prices that leaped by roughly 250% in two days, trading briefly above $100,000/tonne. Shorts were scrambling to cover their positions and margin calls. A big player was caught. Chinese entrepreneur Xiang Guangda, known as “Big Shot,” and his company Tsingshan Holding Group Co., the world’s largest nickel and stainless-steel producer, were caught suffering potentially hundreds of millions in losses. A unit of the Chinese Construction Bank was left holding the bag on hundreds of millions of margin calls as well. Trading in nickel was suspended.
The last time that happened was the “Tin Crisis” of 1985 that resulted in the collapse of the tin cartel and caused numerous brokers to fail. Trading was suspended for nickel. How long will this last? Nickel is a key commodity used in stainless steel and electric-vehicle batteries. Russia supplies roughly 7% of the global nickel supply and 17% of high purity nickel production. These are not insignificant amounts in a world already suffering shortages of nickel. Russia also supplies the world significant amounts of aluminum, copper, palladium, platinum, diamonds, uranium, gold, silver, chromium, and iron ore. Add in Ukraine’s resources and together they are not insignificant. What if there were a squeeze on other commodities as we saw with nickel? Who else might collapse? Gold bugs would be pleased if it happened to gold.
Nickel inventories at both the London Metals Exchange (LME) and the Shanghai Exchange were already at their lowest levels in years because of surging demand. Word is that Xiang is in for an $8 billion hit to cover his position. The question we are asking is: is this just the tip of the iceberg in terms of potential blow-ups because traders (hedge funds, banks, etc.) are caught the wrong way? We don’t have an answer for that nor even know if it would happen, but in the past it has caused firms to fail. How many? How much?
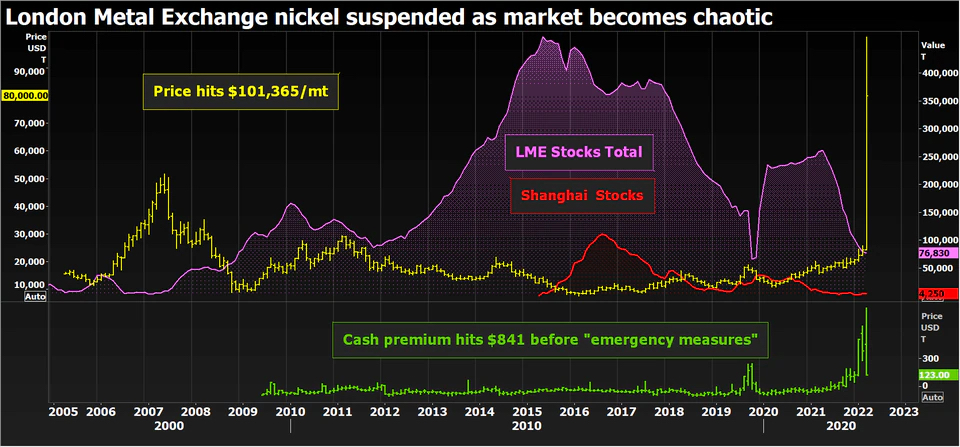
Source: www.reuters.com, www.mining.com
Possibly one of the worst effects of sanctions on Russia is the potential disruption of global grain supplies. Russia is a major exporter of wheat and other grains and with Ukraine the two alone have upwards of 30% of global trade in wheat, 17% of maize, and upwards of 78% of sunflower seed oil. Russia is also a major fertilizer producer. All of this is coming at a time when global agriculture and food supplies are already fragile. In 2021 droughts were not uncommon as both the U.S. (fifth in global wheat production) and Canada (ninth in global wheat production) both suffered from reduced yields due to drought. Russia prohibiting the export of nitrogen fertilizer adds to the woes. Constraints on shipping are already negatively impacting getting products to markets. With the Black Sea all but off limits for anyone, all trade is locked inside Ukraine and Russia.
A prime destination of Russian and Ukrainian agricultural products is the Middle East and Africa. Both Turkey and Egypt are large importers of Russian/Ukrainian wheat and corn. In 2011 food shortages helped spark what became known as the Arab Spring. Grain prices rose on average 40% in 2021 and are now expected to rise almost that much again in 2022.
Since March 2020, wheat is up 105%, corn up 107%, sugar up 35%, and soybeans up 88%. All this feeds right back into the food you buy at the grocery store.
Soaring Agriculture Prices
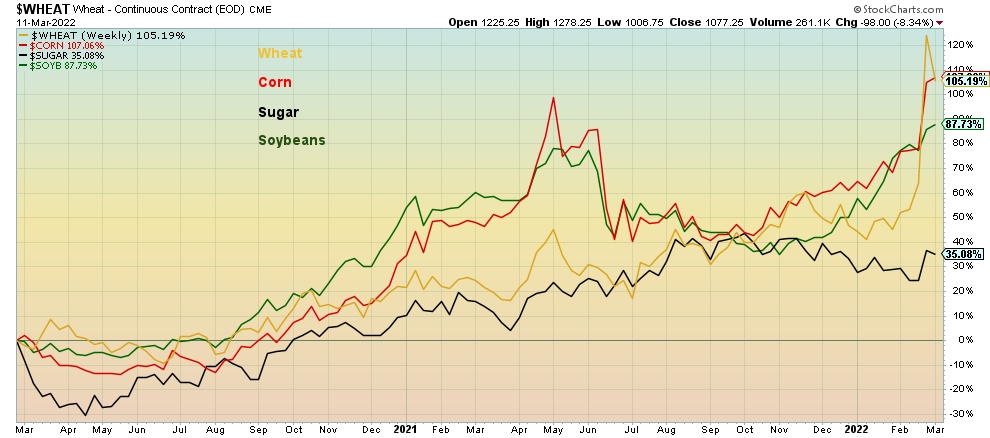
Source: www.stockcharts.com
And then there is probably the most visible commodity rise for consumers—oil. As long as the conflict in the Ukraine continues, oil prices are most likely destined to remain above $100 and could probably go even higher. Natural gas (NG) prices that soared almost five-fold in the EU last year could rise another 50% or more. Oil at $150 or higher is no longer inconceivable.
Since March 2020, WTI oil is up 144%, natural gas up 181%, gasoline up 121% and heating oil up 131%. Gasoline at the pumps here in Toronto is up 50% in the last year. Yes, the chart below on gasoline prices in Canada is actually a month behind, going only to February 2022. In February they averaged US$1.27/liter and are now roughly US$1.50/liter.
Chart continues on the next page
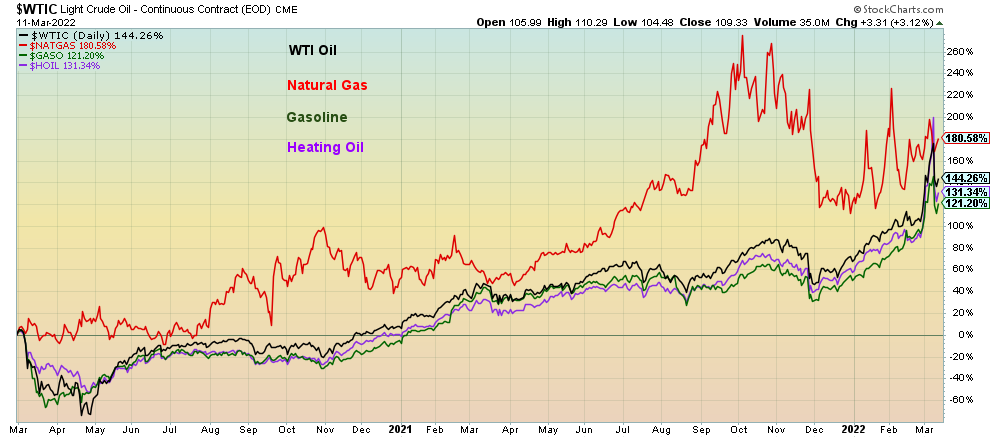
Source: www.stockcharts.com
Soaring Gasoline Prices US$/Liter in Canada
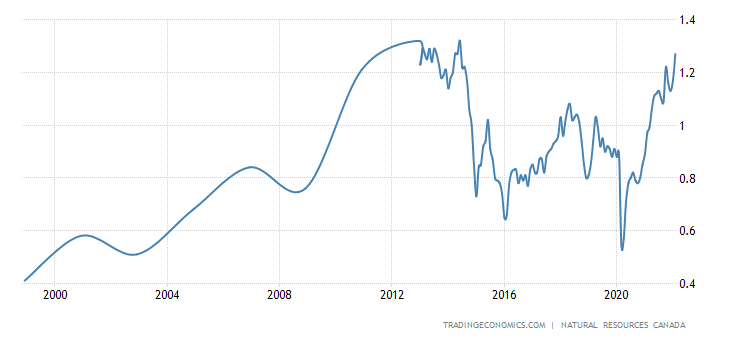
Source: www.tradingeconomics.com, www.nrcan.gc.ca
Sanctions have consequences. Potentially serious consequences, especially if Russia defaults on its debt which some now expect. A Russian debt default could be the Lehman Brothers collapse on steroids. Financial sanctions impact the ability to conduct trade. Supply chains are disrupted by land, sea, and air. Everything that has already been disrupted could become even more disrupted. Inflation is rising—witness the latest U.S. CPI, up 7.9% y-o-y. It is the highest level since 1982. Global inflation is expected to be above 6% in 2022. With central banks in a tightening mode, this raises critical questions on how they will react going forward. Concern for the ongoing conflict in Ukraine has taken COVID off the front pages. The expectation is that central banks will not change their schedule for rate hikes. But the Fed might slow down its pace of selling assets off its balance sheet. Global growth is expected to take a hit and economists are scrambling to downgrade their forecasts. Could global growth turn negative? Yes. A global recession? Highly probable. A global depression? It is now possible.
Chart of the Week
U.S. 10-Year Treasury/CPI Spread
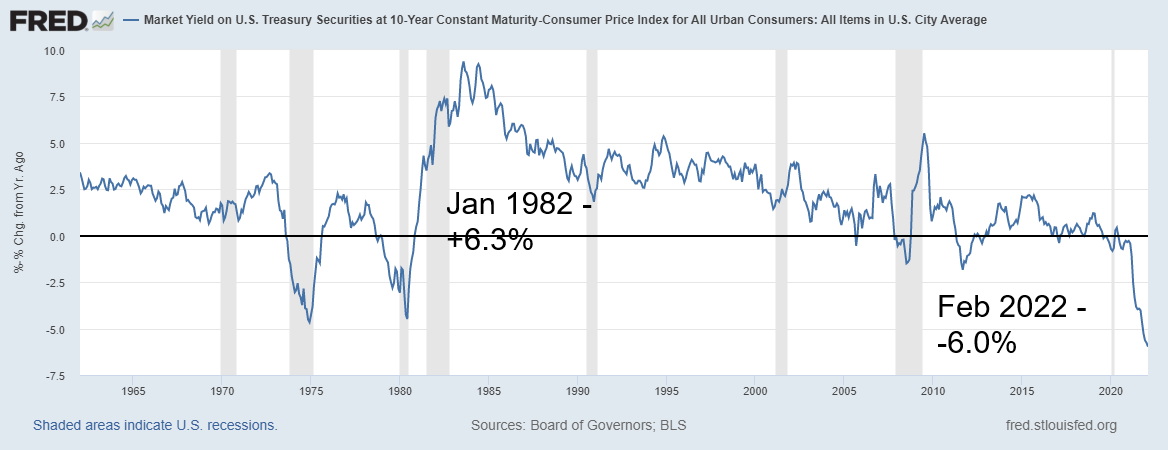
Source: www.stlouisfed.org
In January 1982, the U.S. 10-year treasury less the CPI rate was +6.3%. Today, based on the most recent CPI numbers, the spread is now negative 6.0%. Not even during the 1970s inflation did the 10-year/CPI spread get this negative. It was negative 4.7% in December 1974 and negative 4.5% in June 1980, even as the Fed was hiking rates to 20%. Recessions followed or were occurring when the 10-year/CPI spread was negative. The spread briefly went negative during the 2007–2009 Great Recession and again during the EU/Greek debt crisis of 2011. Either inflation has to come down substantially or the 10-year has to rise (yields) sharply (prices fall as prices move inversely to yields).
U.S. inflation surged to 7.9% in February, the highest since January 1982. The core inflation rate (ex food and energy) also surged to 6.4%, the highest also since 1982. The likelihood of inflation coming down any time soon is slim to none as the effects of the pandemic and the war in Ukraine continue. Prices are soaring everywhere and the latest CPI report does not include further energy price hikes seen in March. Supply constraints, demand, labour shortages are all adding to inflation and further raising inflation expectations and lowering consumer confidence.
With the stock market plunging, the return on stocks could soon shift to negative once inflation is taken into consideration. That has occurred in the past, most recently during March and April 2020 at the height of the pandemic crash. But over the past decade, negative returns adjusted for inflation were rare for stocks (as measured by the S&P 500).
US Inflation Rate and Core Inflation Rate 1997–2022
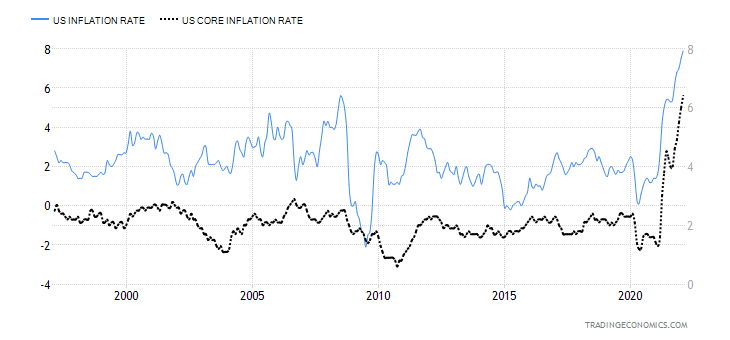
Source: www.tradingeconomics, www.bls.gov
The last time CPI was around 8% (8.2% January 1982) the Fed Funds rate was 13.0%. Today it is zero although, as noted, the Fed is expected to hike rates this week by 25 bp.
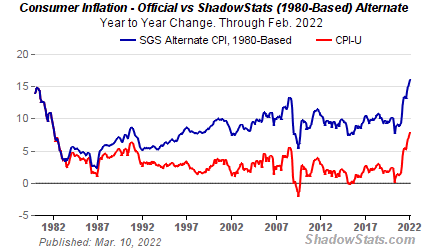
Source: www.shadowstats.com
Inflation, however, was calculated differently in 1982 than it is today. Shadow Stats (www.shadowstats.com) has recalculated the inflation rate based on how it was calculated in 1980. In January 1982 inflation was reported at 8.2%. The official CPI saw methodological changes throughout the 1980s and 1990s. The result is today the official inflation rate is reported as 7.9%, but if one were to use the method from 1980, the inflation
rate would be 16.1%, a difference of 8.2%. Based on that, the 10-year/CPI spread would now be negative 14% or more. That is a huge gap.
As we noted, consumer sentiment and the U.S. inflation rate are going in opposite directions. Consumer sentiment down, inflation up. The Michigan Consumer Sentiment Index was reported at 59.7 for March, below forecasts of 61.4 and February’s 62.8. A bad combination.
Michigan Consumer Sentiment Index vs. U.S. Inflation Rate 2012–2022
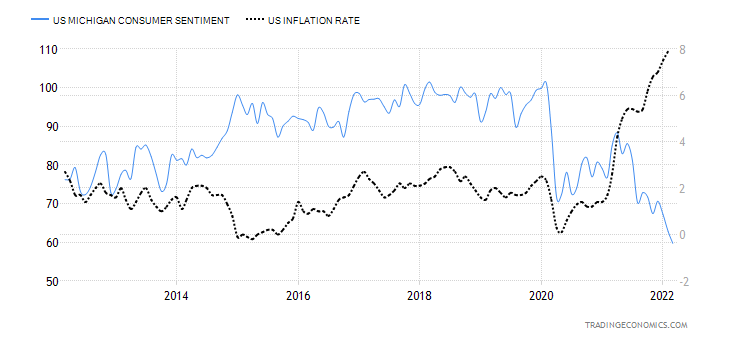
Source: www.tradingeconomics.com, www.umich.edu, www.bls.gov
MARKETS AND TRENDS
|
|
|
|
% Gains (Losses) Trends |
|
||||
|
|
Close Dec 31/21 |
Close Mar 11/22 |
Week |
YTD |
Daily (Short Term) |
Weekly (Intermediate) |
Monthly (Long Term) |
|
|
Stock Market Indices |
|
|
|
|
|
|
|
|
|
S&P 500 |
4,766.18 |
4,204.31 |
(2.9)% |
(11.8)% |
down |
down |
up |
|
|
Dow Jones Industrials |
36,333.30 |
32,944.19 |
(2.0)% |
(9.3)% |
down |
down |
up |
|
|
Dow Jones Transports |
16,478.26 |
15,232.97 |
(1.0)% |
(7.6)% |
down |
neutral |
up |
|
|
NASDAQ |
15,644.97 |
12,843.81 |
(3.5)% |
(17.9)% |
down |
down |
up |
|
|
S&P/TSX Composite |
21,222.84 |
21,461.83 |
0.3% |
1.1% |
up |
up |
up |
|
|
S&P/TSX Venture (CDNX) |
939.18 |
846.35 |
(0.1)% |
(9.9)% |
down |
down |
up |
|
|
S&P 600 |
1,401.71 |
1,284.70 |
(1.1)% |
(8.4)% |
down |
down |
up |
|
|
MSCI World Index |
2,354.17 |
2,103.00 |
(2.2)% |
(10.7)% |
down |
down |
up (weak) |
|
|
NYSE Bitcoin Index |
47,907.71 |
39,143.38 |
(3.8)% |
(18.3)% |
neutral |
down (weak) |
up |
|
|
|
|
|
|
|
|
|
|
|
|
Gold Mining Stock Indices |
|
|
|
|
|
|
|
|
|
Gold Bugs Index (HUI) |
258.87 |
312.74 (new highs) |
2.6% |
20.8% |
up |
up |
up |
|
|
TSX Gold Index (TGD) |
292.16 |
355.86 (new highs) |
3.3% |
21.8% |
up |
up |
up |
|
|
|
|
|
|
|
|
|
|
|
|
Fixed Income Yields/Spreads |
|
|
|
|
|
|
|
|
|
U.S. 10-Year Treasury Bond yield |
1.52% |
2.0% |
15.6% |
31.6% |
|
|
|
|
|
Cdn. 10-Year Bond CGB yield |
1.43% |
1.99% |
19.9% |
39.2% |
|
|
|
|
|
Recession Watch Spreads |
|
|
|
|
|
|
|
|
|
U.S. 2-year 10-year Treasury spread |
0.79% |
0.25% |
4.2% |
(68.4)% |
|
|
|
|
|
Cdn 2-year 10-year CGB spread |
0.48% |
0.33% |
17.9% |
(31.3)% |
|
|
|
|
|
|
|
|
|
|
|
|
|
|
|
Currencies |
|
|
|
|
|
|
|
|
|
US$ Index |
95.59 |
99.13 (new highs) |
0.5% |
3.7% |
up |
up |
up |
|
|
Canadian $ |
.7905 |
0.7860 |
0.2% |
(0.6)% |
down (weak) |
down |
up |
|
|
Euro |
113.74 |
109.14 (new lows) |
(0.2)% |
(4.0)% |
down |
down |
down |
|
|
Swiss Franc |
109.77 |
107.02 |
(1.8)% |
(2.5)% |
down |
down |
up (weak) |
|
|
British Pound |
135.45 |
130.36 (new lows) |
(1.6)% |
(3.8)% |
down |
down |
neutral |
|
|
Japanese Yen |
86.85 |
85.28 (new lows) |
(2.1)% |
(1.8)% |
down |
down |
down |
|
|
|
|
|
|
|
|
|
|
|
|
|
|
|
|
|
|
|
|
|
|
Precious Metals |
|
|
|
|
|
|
|
|
|
Gold |
1,828.60 |
1,985.00 (new highs) |
0.9% |
8.6% |
up |
up |
up |
|
|
Silver |
23.35 |
26.16 |
1.4% |
12.0% |
up |
up |
up |
|
|
Platinum |
966.20 |
1,088.60 |
(2.5)% |
12.7% |
up |
up |
up |
|
|
|
|
|
|
|
|
|
|
|
|
Base Metals |
|
|
|
|
|
|
|
|
|
Palladium |
1,912.10 |
2,796.80 (new highs) |
(6.2)% |
46.3% |
up |
up |
up |
|
|
Copper |
4.46 |
4.63 (new highs) |
(6.3)% |
3.7% |
up |
up |
up |
|
|
|
|
|
|
|
|
|
|
|
|
Energy |
|
|
|
|
|
|
|
|
|
% |
75.21 |
109.33 (new highs) |
(5.5)% |
45.4% |
up |
up |
up |
|
|
Natural Gas |
3.73 |
4.72 |
(6.0)% |
26.5% |
up |
up |
up |
|
Source: www.stockcharts.com, David Chapman
Note: For an explanation of the trends, see the glossary at the end of this article.
New highs/lows refer to new 52-week highs/lows and, in some cases, all-time highs.
Canada Job Numbers
Employed Persons vs. Unemployed Persons – Canada 2012–2022
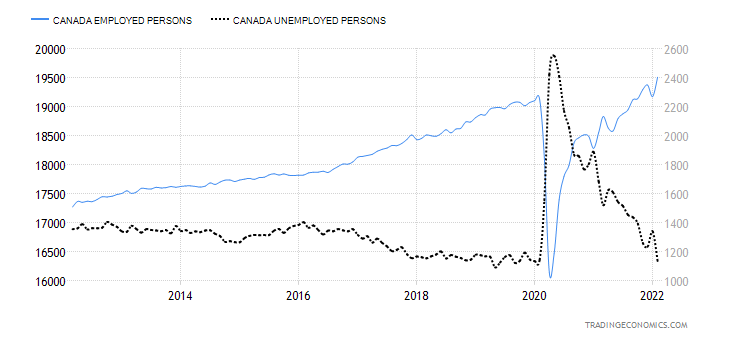
Source: www.tradingeconomics.com, www.statcan.gc.ca
Seems that Canada’s employment picture keeps on getting better. But for how much longer? Canadian employment leaped in February with Statistics Canada reporting that 337,000 jobs were created. The market had expected 120,000. Canada lost 200,100 jobs in January. The unemployment rate plunged to 5.5%, well below January’s 6.5% and the expected 6.3%. By all measurements the report was gangbusters. Full-time employment surged by 121,500 but possibly worrisome was that part-time employment leaped by 215,100.
It was the biggest jump in employment since September 2020. Of the jobs, many part-time, accommodation and food services jumped 114,000 as restaurants hired. That provinces are in the process of lifting pandemic measures is also helping employment. In falling to 5.5% the unemployment rate is now below where it was in February 2020 (5.7%). The percentage of people employed jumped back to February 2020 levels at 61.8%. The labour force participation rate jumped to 65.4% from 65.0%, wiping out the decline seen in January. The R8 unemployment rate, which includes discouraged searchers and involuntary part-timers, also fell sharply to 8.1% from 9.1%. That is also below the February 2020 rate of 8.6%.
Wages grew as well but only 3.1% on a y-o-y basis. That’s below the rate of inflation which was last reported at 5.1% for January. Canada reports on inflation this coming week. Inflation is expected to rise 5.4% for February.
All in all, this is a great news report for Canada. But worrisome is the growth in part-time employment and the fact that this does not yet capture the sharp rise in inflation that could be seen for March 2022. Next month’s job report may not be so rosy.
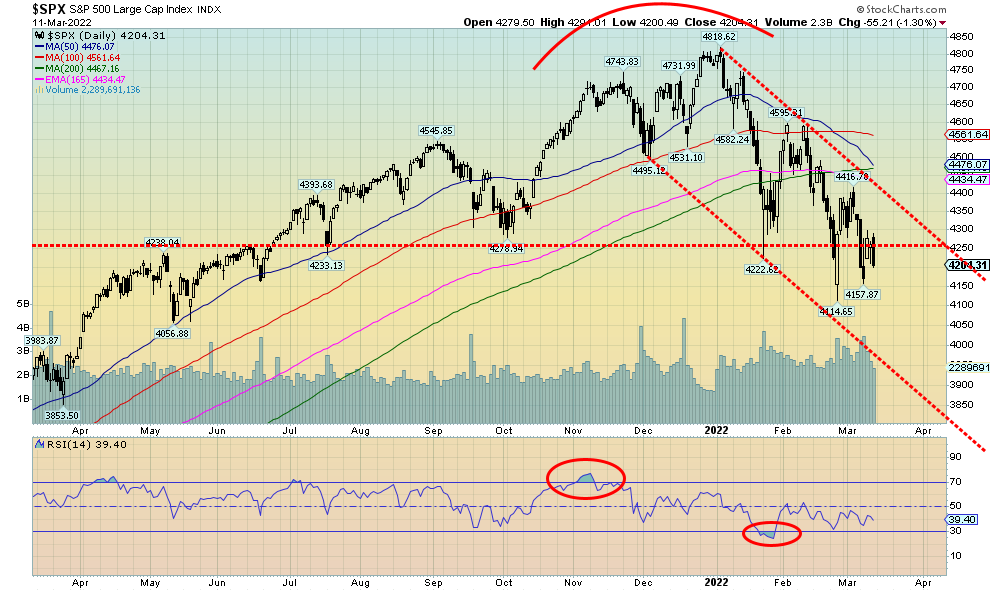
Source: www.stockcharts.com
Stock markets just keep on falling. No, we haven’t had a crash yet. But one could be coming. Some are detecting crash patterns developing. We don’t disagree. We are just seeing steady waterfall declines. Fall, rebound, fall more, rebound, fall again, rebound etc., etc. Nothing in this chart suggests to us that we are either at or near a low. Over in the credit markets, credit spreads are rising as the massive amount of global debt (estimate: $303 trillion) is vulnerable. This is the fifth straight week of losses. That top seen on January 4 is looking increasingly distant. Topping in the first week of January reminds us of another stock market that topped in early January. The Tokyo Nikkei Dow (TKN) topped that first week of January 1990. It has never seen that high again 32 years later. We are also reminded of the Nifty Fifty high of early January 1973. After that along came Watergate and the Arab oil crisis and the markets didn’t bottom until December 1974 down 48% for the S&P 500.
The war in Ukraine drags on. Sanctions are being piled on top of sanctions on Russia. We muse about blowback so severe that it could take down the global financial system. This past week the S&P 500 fell 2.9%, the Dow Jones Industrials (DJI) dropped 2.0%, the Dow Jones Transportations (DJT) was down 1.0% and the NASDAQ dropped 3.5%. The NASDAQ is now down 17.9% in 2022 and down almost 21% from its all-time high. The S&P 600 small cap fell 1.1% and is actually outperforming its big cap cousin the S&P 500. The 600 is down 8.4% y-t-d while the 500 is down 11.8%.
There was a star. The TSX Composite actually rose 0.3%, thanks to strong performances from the commodity-based indices of golds, materials, and energy. The small-cap TSX Venture Exchange (CDNX) lost only 0.1%. For whatever reason, the EU indices actually were up. The London FTSE gained 2.1%, the Paris CAC 40 was up 3.3%, while the German DAX jumped 4.1%. Maybe they thought war was going to end. But both the CAC 40 and the DAX made new 52-week lows before rebounding. In Asia, China’s Shanghai Index (SSEC) fell 4% while the Tokyo Nikkei Dow (TKN) fell 3.2% to new 52-week lows.
Markets are being bounced around by the war in Ukraine. Any signs of peace spark the markets higher. But so far it has been nothing but disappointment and, as inflation rages (7.9% y-o-y) and oil prices scream higher, markets regret rebounding and then down we go. Consumer confidence is collapsing as the latest Michigan Consumer Sentiment Index came in at its lowest levels since the EU/Greek debt crisis of 2011 and the financial crisis of 2008. Not a good sign.
There are numerous pundits who believe that markets are in the process of making bottoms. And therein lie the reasons why the market is more likely to go lower first. Bearish sentiment is not yet bad enough. As we note below, the put/call ratio remains in neutral territory below bear territory. Other indicators are also not at levels that could indicate a bottom. Breadth indicators are pointed down. The advance/decline line is making new lows even though the S&P 500 did not make a new low this past week. That tells us we should go lower again and see new lows. The percent of S&P 500 stocks trading above their 200-day MA is at 37%. Bear territory is under 30%. The S&P 500 Bullish Percent Index is at 36%. Good lows are usually seen under 20%.
Stock indices could be in the process of a third wave down. However, that would not be confirmed until we make new lows. The reality is that the S&P 500 needs to regain above 4,500 to suggest to us that a low is most likely in. Fear is in the air, but the markets are not yet at maximum fear. The market has been slowly falling rather than crashing. That is more like what we saw during the 1973–1974 bear market. The final collapse doesn’t come until the end. Bear markets tend to last at least two years. Think 1929–1932, 1973–1974, 2000–2002, 2007–2009. This market only topped in January and this is not at all like the March 2020 crash that turned out to be a crash within the context of a bull market, just as the 1987 stock market crash was a crash within the context of a longer bull market. Both were fast and swift but over quickly. Real bear markets tend to last a lot longer.
As they say it ain’t over until it’s over. And for that there are few signs it is over.
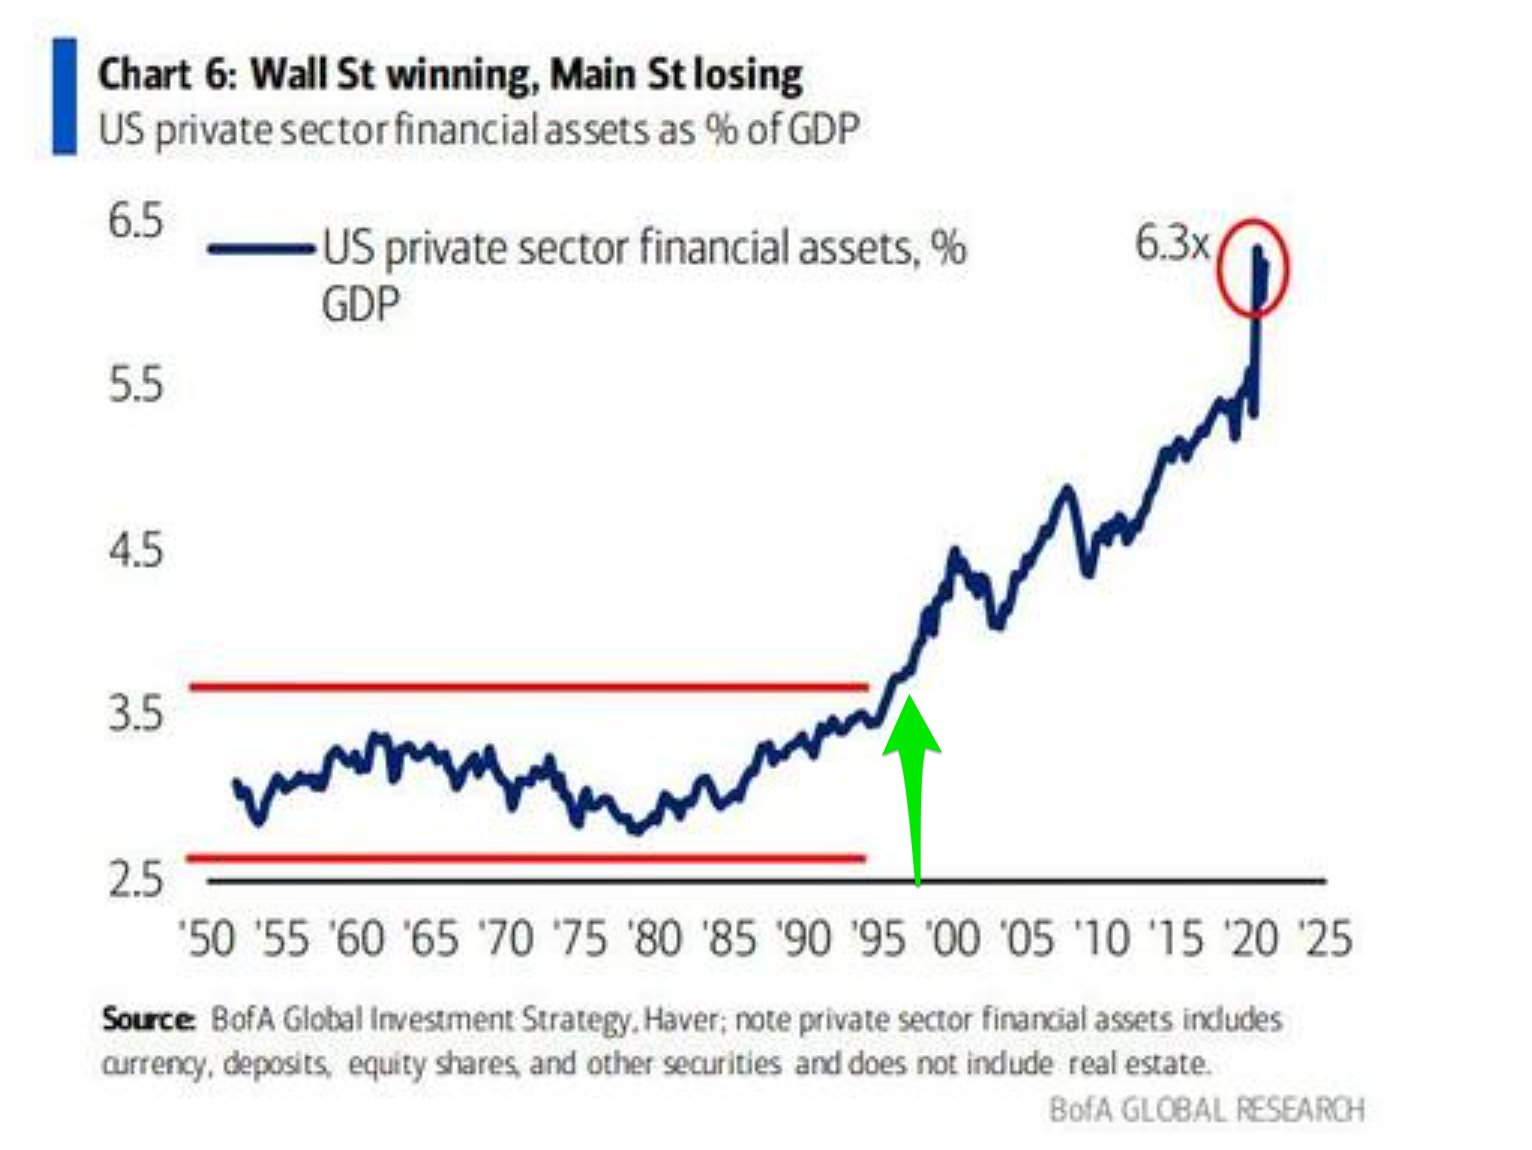
Source: www.business.bofa.com, www.goldstockdata.com
An interesting chart. For years through the 1950s, 60s, 70s, 80s, and even into the early 90s the ratio of U.S. private sector financial assets as a percentage of GDP remained fairly steady. Then something weird happened in the late 1990s—the Russian debt default of 1998 leading to the collapse of Long-Term Capital Management (LTCM) that almost brought down the global financial system. It is interesting to note that the amounts involved then were a lot smaller than the amounts involved today. The collapse led to a political crisis in Russia, leading to the fall of the then-president Boris Yeltsin which in turn led to the rise of Vladmir Putin. A consortium of banks led by the Fed bailed out LTCM or the entire financial system could have seized up and collapsed. Interest rates were slashed to zero and central banks globally flooded the financial system with liquidity. This led to the tech bubble that topped a year or two later. Derivatives played a huge role, and the end of the Glass Steagall Act breaking down the barriers between brokers and banks was another result. Markets soared. The 1% got richer, while main street struggled. Adding to it all later was the 9/11 crisis, then the sub-prime crisis of 2008, all of which led to QE and zero percent interest rates forever, it seemed. Debt became a good word and everyone piled in. Derivatives would save the day. As long as everyone, or at least the 1%, were making money everything was fine. Now the entire system threatens to come crashing down.
And with interest rates at or near zero (sub-zero in the eurozone and Japan) and governments having spent trillions to bail out the LTCM debacle, 9/11, the sub-prime crisis, and the pandemic crisis, and with global debt over $300 trillion more than double where it was prior to the 2008 financial collapse and a looming possible debt default of Russia, there are no more bullets left. Okay, very few bullets left to deploy if we collapse again.
Think of the global economy as a huge pyramid of cards. Russia is just one of the cards, but it does represent roughly 1.7% of the global economy. Pull that card out and will the house of cards stay up? Sanctions have consequences and what is looming are unintended consequences.
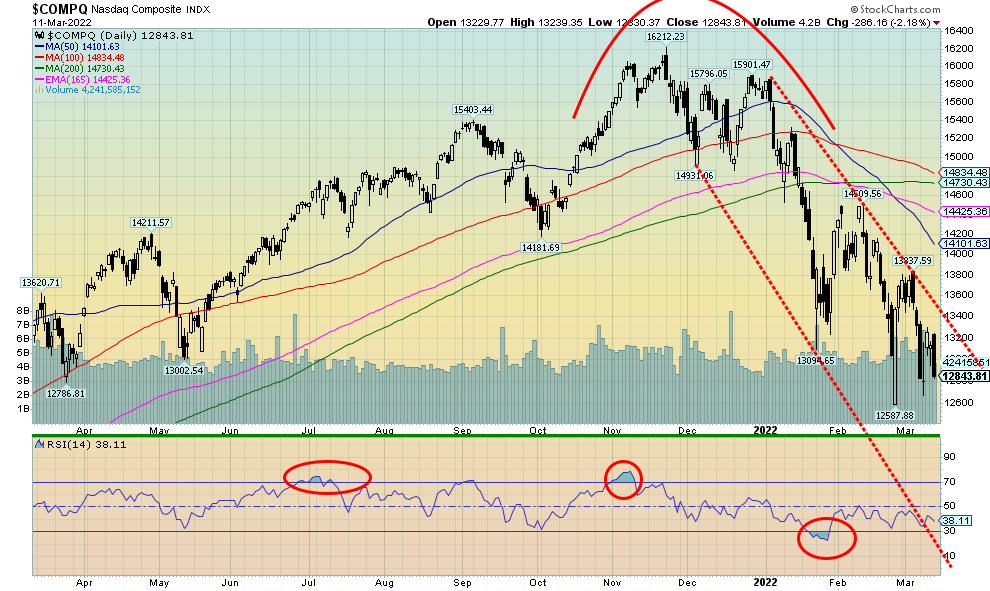
Source: www.stockcharts.com
The NASDAQ is officially in bear market territory. The NASDAQ lost 3.5% this past week and is now down 20.8% from its all-time high seen in November. On Friday the NASDAQ fell 2.2%. Driving the market lower is fear of inflation, fear of the war in Ukraine, plus a desire to lock in those profits made on the high-tech sector since March 2020. It was not a good week for the FAANGs. A number of them made new 52-week lows. Meta (Facebook) fell 6.2% to new lows, Apple lost 5.2%, Amazon was a relative star, down only about 0.1% but still seeing new lows, Netflix fell 5.9% to new lows. Google lost 1.3%, Microsoft was down 3.4%, Tesla dropped 5.1%, Twitter down 1.1%, Baidu new lows down 19.2%, Alibaba also new lows down 13.8%, and finally Nvidia down 3.6%. No joy in FAANG land. Baidu and Alibaba, both Chinese based companies, fell sharply because of the fear of delisting. Russian stocks are being delisted sparking huge potential losses. The party is over, it appears. The NASDAQ is locked in a down channel. The recent pop took it only to the top of the channel. New
lows could be forthcoming, but a failure to make new lows could be bullish. The NASDAQ breaks out, regaining only above 13,400—the reality is, we need to regain above 14,000 to suggest a low is in.
Source: www.stockcharts.com
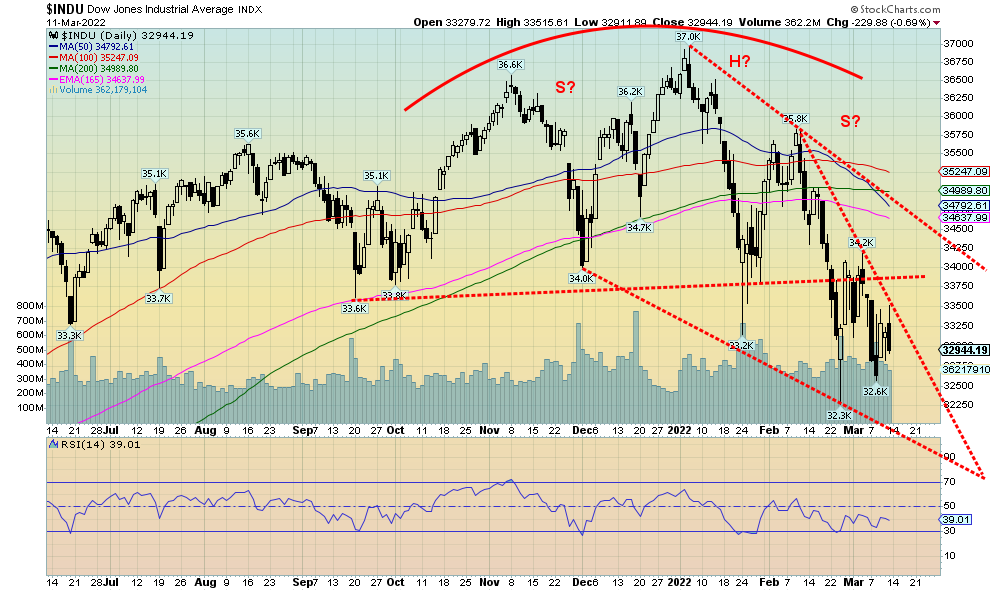
The possible head and shoulders top pattern for the DJI is not clear. While we did break under a perceived neckline at just under 34,000, we have failed thus far to achieve potential targets down to 30,000/31,000. The low so far is 32,300. Now we appear to be forming what looks like a descending wedge pattern which is bullish. We’ll have to see how the DJI acts as it falls deeper into the wedge. But if we were to see new lows below 32,300, the odds suggest that the wedge pattern could fail. The head and shoulders top pattern is not that clear, either. The only thing clear is that the DJI has made what looks like a top pattern. It also still appears that the DJI is in the process of wave 3 to the downside and we should see new lows.
Source: www.stockcharts.com
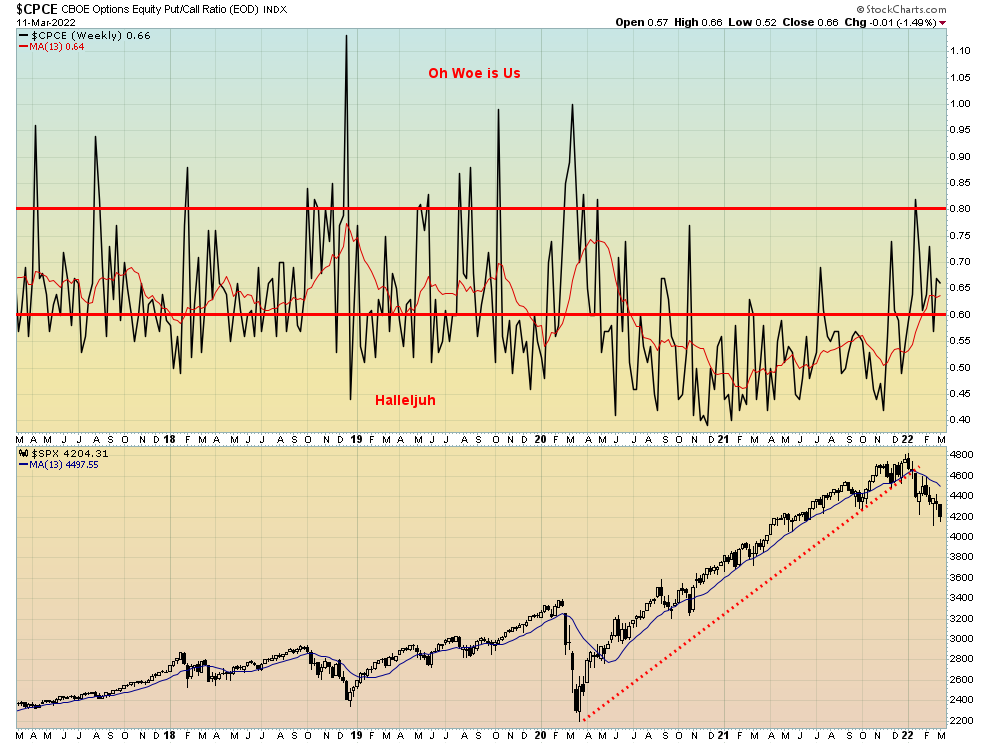
The NYSE put/call ratio is our best indicator that we probably have not yet made a low. With the put/call ratio at 0.66, it is still far too bullish to suggest that a low could in. We need to see solid prints above 0.80 to suggest a low. Other indicators are also saying the same thing. The trend is down, but we see few signs of good bottom.
Source: www.stockcharts.com
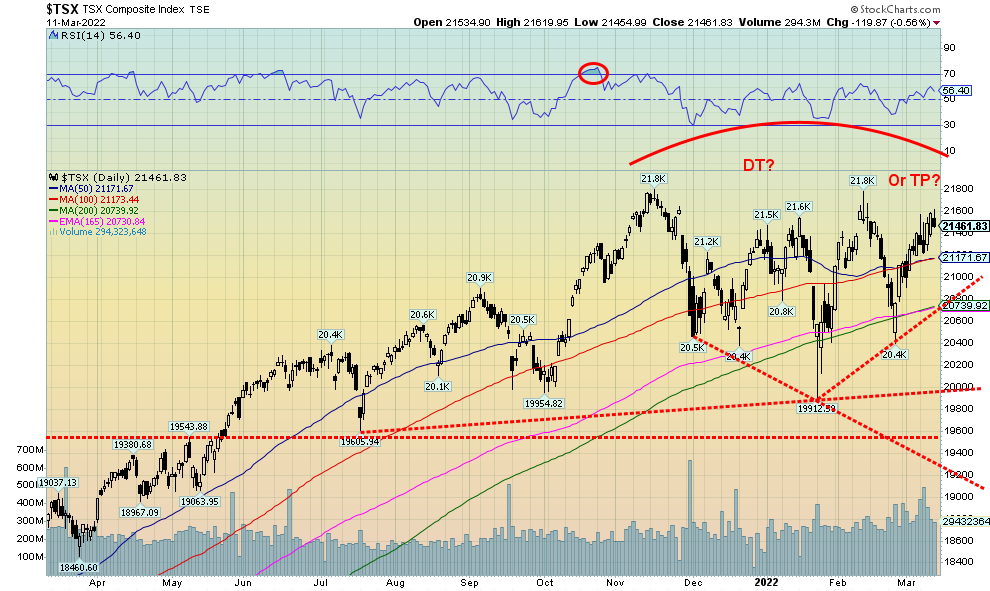
The TSX Composite is the star. The TSX was the only major North American index to rise this past week, gaining a small 0.3%. It was a mixed blessing as some sub-indices soared to 52-week highs while others plunged. Eight of the fourteen sub-indices were up this past week, while six were down. Leading the way to the upside were the commodity-based indices. Golds (TGD) were up 3.3%, while Materials (TMT) gained 2.9%. Also gaining was Energy (TEN) up 1.2%. But surprises came from Income Trusts (TCM) +2.6%, Consumer Staples (TCS) +2.9%, Real Estate (TRE) +1.6%, and Utilities (TUT) +1.9%. Telecommunications (TTS) made 52-week highs but only closed up 0.1%. The only commodity based sub-index to fall was Metals & Mining (TGM), down 2.3% after making 52-week highs. Others making 52-week highs were TCM, TCS, TEN, TMT, and TGD. Making new 52-week lows were Consumer Discretionary (TCM) -0.9%, Health Care (THC) -1.0%, and Information Technology (TTK) -2.4%.
The TSX continues to trace out what looks like a large topping pattern. However, a triple top is rare. If enough steam is mustered from the commodity indices, they could help propel the TSX to new all-time highs. The pattern, however, does have the look of a rare diamond pattern except the peak in the middle is very poorly defined. The result is, it may not be a diamond pattern. Diamond patterns are rare and only appear as a top. Giving it a diamond look was the low seen at 19,912. As it is, support is seen down to 20,740 but a breakdown under that level could, in theory, lead to a decline to at least 18,800. Overall, the pattern is ambiguous and we can make both a bull and bear forecast. New highs above 21,800 but a breakdown is underway below 20,740 and especially under 20,600.
U.S. 10-year Treasury Bond/Canadian 10-year Government Bond (CGB)
Source: www.tradingeconomics.com, www.home.treasury.gov, www.bankofcanada.ca
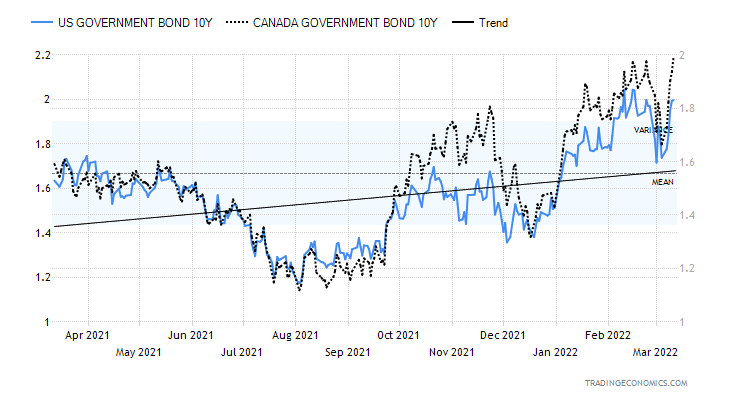
Bonds, it seems, can’t stand a good thing. Bond yields rose this past week as the focus shifted to sharply rising oil prices, sharply rising inflation, and concerns over the ongoing conflict in Ukraine. The result was that following a period where there flows into U.S. treasuries as a safe haven, this past week we saw the opposite as money flowed out of bond funds into money market funds. Apparently bond funds saw an outflow of $15.75 billion this past week with high-yield bonds and global funds, particularly European and Asian funds, seeing large outflows. Government bond funds and inflation-linked funds had positive inflows. Despite government bond funds being the recipients, the yield on the U.S. 10-year treasury note jumped to 2.00% this past week, up from 1.73% the previous week. The Canadian Government of Canada 10-year bond (CGB) rose to 1.99% from 1.66%. Despite the big jump, the 2–10 spreads didn’t do much as the U.S. 2–10 spread rose to 25 bp from 24 bp and the Canadian 2–10 spread rose to 36 bp from 28 bp. The Bank of Canada raised rates as expected this past week but the big Canada job numbers on Friday helped push up yields and widened yield spreads.
March 14–15 is the FOMC and the Fed is widely expected to raise rates 25 bp. What’s key will be watching the words for clues about further hikes. With inflation raging but signs of collapsing consumer confidence and a slowing economy, coupled with the ongoing war in Ukraine, the focus will be on whether the Fed is prepared to raise rates further. We have noted the Fed is caught between a rock and hard place with raging inflation but the potential for a sinking economy as the war rages. And, as we have noted, sanctions could see serious blowback in the form of a Russian debt default and resulting chaos in markets.
After watching Russia being sanctioned for just about everything including their foreign reserves held outside Russia, China is watching things closely. Foreign reserves for all countries are not necessarily held in their own country. U.S. treasuries are held in the U.S. with the Fed, while euros as reserves are held with the ECB. Given that Russia is being prevented accessing their own reserves held outside Russia, China who to date holds some $1.1 trillion of U.S. treasuries is looking on nervously. Are your reserves really your own? Apparently not. We’ll be watching for clues that China is selling or at least reducing its large holdings of U.S. treasuries going forward. They clearly are not buying any more as their holdings have held steady for the past year. The slack has been taken up by other central banks in particular the BOJ and the BOE.
The 10-year is now not too far from its recent high. Rather than fall in yield as it looked, the risk now is that bond yields could rise further. Credit stress is also showing up in the markets as the spreads on AAA, BBB, BB, and CCC debt have widened recently but remain below levels seen in March 2020 at the height of the pandemic crisis when liquidity dried up. To add to all the woes that appear to be gathering, a credit crisis could seize bond markets, bringing everything to a grinding halt.
Source: www.stockcharts.com
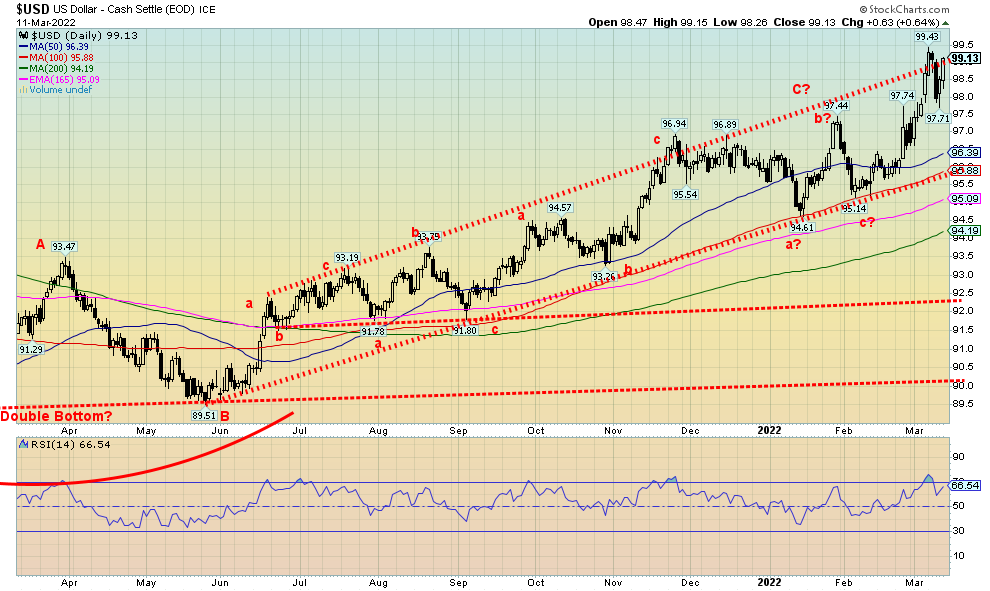
The US$ Index is soaring, hitting a 52-week high at 99.43 this past week. That the US$ Index is rising sharply and gold is rising sharply is an anomaly we don’t see very often. That gold is rising even as the US$ Index is rising is bullish for gold. Normally the two have an inverse relation that as the US$ Index rises, gold falls and vice-versa. The US$ Index overshot our bull channel once again and closed the week at the top of the channel. Is this another overshoot? Or will we break out and move to 100 and higher? The U.S. dollar is considered a safe haven, especially with the war in Ukraine as funds in particular have fled the EU and the euro for the perceived safety of the U.S. and the U.S. dollar. This past week the US$ Index rose 0.5%. The euro hit 52-week lows, losing 0.2%, the Swiss franc was down 1.8%, the pound sterling also hit 52-week lows, losing 1.6%, while the Japanese yen joined the parade of 52-week lows, down 2.1%. The Canadian dollar was the only one to fare well, up about 0.2%.
The euro’s DSI Indicator hit 8% this past week the most bearish seen since 2015. The US$ Index’s DSI Indicator was at the opposite end at 92%. Extreme bearishness for the euro, extreme bullishness for the US$ Index. Of course, it could get more extreme for both. A move and a close for the US$ Index over 99.50 would tell us that we are going higher probably over 100. The US$ Index needs to fall back under 97.50 to suggest to us that a possible high is in. A breakdown under 95.80 would confirm a top.
Source: www.stockcharts.com
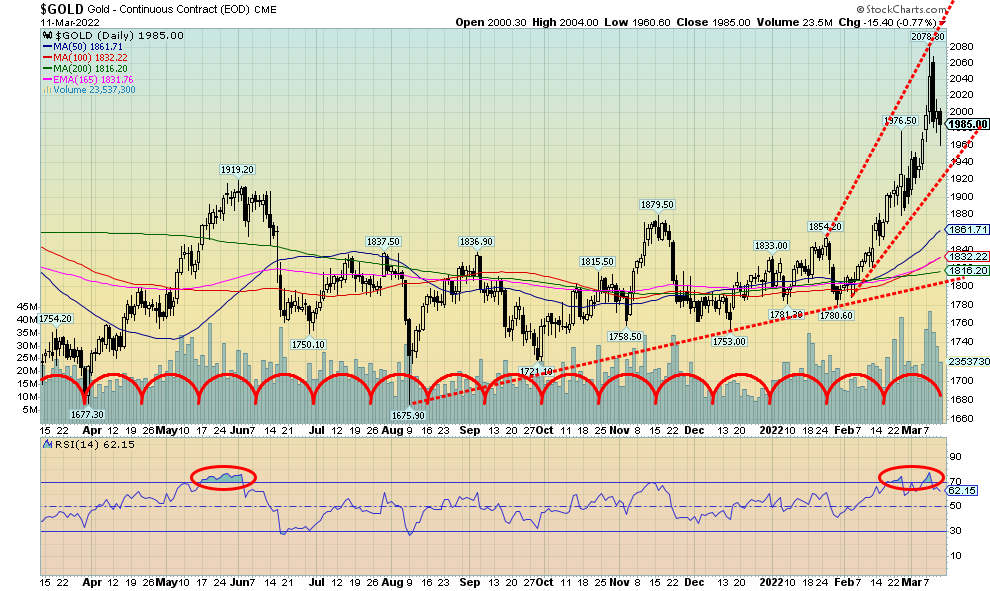
Retail investors are starting to flock to the gold market as a safe haven from inflation, currency devalutation, and the ongoing war in Ukraine. Gold is considered a safe haven in times of geopolitical and financial uncertainty. Gold, unlike stocks and fiat currencies, has no liability. Fiat currencies are backed only by mountains of debt and are effectively an IOU. Gold had a very volatile week, hitting a 52-week high at $2,078.80, shy of the 2020 all-time high of $2,089.20. The high was followed by a mini-crash decline as gold fell a sharp $55 the day after the high was made. Seems that positive remarks from Putin concerning the war helped spark the sharp decline—that and profit-taking.
Despite that, gold managed to rise 0.9% on the week. Silver fared even better, up 1.4%. But profit-taking took over platinum and palladium as platinum fell 2.5% while palladium again made new 52-week highs but closed down 6.2%. Copper suffered as well, down 6.3% also after making 52-week highs. Have copper and palladium topped?
The gold stocks also had a volatile week. The Gold Bugs Index (HUI) gained 2.6% and the TSX Gold Index (TGD) was up 3.3%. Both made 52-week highs. Only silver and platinum failed to make 52-week highs, a possible negative divergence worth noting.
The gold futures DSI Indicator hit 95 this week, the most overbought level seen in two years. This extreme needs to be worked off so in some respects the pullback this week could be considered healthy. While the sharp down day left a bearish candle on the charts, it was not an outside day key reversal. That suggests to us a correction is underway but not necessarily a final top.
Gold broke out of a long symmetrical triangle bottom that suggests targets up to at least $2,100. A long-term cup and handle pattern that dates from 2011 suggests targets up to around $2,200 to $2,400. This week’s action was close to the first target.
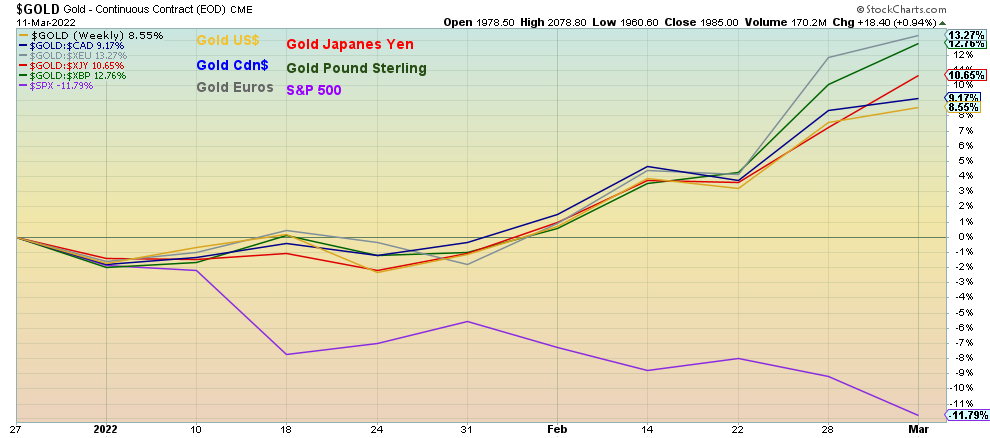
While war can provide a boost to the price of gold because of safe haven demand, it is usually not a sustainable reason. Inflation that leads to stagflation along with currency devaluation are stronger drivers. Gold is rising despite a rise in the value of the U.S. dollar (US$ Index also hit a 52-week high this past week). Gold is up 8.6% in US$ so far in 2022. But gold in Canadian dollars is up 9.2%, in euros up 13.3%, in Japanese yen up 10.7%, and in pound sterling up 12.8%. The S&P 500 is down 11.8% in 2022 so far. Gold is rising in all currencies.
Gold in Currencies 2022
Source: www.stockcharts.com
The best way to hold gold is in physical format or through a fund or ETF that invests only in gold bullion (and usually silver bullion as well plus platinum bullion). There are also gold exchange-traded funds like the SPDR Gold Shares (GLD), but investors lack ownership of the gold bullion. Holding physical gold could come with a cost of storage and carrying charges.
There are more bullish signs on the horizon. It is noted that Russia and China hold the fifth and sixth largest gold reserves in the world. The rank changes to sixth and seventh if the gold holdings of the IMF are included. But it is also widely acknowledged that their public holdings are most likely understated. Russia has the world’s second largest mineable reserves of gold after Australia. China ranks eighth. China and Russia rank first and second respectively in terms of production. Together they produce roughly 21% of the world’s gold. But sanctions are going to bite into Russia’s supply to global gold stock. Russia, being a key producer as well as holding large reserves, leaves a huge hole for global supplies. Could what happened in the nickel market happen in the gold market? A huge short squeeze?
The same holds for silver, platinum, and palladium, especially the latter where Russia has 40% of the world’s production and they hold the world’s largest reserves of palladium. There is concern that, like what happened to nickel, there could be a squeeze on delivery commitments, raising the risk of defaults. There is also concern that Russia along with China could use the “nuclear option” on the petrodollar (U.S. dollar). Russia could demand payment for its oil in gold instead of U.S. dollars. Given sanctions against Russian banks and their use of SWIFT for international payments, payment in gold would be a way of getting around those sanctions. That in turn could spark sanctions on gold against Russia and that in turn could lead to a huge short squeeze in the gold derivatives market and a price hike not unlike what we saw with nickel.
We note that as a possibility, not that it is going to happen. Already the U.S. is trying to find ways to sanction Russia’s gold reserves that are held in Russia with the CBR. They should be careful what they wish for.
Gold has support down to $1,970 and below that down to $1,920. Gold breaks down under $1,860/$1,880. Below that a top is very likely in and focus would have to shift to the downside. While gold traded above $2,000, we need a close over that level to make new highs above $2,089 highly probable.
Source: www.cotpricecharts.com
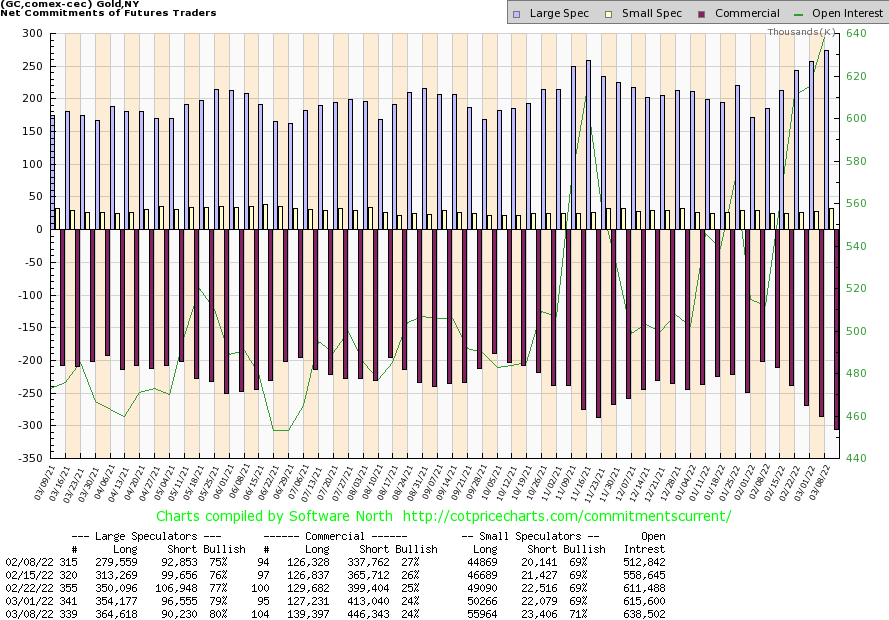
The gold commercial COT (bullion companies and banks) was steady this past week at 24%. However, both long and short open interest did jump. Long open interest rose roughly 12,000 contracts while short open interest rose over 33,000 contracts. Overall open interest rose about 23,000 contracts on an up week for gold. That is positive. The large speculators COT (hedge funds, managed futures, etc.) rose to 80% from 79% as speculators added over 10,000 contracts to longs while subtracting over 6,000 shorts. The commercial COT has in the past been quite low for weeks before a final top was seen. We saw that in both 2011 and 2020. So, while this week’s COT is a concern, we don’t believe it is signaling a top just yet.
Source: www.stockcharts.com
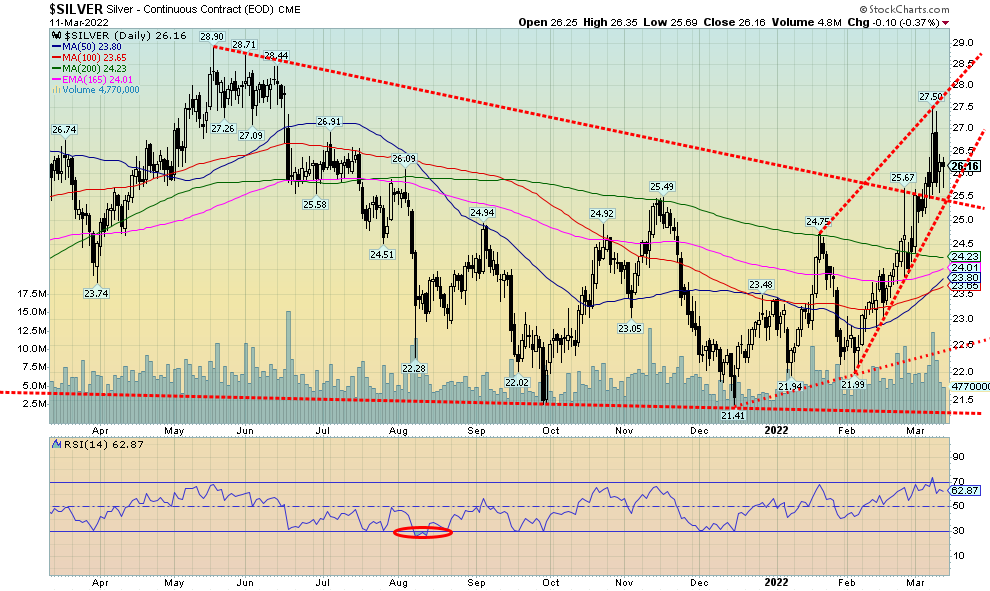
Silver, like gold, had a volatile week. Silver prices jumped to new highs for this move but remain well short of 52-week highs currently at $28.90. Silver gained 1.4% on the week, closing at $26.16 but well off the week’s high of $27.50. Closing over $26 was a positive development. Silver has support down to $25.50, but below that level a swift decline could take place, taking silver prices down to $24. The silver futures DSI Indicator hit 93% this past week, normally considered very overbought. So, a pause is needed to work off excess bullishness. We also continue to be bothered by the obvious divergence between gold and silver with gold making new highs but silver nowhere near its 52-week high. Silver’s RSI only briefly popped over 70 a level that is also considered overbought. Nonetheless, a pause here would help work off any excess bullishness. Silver has broken out of what appears as a large symmetrical triangle with potential targets up to at least $33 with higher levels possible.
Source: www.cotpricecharts.com
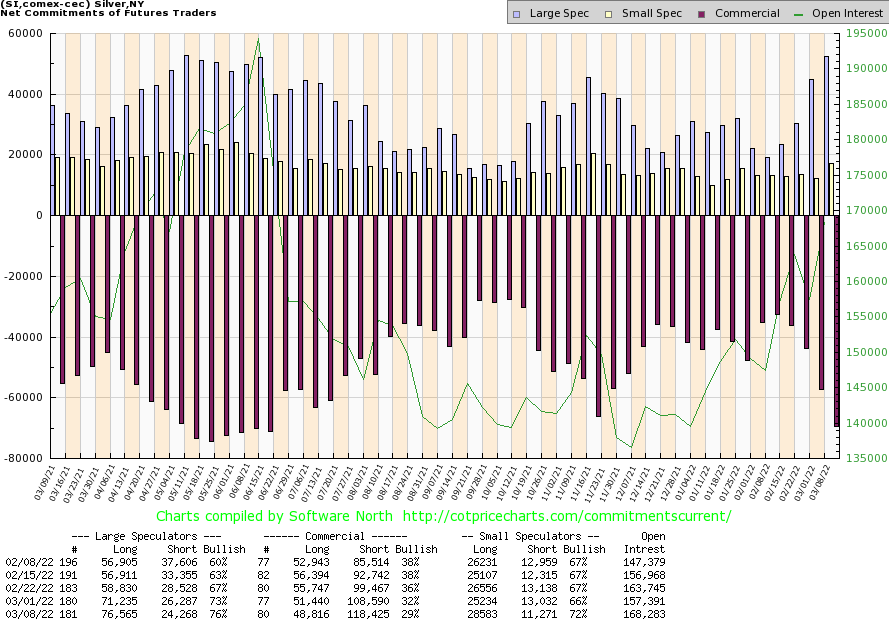
The silver commercial COT plunged this past week to 29% from 32% and 38% just four weeks ago. This is not a particularly good sign. Long open interest fell about 3,000 contracts while short open interest jumped by roughly 10,000 contracts. The large speculators COT jumped to 76% from 73% as they added over 5,000 long contracts while cutting their short position by about 2,000 contracts. Overall open interest jumped about 11,000 contracts on an up week. We’d have to look for other clues to suggest a top for silver; however, the sharp decline is a warning that should not be ignored.
Source: www.stockcharts.com
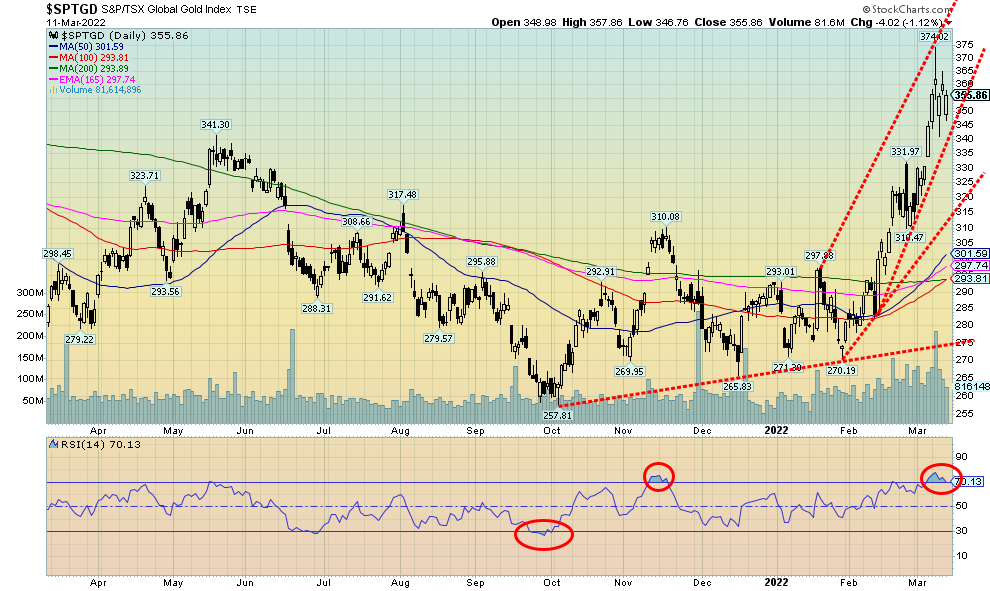
Both the TSX Gold Index (TGD) and the Gold Bugs Index (HUI) hit new 52-week highs this past week before settling back later in the week. The TGD gained 3.3% while the HUI was up 2.6%. The TGD is now up 21.8% in 2022 and the HUI up 20.8%. Both indices are in overbought territory with the RSI over 70; however, there are few signs that the market has topped. The rise for the TGD is steep; however, we have seen this kind of move in the past, most notably in 2020. We note the 2020 bull ended with a huge gap down from the top. We note as well that the top in 2011 was also followed by a gap down. The TGD appears to have spiked and the bullish consensus on gold stocks was getting high so a pause is actually healthy. Support is seen down to 345, but a break under that level could send the TGD to 330 in a hurry. We’d consider that a top is in with a breakdown under 315. We do note that there are no divergences between the RSI and the TGD. In the past, at the 2011 top, the 2016 top, and the 2020 top, negative divergences were seen between the RSI and the TGD with the TGD making higher highs and the RSI lower highs.
Source: www.stockcharts.com
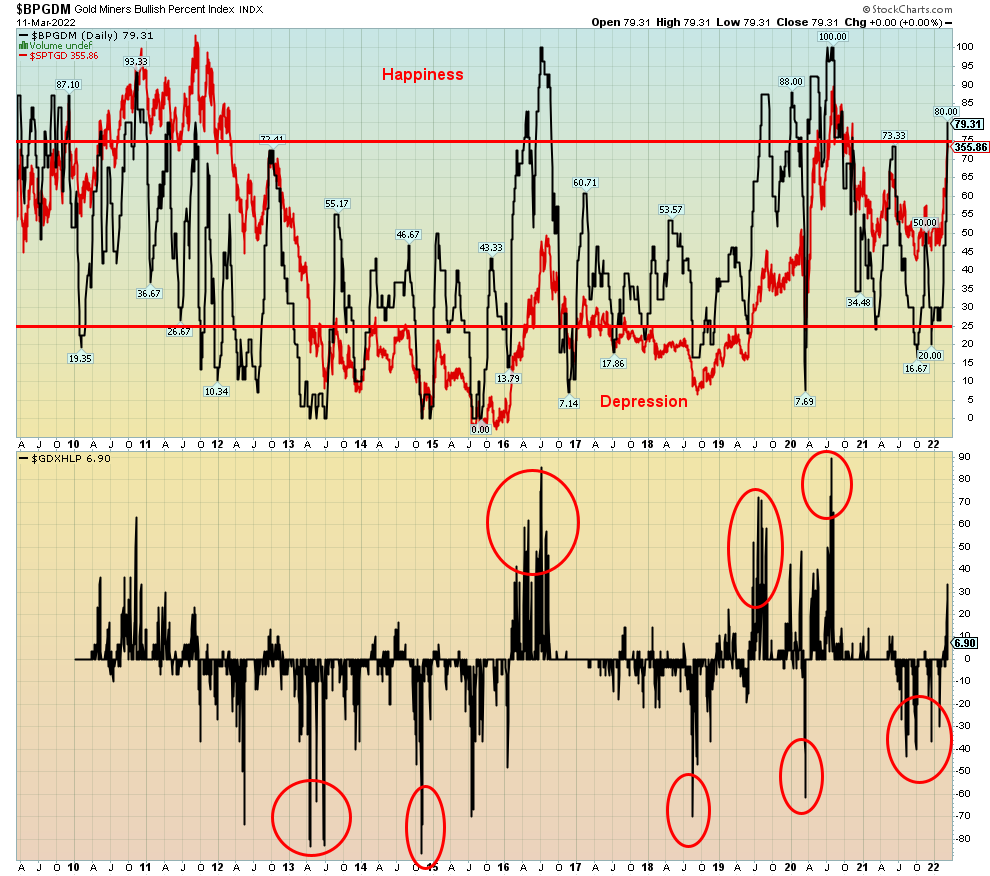
The Gold Miners Bullish Percent Index (BPGDM) hit 80 this week. The Gold Miners New Highs – New Lows Index (GDXHLP) is also spiking but remains below levels seen at previous peaks. The BPGDM hit 100 in August 2020 when gold hit new highs at $2,089. The TSX Gold Index (TGD) at the time hit about 417 vs. the current 356. The all-time high for the TGD was seen in 2011 at 455. While high, the BPGDM has room to move even higher. The BPGDM hit 93 in both 2010 and 2016. To better signal a top we’d also want to see the GDXHLP higher as well. Currently just over 30, it hit highs of over 80 in 2016 and again in 2020. Nonetheless, given we are over 80, traders and investors should be aware and use more caution towards positions in the gold stocks.
 Source: www.stockcharts.com
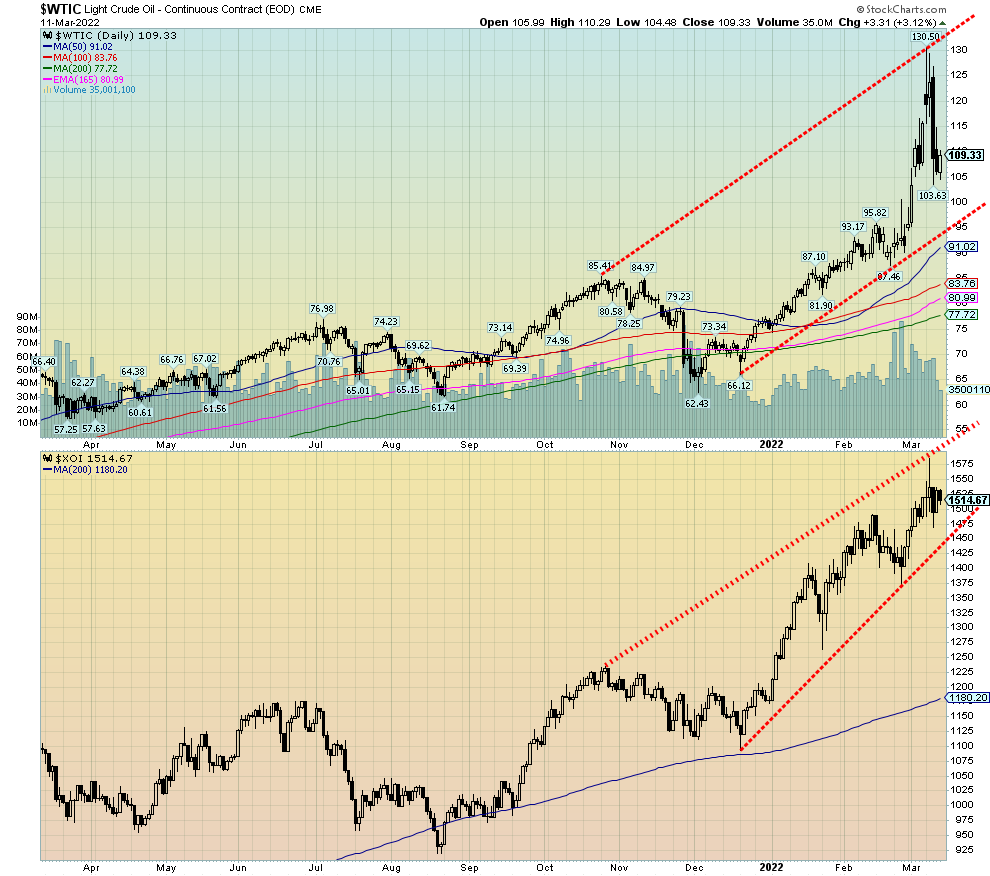
After hitting a peak at $130.50, WTI oil prices sagged on remarks from Putin that might lead to a breakthrough in negotiations with Ukraine, plus the U.S.’s Biden administration signaling a willingness to talk to Venezuela to open up their oil and also a willingness to find a deal with Iran to bring more Iranian oil. That both Iran and Venezuela rank second and third behind Russia when it comes to sanctions suddenly seemed lost in the rush to find new supplies to replace Russian oil and gas. Iran ranks third in natural gas (NG) production and second in reserves. Iran ranks ninth in oil production and fourth in reserves. Venezuela has the world’s largest reserves of oil, but ranks well down in terms of production because of sanctions. As to demand, the U.S. ranks first in consumption, consuming some 20% of the global daily production. Add in China who ranks second in
consumption and between the two they consume over one third of the global daily production. The U.S. is also approaching Saudi Arabia to try and convince them to produce more.
How successful the U.S. will be is open to question. Iranian nuclear talks have broken down, dealing with Venezuela would require the U.S. to recognize Maduro as the leader, relations with the Saudis have soured since the murder of Khashoggi, supposedly engineered by the current Saudi leader Mohammed Bin Salman, aka MBS. Apparently, the Saudis and the UAE, another Arab oil powerhouse, are refusing to pick up the calls from the White House. Not a good sign. The UAE also works with Russian nationals under sanction and that helps Russians avoid some of the sanctions. Nonetheless, with the U.S. ban on Russian oil, the U.S. has to find a way to make up 8% of its imports. Ramping up production is possible, particularly with shale but production doesn’t start overnight and that takes time. The U.S. rig count has gone up but not enough to offset the loss of Russian oil. Canada, already the U.S.’s largest source of imported oil, could provide some more but not enough to make up for Russian imports. After hitting $130.50, WTI oil settled the week at $109.33, down 5.5% on the week.
For WTI oil it was a reversal week after hitting a 52-week high, but it was not an outside key reversal week. That signals that WTI oil could go through a short-term correction but does not necessarily signal a final top. We’d await a breakdown under $90 to confirm a possible top. Natural gas (NG) fell 6% on the week but it too is showing no signs of a top. As to the energy indices, the ARCA Oil & Gas Index (XOI) fell a small 0.4% while the TSX Energy Index (TEN) rose 1.2%. Both indices hit new 52-week highs. At this time, oil under $90 appears highly unlikely unless suddenly peace were at hand in Ukraine and sanctions were removed. The former, while possible, is unlikely and sanctions have a way of remaining forever. Hence the sticky points of dealing with both Iran and Venezuela, both of who want sanctions removed completely.
As to Russia, they can turn to China who will no doubt take up some of Russia’s oil. Huge distances and the need for more pipelines make that possible but very difficult. China is mostly not hampered by U.S. sanctions on Russia. China has been dealing with Iran despite sanctions.
Oil price spikes have preceded every recession since 1970, even if a sharp rise in oil prices was not the primary cause of the recession. There was also a spike into 2011; however, a recession was avoided although there was a slowdown, mostly sparked by the EU/Greek debt crisis. A recession does not necessarily follow immediately. High costs for gasoline and heating oil along with higher costs for just about everything are squeezing disposable incomes and that in turn most likely could lead to a recession.
As noted, oil has support down to $90 and, under $90, the odds favour that a top is in. More likely is higher prices to come with some calling for $150 and even $200 for oil. It is possible given the current environment. In the interim, a short-term correction is developing. Above $124 new highs are very likely.
Below we show our final chart of the WTI oil for the past 75 years. Note how each oil price spike (S) was a followed by recession (R). This time is not different.
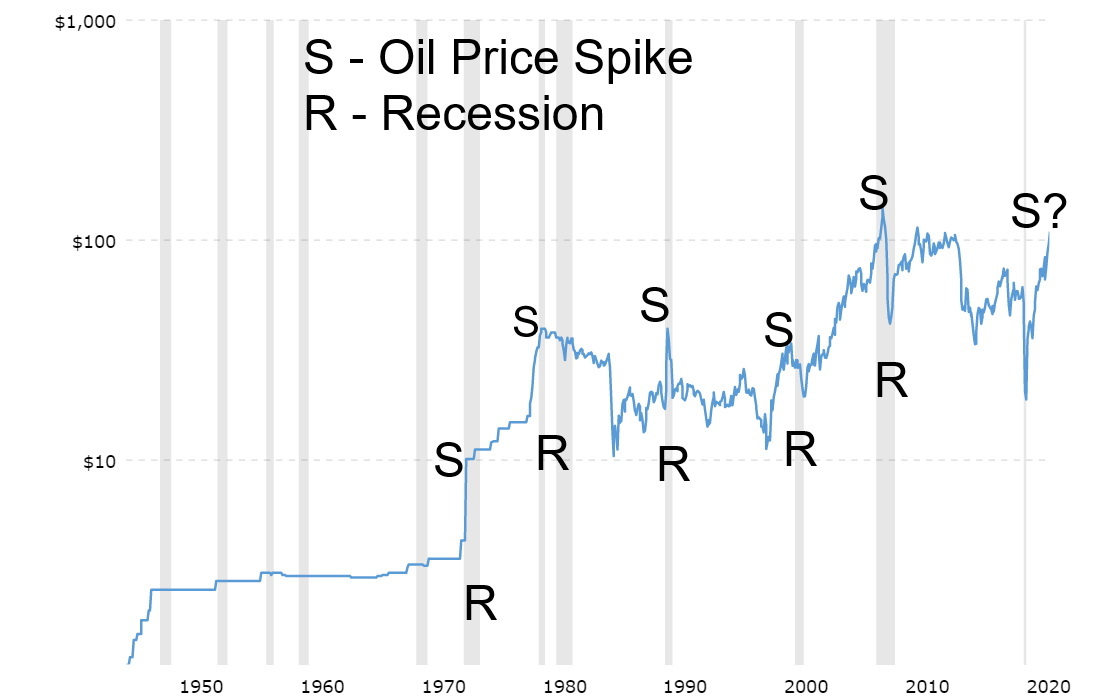
Source: www.macrotrends.net
Copyright David Chapman, 2022
|
GLOSSARY
Trends
Daily – Short-term trend (For swing traders) Weekly – Intermediate-term trend (For long-term trend followers) Monthly – Long-term secular trend (For long-term trend followers) Up – The trend is up. Down – The trend is down Neutral – Indicators are mostly neutral. A trend change might be in the offing. Weak – The trend is still up or down but it is weakening. It is also a sign that the trend might change. Topping – Indicators are suggesting that while the trend remains up there are considerable signs that suggest that the market is topping. Bottoming – Indicators are suggesting that while the trend is down there are considerable signs that suggest that the market is bottoming. |
Disclaimer
David Chapman is not a registered advisory service and is not an exempt market dealer (EMD) nor a licensed financial advisor. He does not and cannot give individualised market advice. David Chapman has worked in the financial industry for over 40 years including large financial corporations, banks, and investment dealers. The information in this newsletter is intended only for informational and educational purposes. It should not be construed as an offer, a solicitation of an offer or sale of any security. Every effort is made to provide accurate and complete information. However, we cannot guarantee that there will be no errors. We make no claims, promises or guarantees about the accuracy, completeness, or adequacy of the contents of this commentary and expressly disclaim liability for errors and omissions in the contents of this commentary. David Chapman will always use his best efforts to ensure the accuracy and timeliness of all information. The reader assumes all risk when trading in securities and David Chapman advises consulting a licensed professional financial advisor or portfolio manager such as Enriched Investing Incorporated before proceeding with any trade or idea presented in this newsletter. David Chapman may own shares in companies mentioned in this newsletter. Before making an investment, prospective investors should review each security’s offering documents which summarize the objectives, fees, expenses and associated risks. David Chapman shares his ideas and opinions for informational and educational purposes only and expects the reader to perform due diligence before considering a position in any security. That includes consulting with your own licensed professional financial advisor such as Enriched Investing Incorporated. Performance is not guaranteed, values change frequently, and past performance may not be repeated.
About the author


Website: https://www.enrichedinvesting.com
Disclaimer: David Chapman is not a registered advisory service and is not an exempt market dealer (EMD) nor a licensed financial advisor. We do not and cannot give individualised market advice. David Chapman has worked in the financial industry for over 40 years including large financial corporations, banks, and investment dealers. The information in this newsletter is intended only for informational and educational purposes. It should not be considered a solicitation of an offer or sale of any security. The reader assumes all risk when trading in securities and David Chapman advises consulting a licensed professional financial advisor before proceeding with any trade or idea presented in this newsletter. David Chapman may own shares in companies mentioned in this newsletter. We share our ideas and opinions for informational and educational purposes only and expect the reader to perform due diligence before considering a position in any security. That includes consulting with your own licensed professional financial advisor.