
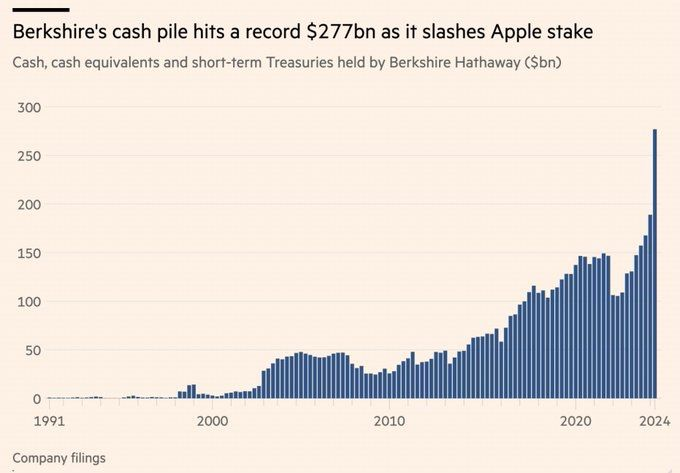
We've learned that Warren Buffett has sold half his stake in Apple, roughly $40 billion. He apparently also unloaded about $4 billion of Bank of America stock. Berkshire's cash pile now sits at an astounding $277 billion. What does Warren Buffett know that we don't know?
Source: www.crescat.net
Last Friday was diem horribilis thanks to the much lower than expected job numbers (See chart of the week (page 7)). No, it wasn't March 2020 bad but it was still jarring as markets all closed in the red this past week. Gold's didn't but they even joined the sell-off lastt Friday. The worst hit was energy as fear of recession overwhelmed fear of war that appears to be breaking out in the Middle East.
Canada is performing better than expected and we start out looking at that. The Fed held the line on interest rates this week as expected but now speculation is rampant they'll cut 50 bp in September. Still, everyone is hoping for a soft landing. Except for a look back over the past 50+ years suggests that is likely wishful thinking. Too much debt, rising delinquencies, and bankruptcies say it's more likely to be a hard landing. One stock poised to withstand these conditions is Dollarama Inc., a value retailer that sells seasonal and everyday essentials demanded despite economic weakness, that pays a dividend, reported increased sales, higher income, stronger gross margin, and an expanding geographic footprint, and that is held in the Enriched Capital Conservative Growth Strategy.*
As noted gold was one of the few bright spots this past week but even it went south last Friday along with everything else. Historically gold (the metal) does well in these market crashes but the stocks tend to get dumped along with everything else. We are entering the dangerous part of the year August - October and we are off to a bad start. But there is still a month and half of summer (a very hot summer) left. So enjoy what we can.
Have a great week.
DC
* Reference to the Enriched Capital Conservative Growth Strategy and its investments, celebrating a 5-year history of strong growth, is added by Margaret Samuel, President, CEO and Portfolio Manager of Enriched Investing Incorporated, who can be reached at 416-203-3028 or msamuel@enrichedinvesting.com
“Whom the gods would destroy, they first put on the cover of Business Week.”
Paul Krugman, American economist, Professor of Economics City University of New York, columnist NY Times, Nobel Prize economics 2008, refence us to the Enron CEO on the cover of Business Week 2/12/01; b. 1953“A statistician is someone who can draw a straight line from an unwarranted assumption to a foregone conclusion.”
Anonymous“A fanatic is one who can’t change his mind and won’t change the subject.”
Winston Churchill, British statesman, soldier, writer, Prime Minister of the United Kingdom 1940-1945, 1951-1955, Member of Parliament 1900-1964; 1874-1965Selected Indicators G7
|
Country G7 |
GDP % Change Year Ago (last) |
CPI % Change Year Ago (last) |
Unemployment Rate (last) |
Budget Balance % of GDP |
Government Debt to GDP % |
Central Bank Rate % |
|
|
|
|
|
|
|
|
|
United States |
2.9 |
3.0 |
4.1 |
(6.3) |
123.3 |
5.50 |
|
Japan |
(0.7) |
2.8 |
2.5 |
(4.8) |
254.6 |
0.25 |
|
United Kingdom |
0.3 |
2.0 |
4.4 |
(4.2) |
104.3 |
5.25 |
|
Canada |
0.5 |
2.7 |
6.4 |
(1.1) |
104.7 1. |
4.50 |
|
Germany |
1.3 |
2.3 |
6.0 |
(5.2) |
63.7 |
4.25 |
|
France |
(0.2) |
2.3 |
7.5 |
(4.6) |
111.6 |
4.25 |
|
Italy |
0.7 |
0.8 |
6.8 |
(5.4) |
142.0 |
4.25 |
|
Euro Area |
0.4 |
2.6 |
6.4 |
(3.1) |
- |
4.25 |
Source: www.economist.com, www.tradingeconomics.com, www.imf.org
Includes provincial debt Canada’s economy unexpectedly grew in May 2024, surpassing expectations of the Bank of Canada (BofC). Growth was up 0.2% vs. expected growth of 0.1%. That helped take Q2 growth 2.2% again, surpassing expectations. The expectation for Q2 was for growth of only 1.5%. For 2024, the current estimate is 1.8%. The
0.5% growth reported above is for Q1 on a year-over-year basis. Based solely on the May numbers, Canada’s economy is performing better than most expected. That led us to think about how Canada stacks up against its G7 compatriots. Better than expected, according to some. Canada is not necessarily leading the pack, but then again it is not the laggard. Japan and France are already considered to be in recession with the United Kingdom not far behind. Canada’s inflation rate compares favourably with the others, while its unemployment is not the highest. However, it should be noted that how unemployment is calculated can vary from country to country. The result is for some it tends to lower the unemployment rate while others such as Canada report a more elevated rate. It is a bit of an apples and oranges thing. Where Canada really shines is that they have the lowest budget balance as a percentage of GDP of any G7 country. Canada’s widely reported government debt to GDP includes provincial debt. Without the provincial debt, the federal debt to GDP drops to 69.6% as of March 2024. Source: www.ceicdata.com. Fed Rate with 10-year U.S. Treasury Rate, U.S. Inflation Rate 2014–2024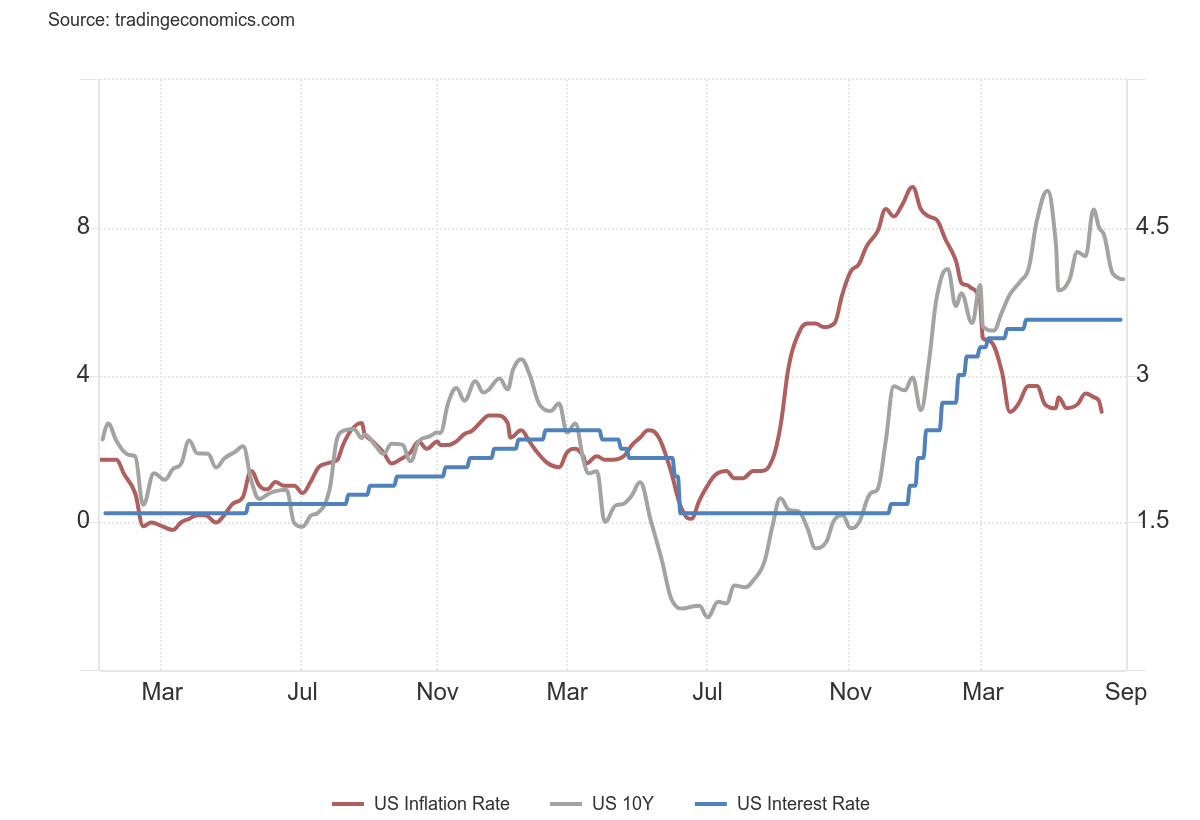
Source: www.tradingeconomics.com, www.federalreserve.gov, www.bls.gov
It was not unexpected that the Fed left interest rates unchanged at its July 30–31 FOMC. The focus now shifts to September, where it is widely expected that the Fed will make their first interest rate cut. The Fed noted that things are slowing down as much as they had hoped for. So far, there are few signs that a slowdown could turn into a hard landing, despite rising bankruptcies in the corporate market, particularly commercial real estate, consumers feeling the pinch as delinquencies on homes rise, and a number of regional banks wavering. As we’ve always noted, it would take a systemic shock to the financial system to turn what some believe is a soft landing into a more dangerous drop for the markets and the economy. Notably, the U.S. 10-year treasury note fell under 4% this past week, the US$ Index fell, gold rose, and the stock market rose at least until it didn’t. The swaps market is now pricing in three rate cuts this year with the first cut in September. Signs of slowing came in the rising weekly claims report, and U.S. manufacturing sliding in July.
The jobs report (covered in chart of the week) was another catalyst. Even the Fed admitted that a rate cut in September is highly probable. Maybe that’s why it wasn’t a surprise that the Fed was a hot topic of conversation everywhere. While all eyes were on the Fed, the Bank of England (BOE) did cut rates. The U.K. economy has been weak so this cut was not a surprise. Going the opposite way was the Bank of Japan (BOJ), who hiked rates. But then its bank rate remains ridiculously low, below the rate of inflation and most Japanese treasury securities. That rate has been suppressed for far too long. The long sinking Japanese yen leaped upward. Oil prices leaped and gold jumped to $2,500. But this was in response to the assassination of a Hamas leader in Tehran, Iran. That event, coupled with the Israeli attack on Beirut, is threatening to set the entire Middle East ablaze. The job numbers put a damper on both energy and gold. Soft landing or hard landing? Everyone hopes for a soft landing. But the reality is, it’s more than likely to be a hard landing. The record since 1970 is not good. And the table next does not include market meltdowns in 1987 and 1998 that required massive intervention from the monetary authorities to prevent a financial collapse. No recession occurred at the time.
The solution for every recession (or near recession) since the October 1987 collapse has been to pump in more and more liquidity and lower interest rates sharply. But what happens instead is the huge liquidity and low interest rates cause bubbles—in stocks, housing, and more. And the debt to fuel the recovery keeps on rising. The U.S. recently surpassed $35 trillion in federal debt. Everyone knows it will never be paid back. Now interest payments alone on the debt are approaching $1 trillion/annually. But governments weren’t the only ones as corporations and consumers also added trillions in debt. However, corporations and consumers are not the
government and they actually have to pay their debts. As we’ve said many times, the monetary authorities are caught between a rock and hard place. The question we keep asking is, do they have enough bullets left to meet the next financial crisis? We wonder.
|
Recession |
Stock Market Decline % S&P 500 |
GDP Decline % |
Max Unemployment |
|
|
|
|
|
|
Recession of 1969–1970 |
(36.1)% |
(0.6)% |
6.1% |
|
1973–1975 Recession |
(48.2)% |
(3.2)% |
9.0% |
|
1980 Recession |
(27.1)% |
(2.2)% |
7.8% |
|
1981–1982 Recession |
(33.5)% |
(2.7)% |
10.8% |
|
Early 1990s Recession (1990–1991) |
(19.9)% |
(1.4)% |
7.8% |
|
Early 2000s Recession (2001–2002) |
(49.1)% |
(0.3)% |
6.3% |
|
Great Recession (2007–2009) |
(56.8)% |
(5.1)% |
10.0% |
|
COVID Recession (2020) |
(33.9)% |
(19.2)% |
14.7% |
|
Average |
(38.1)% |
(4.4)% |
9.1% |
Source: www.stocktradersalmanac.com, www.wikipedia.org
Chart of the WeekU.S. Employed Person, Unemployed Persons (Thousands)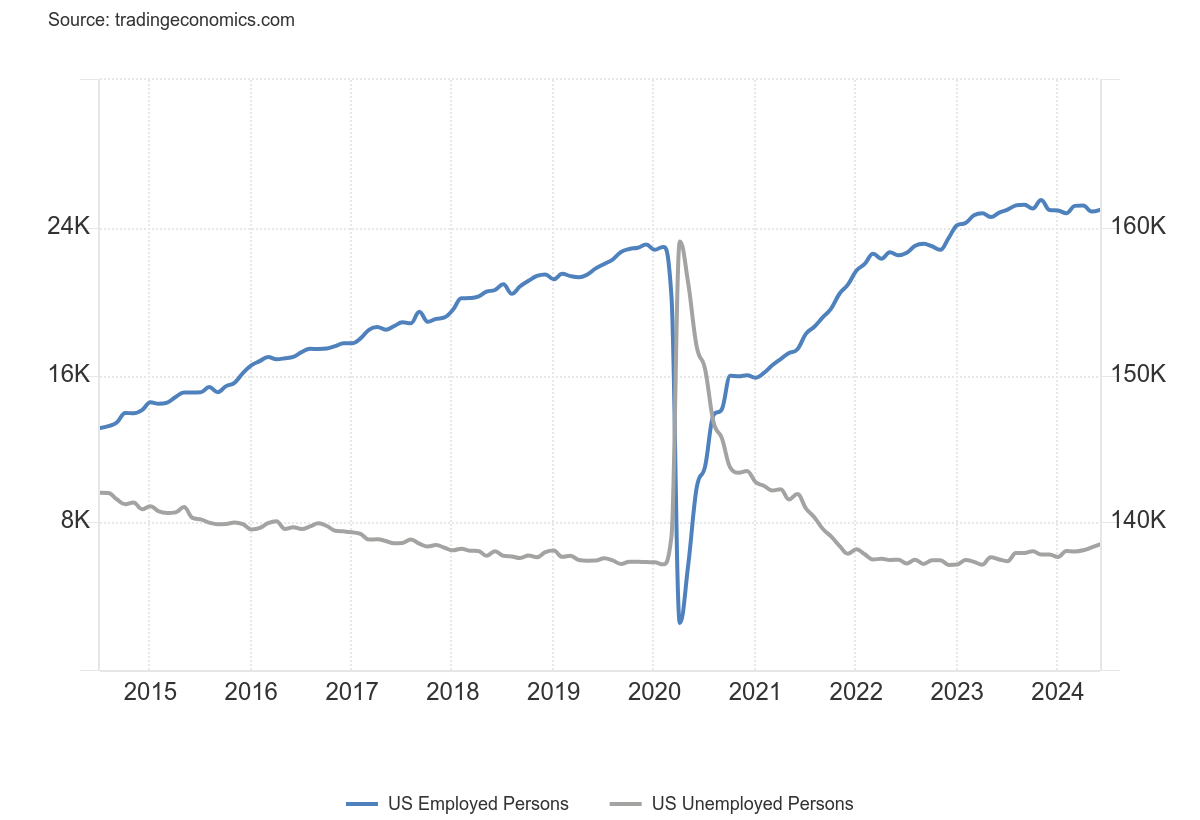
Source: www.tradingeconomics.com, www.bls.gov
We suppose it was inevitable. Finally, an employment report that came in well below expectations. This had been building for some time. The good news is it hasn’t turned negative, yet. It’s no surprise, however, that they are now beginning to talk that the Fed will cut 50 bp in September, not 25 bp. They may be getting a bit ahead of themselves.Nonfarm payrolls rose less than expected to 114,000 in July.
The consensus had been anywhere from 175,000 to 190,000. The unemployment rate (U3) jumped to 4.3% from 4.1%. The U6 unemployment rate (U3 plus all persons marginally attached to the labour force, plus total employed part-time for economic reasons, as a percent of the civilian labour force, plus all persons marginally attached to the labour force) jumped to 7.8% from 7.4%. We don’t have Shadow Stats unemployment number but we suspect it also rose.
As usual, there are a number of irreconcilable differences between the household survey and the establishment survey. In the household survey they contact individual households, as opposed to business establishments that are only under the establishment survey. The establishment survey covers the nonfarm payrolls, while the household survey cover everything else. Here, the civilian labour force jumped 420,000 in July. And the total employment level rose 67,000. As a result, the labour force participation rate rose to 62.7% from 62.6% while the employment population ratio fell to 60.0% from 60.1%. Those reported as not in the labour force fell 214,000. It was not immediately obvious where they all went, but with the civilian labour force up 420,000, they appear to have joined the labour force and helped push up the labour force participation rate. This is the fourth month in a row for the unemployment rate to rise.
Even the Fed is on record saying they expect unemployment could hit 4.5% by year end. The Fed is walking that fine line of trying to engineer a soft landing but continuing to allow the economy to expand. That might work until an accident comes along. Still, that has not stopped the speculation they’ll cut 50 bp in September. Bond yields have come down, the 10-year falling to 3.82%. That’s the lowest since December 2023. We note the number of unemployed for 27 weeks or longer is rising again. This has been steadily rising of late. Jobs are literally drying up. The number of those working part-time for economic reasons is also rising.
Oddly, last month full-time employment rose while part-time employment fell. This is the report we’ve been expecting. But for many it could set off alarm bells that the economy is really beginning to sink. The stock market is sensing it too and the sell-off is underway on what was overvalued in the first place. The housing market will also feel the pain. Canada reports its job numbers next week.
Markets & Trends
|
|
|
|
% Gains (Losses) Trends |
|
||||
|
|
Close Dec 31/23 |
Close Aug 2, 2024 |
Week |
YTD |
Daily (Short Term) |
Weekly (Intermediate) |
Monthly (Long Term) |
|
|
Stock Market Indices |
|
|
|
|
|
|
|
|
|
S&P 500 |
4,769.83 |
5,346.56 |
(2.1)% |
12.1% |
down |
up |
up |
|
|
Dow Jones Industrials |
37,689.54 |
39,737.26 |
(2.1)% |
5.4% |
neutral |
up |
up |
|
|
Dow Jones Transport |
15,898.85 |
15,381.52 |
(3.4)% |
(3.3)% |
neutral |
up |
up |
|
|
NASDAQ |
15,011.35 |
16,776.16 |
(3.4)% |
11.8 |
down |
up |
up |
|
|
S&P/TSX Composite |
20,958.54 |
22,227.63 (new highs)* |
(2.6)% |
6.1% |
neutral |
up |
up |
|
|
S&P/TSX Venture (CDNX) |
552.90 |
555.56 |
(4.1)% |
0.5% |
down |
neutral |
up (weak) |
|
|
S&P 600 (small) |
1,318.26 |
1,350.34 (new highs)* |
(5.5)% |
2.4% |
neutral |
up |
up |
|
|
MSCI World |
2,260.96 |
2,310.85 |
(1.4)% |
2.2% |
down |
up |
up |
|
|
Bitcoin |
41,987.29 |
62,636.40 |
(7.3)% |
49.2% |
neutral |
up |
up |
|
|
|
|
|
|
|
|
|
|
|
|
Gold Mining Stock Indices |
|
|
|
|
|
|
|
|
|
Gold Bugs Index (HUI) |
243.31 |
293.27 |
0.2% |
20.5% |
up |
up |
up |
|
|
TSX Gold Index (TGD) |
284.56 |
351.70 |
1.3% |
23.6% |
up |
up |
up |
|
|
|
|
|
|
|
|
|
|
|
|
% |
|
|
|
|
|
|
|
|
|
U.S. 10-Year Treasury Bond yield |
3.87% |
3.80% |
(9.5)% |
(1.2)% |
|
|
|
|
|
Cdn. 10-Year Bond CGB yield |
3.11% |
3.02% |
(9.9)% |
(2.9)% |
|
|
|
|
|
Recession Watch Spreads |
|
|
|
|
|
|
|
|
|
U.S. 2-year 10-year Treasury spread |
(0.38)% |
(0.12)% |
40.0% |
68.4% |
|
|
|
|
|
Cdn 2-year 10-year CGB spread |
(0.78)% |
(0.19)% |
32.1% |
75.6% |
|
|
|
|
|
|
|
|
|
|
|
|
|
|
|
Currencies |
|
|
|
|
|
|
|
|
|
US$ Index |
101.03 |
103.23 |
(1.0)% |
2.2% |
down |
down (weak) |
up (weak) |
|
|
Canadian $ |
75.60 |
72.20 |
(0.3)% |
(4.5)% |
down |
down |
down |
|
|
Euro |
110.36 |
109.12 |
0.5% |
(1.1)% |
up |
up (weak) |
neutral |
|
|
Swiss Franc |
118.84 |
116.43 |
2.9% |
(2.0)% |
up |
up |
up |
|
|
British Pound |
127.31 |
128.09 |
(0.5)% |
0.6% |
neutral |
up |
neutral |
|
|
Japanese Yen |
70.91 |
68.21 |
4.9% |
(3.8)% |
up |
up (weak) |
down |
|
|
|
|
|
|
|
|
|
|
|
|
|
|
|
|
|
|
|
|
|
|
Precious Metals |
|
|
|
|
|
|
|
|
|
Gold |
2,071.80 |
2,469.80 (new highs)* |
3.7% |
19.2% |
up |
up |
up |
|
|
Silver |
24.09 |
28.39 |
1.3% |
17.9% |
down |
up |
up |
|
|
Platinum |
1,023.20 |
967.60 |
2.5% |
(5.4)% |
down |
neutral |
neutral |
|
|
|
|
|
|
|
|
|
|
|
|
Base Metals |
|
|
|
|
|
|
|
|
|
Palladium |
1,140.20 |
882.50 |
(0.5)% |
(22.6)% |
down |
down |
down |
|
|
Copper |
3.89 |
4.10 |
(0.5)% |
5.4% |
down |
neutral |
up (weak) |
|
|
|
|
|
|
|
|
|
|
|
|
Energy |
|
|
|
|
|
|
|
|
|
WTI Oil |
71.70 |
73.52 |
(4.7)% |
2.4% |
down |
down |
down |
|
|
Nat Gas |
2.56 |
1.97 |
(3.9)% |
(23.1)% |
down |
down |
down |
|
Source: www.stockcharts.com Note: For an explanation of the trends, see the glossary at the end of this article.
New highs/lows refer to new 52-week highs/lows and, in some cases, all-time highs.
* New All-Time Highs
Source: www.stockcharts.com
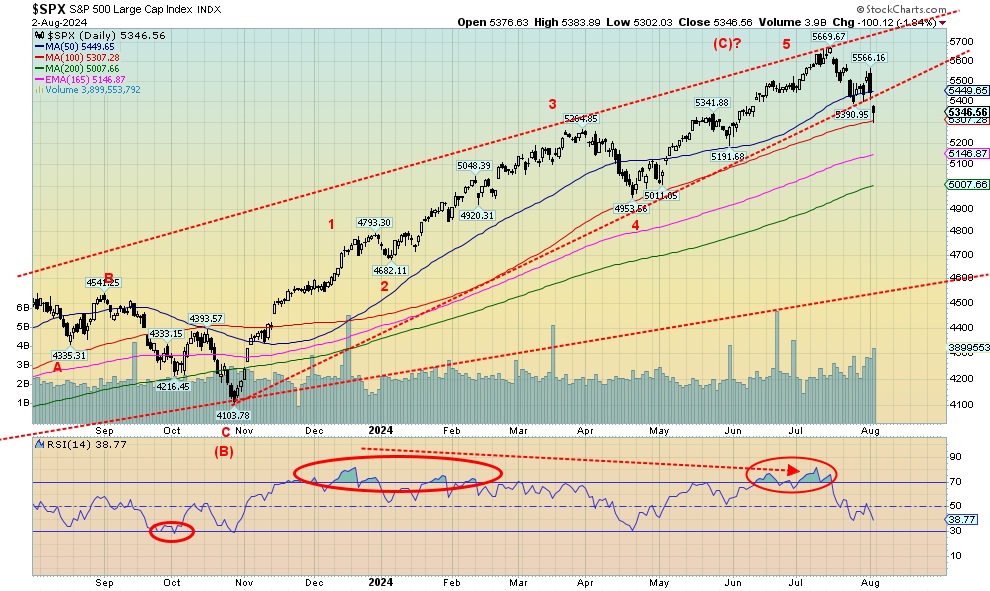
It was a nasty two-day crash. The good news is we’ve seen a lot worse, just not recently. The S&P 500 (SPX) cracked our uptrend line. We are now falling out from what may be an ascending wedge triangle. Targets would normally be all the way back to that October 2023 low of 4,103. That’s a 28% decline from the top. For a hard landing decline, that fall could be considered normal. On the week, the SPX fell 2.1%, the Dow Jones Industrials (DJI) dropped 2.1%, the Dow Jones Transportations (DJT) was worse, down 3.4%, while the NASDAQ dropped 3.4% as well. The smaller stocks were hit as the S&P 400 (Mid) fell 4.1% and the S&P 600 (Small) dropped 5.5% after making new all-time highs.
The days of all-time highs may soon be but a distant memory. Bitcoin was beat up, falling 7.3%. In Canada, the TSX fell 2.6% after making all-time highs, while the TSX Venture Exchange (CDNX) was hammered lower by 4.1%. In the EU, the London FTSE fell 1.3%, the EuroNext was off 3.5%, the Paris CAC 40 fell 3.5%, and the German DAX dropped 4.1%. In Asia, China’s Shanghai Index (SSEC) was a bit of a bright spot, up 0.5%, but the Tokyo Nikkei Dow (TKN) fell 4.7% and Hong Kong’s Hang Seng (HSI) fell 1.5%. The MSCI World Index dropped 1.4%.
August is generally considered the second worst month of the year. The worst month, September, follows. So, this sell-off may just be getting underway. Does it lead to a panic? A reminder that it could, but would be more likely to occur in September rather than August. Then there is October, famous for its crashes. As they might say—fasten your seatbelts, we’re in for a bumpy ride.The worse than expected jobs report was definitely a catalyst for the sell-off. So was word of the assassination in Tehran, sparking fears of a wider Middle East war. Everyone now is expecting a weaker economy and all the signs are there (as if there weren’t signs before this sell-off). Profit-taking, short-term trading, and hedge funds contributed to a pile-on, contributing further to the drop. Still, all this didn’t stop some from coming out and saying this is all overblown and this pullback is a buying opportunity. Maybe they are right. We just wouldn’t bet too heavily on it. Some were annoyed the Fed didn’t cut rates on Wednesday at its FOMC meeting. But then expectations of a rate cut were low. Now everyone is focusing on September, with many now calling for a 50 bp cut. Maybe, but the Fed will want to see more evidence and would not be knee-jerked by one bad employment report.
The breakdown for the SPX appears to be our best witness that a drop is getting underway. Numerous divergences at the top, a giddy market with all all-time highs, and a feeling nothing could stop this market. Until it does. A drop under 5,200 could seal the deal. Regaining back above 5,570 gives it hope once again. But that October 2023 low looks a long way off. It just might not occur overnight. 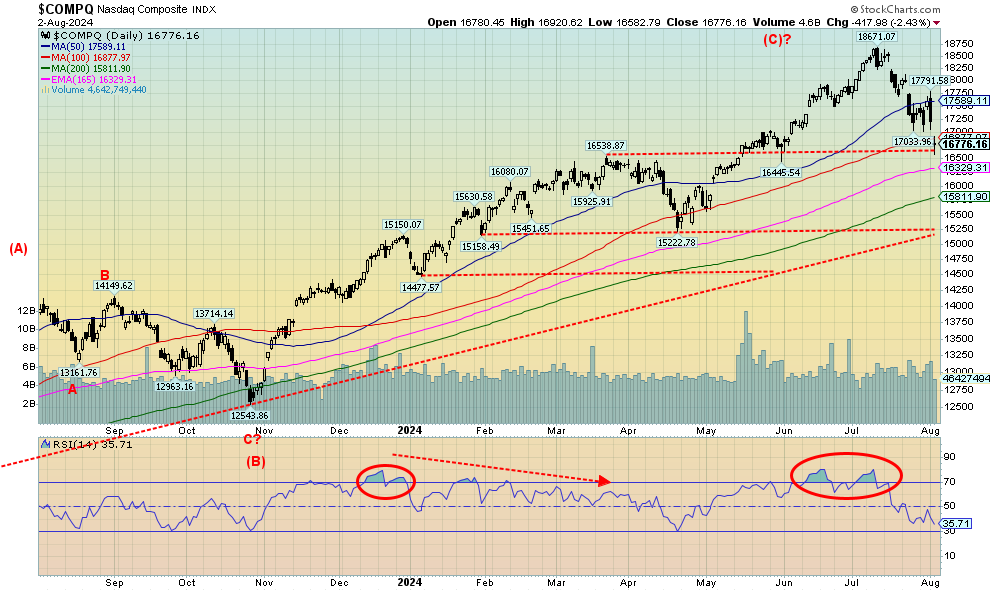
Source: www.stockcharts.comIt was not an enjoyable week for the NASDAQ. It fell a sharp 3.4%, led by the sinking FAANGs. The NY FANG Index fell 3.3%. The Semi-Conductor Index (SOX) dropped 9.7%, led by a 26% collapse from Intel. Leading the Mag 7 down was Amazon, off 8.0%. Meta actually rose 4.8% while Apple was up 0.9%. The rest were down with Tesla next, down 5.2%. Billionaires’ net worth was being trimmed (think Bezos and Musk). We suppose the only good news is that the NASDAQ is still above a more significant breakdown zone near 16,775. Under 16,445, its official that the top is in. Long-term support is way down at 15,250. That’s down almost 20% from the all-time high. No matter how we look at it, the sell-off now appears to be underway. 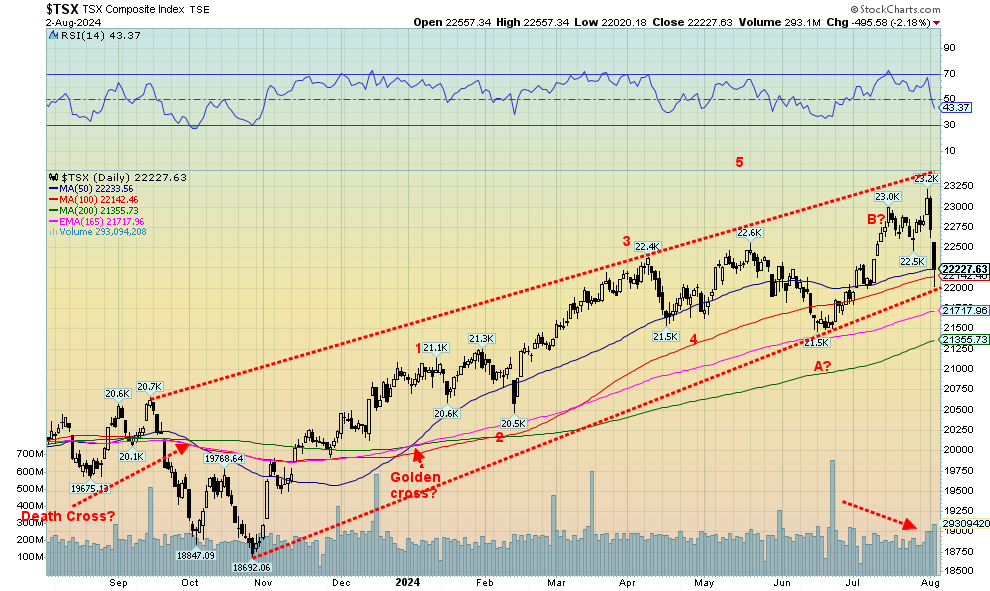
Source: www.stockcharts.com
A new all-time high followed by a two-day reversal to the downside saw the TSX Composite lose 2.6% this past week and drop 4.2% from its all-time high. Volume, that had been low on the final rise to the top, rose as the market fell. Is this a dramatic end to the bull market? A number of sell signals were seen as a result. No, we haven’t officially turned the trend down just yet, but this past week is a blow to the rally. Numerous negative divergences were seen at the top. If there was one consolation for the TSX, it is that its junior partner the TSX Venture Exchange (CDNX) fell even more, losing 4.1% on the week. There was little joy for the sub-indices either, with two exceptions. Yes, two closed the week up and maybe they are worth a look as defensive stocks. The two were Telecommunications (TTS), gaining 3.4%, and Utilities (TUT) up 1.3%. Golds (TGD) hung in with a gain of 1.3% even as it came off its high.
Everyone else fell, led by Information Technology (TKK), down 7.2%, while Energy (TEN) dropped 4.9% as oil prices fell. Consumer Staples (TCS) hit all-time highs but still closed down 0.9%. No surprise that the TSX 60 hit all time highs and closed down 2.6%, underperforming even the broader TSX. Noteworthy was Financials (TFS), losing 3.0%. The TSX hit down to support near 22,000, but a break now under that level would signal we are moving to the next part of the down phase. Final support lies around 21,500 and 21,300. Under 20,900 we enter official correction territory. Right now, the only thing that could save this market is new highs and that we are not expecting.
U.S. 10-year Treasury Note, Canada 10-year bond CGB
Source: www.tradingeconomics.com, www.home.treasury.gov, www.bankofcanada.ca
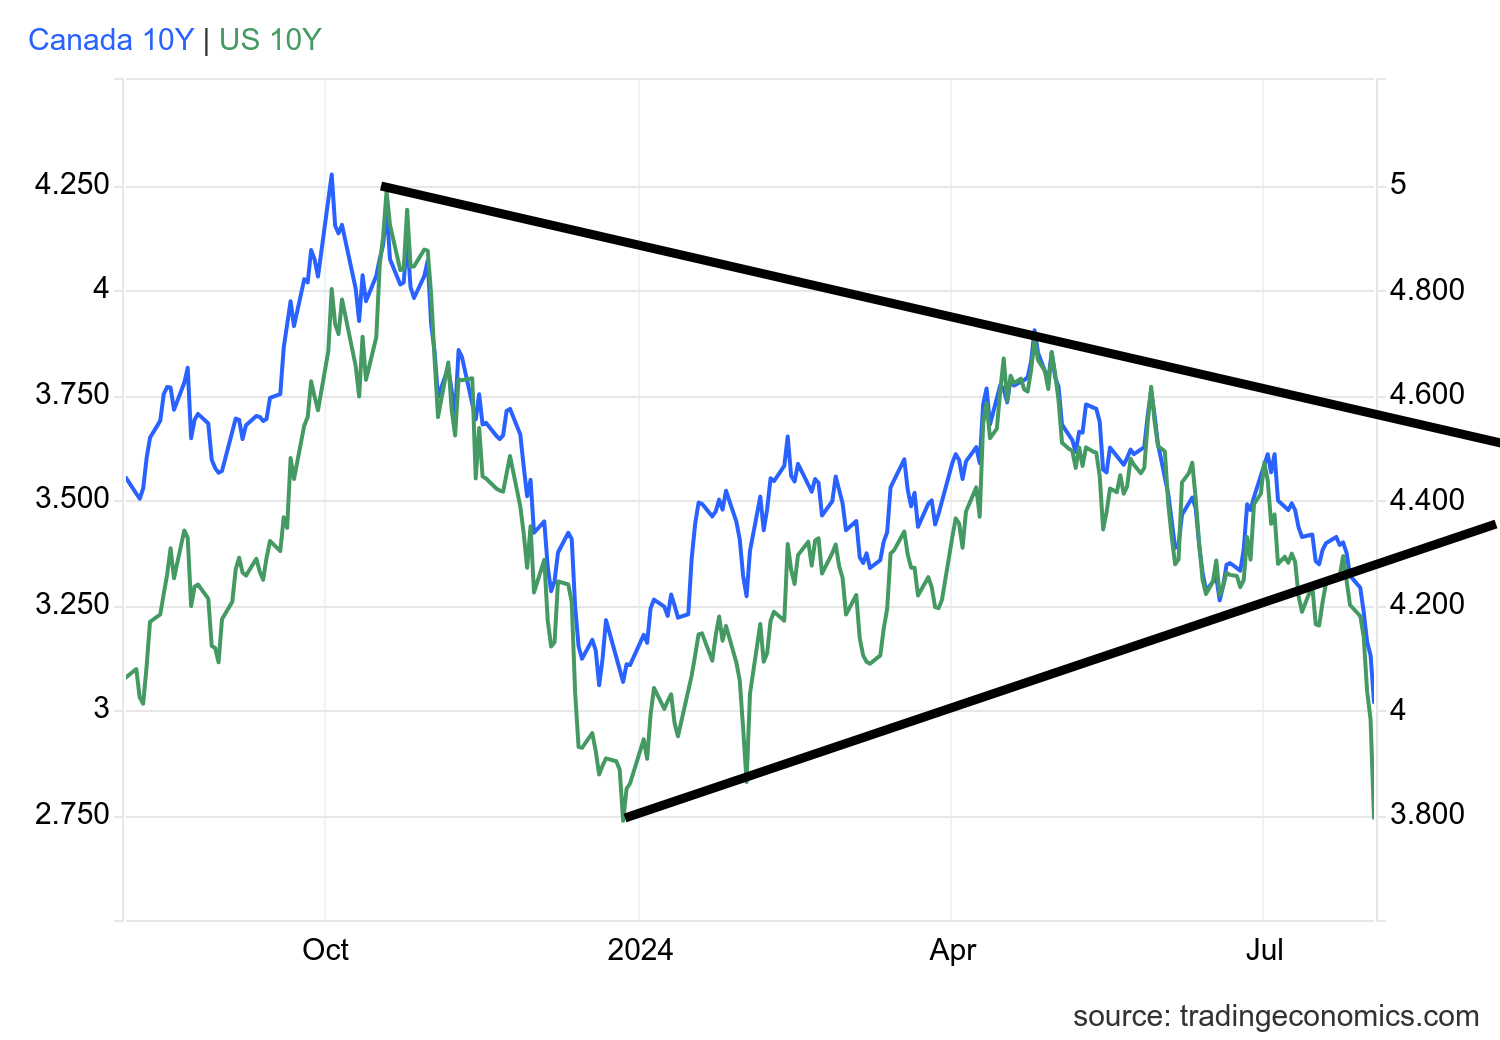
Bond yields tumbled this past as weak economic numbers triggered thoughts of Fed cuts in September. Many are now saying that the Fed will cut 50bp. But before everyone gets on their high horse about rate cuts, 25 bp is probable but more could be wishful thinking. The Fed won’t be bullied into rate cuts. The Fed is much more measured and will wish to see more than one month’s data. The only caveat to that is if a major financial crisis broke out as was the case in 2008 and 2020. They may have gone too low too fast, causing bubbles. Was it measured? Or a panic? The only other weak number that caught our attention was the Chicago PMI that was expected to come in at 47.8 but came weaker at 45.3. That’s recession territory. The U.S. 10-year treasury note fell to 3.80% from 4.20%, the lowest level since 2021. In Canada, the 10-year Government of Canada bond (CGB) fell to 3.02% from 3.35%. Recession warning signs are now everywhere as the 2–10 spread narrowed to negative 12 bp from negative 20 bp. Ditto in Canada, falling to negative 19 bp from negative 28 bp. A normalizing yield curve puts us that much closer to a recession, which we now believe could start in Q4 2024.
This was inevitable once the Fed started hiking rates in 2022. It’s just that we have never seen such a long period of an inverted yield curve before a recession starts. All of this suggests to us that this won’t be a soft landing but instead a hard landing with the worst to come. Bankruptcies are rising everywhere—in the U.S. and Canada. The housing market, particularly in Canada, is tipping over badly and people are not used to falling house prices. Panic could set in. We’ve never seen a panic in the housing market but it is possible. Right now, many are refusing to lower their price because they will lose money. Losing money on your home is almost unheard-of. But someone will budge and an avalanche could get underway. For buyers, the word might be “wait.” But in a sinking market that price you paid could be lower the next week. It’s worse in the condo market where there are literally dozens of one-bedroom condos available. Many have been on the market for months with no takers. But if it falls to the bank, the bank will be just happy to get something back, even if it’s not 100% of their mortgage. The commercial real estate market is the same, as developments have ground to a halt and developers are going under. But will it all be enough to threaten the large banks? Small banks, yes, where in the U.S. a number of regional banks are already in trouble. But we are not hearing of any large money center banks in trouble. That would spark a panic. Not a lot this coming week. The ISM PMI numbers are out and we get Canada’s job numbers on Friday.
Source: www.stockcharts.com
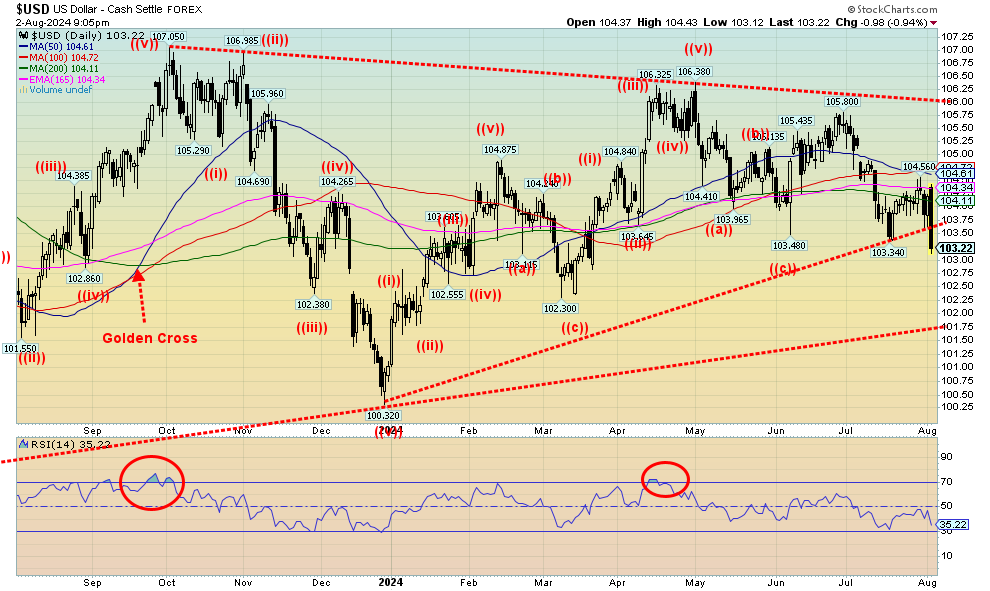
The US$ Index reacted quite negatively to Friday’s job numbers as it fell almost a full point or 1%. In doing so, the US$ Index broke a key trendline below 103.75. We now appear to be in the next move to the downside where initial good support is at 101.75. On the week, the US$ Index lost just over 1.0%. The winners were the euro up 0.5%, the Swiss franc up 2.9%, and the Japanese yen up 4.9% (the big winner), thanks to the BOJ finally hiking their grossly suppressed interest rates. Losers were the pound sterling down 0.5% and the Cdn$ off about 0.3%. This breakdown was not a surprise, given the charts seemed to be suggesting the breakdown. The bad job numbers on Friday were the catalyst. Not sure if any was related to the goings-on in the Middle East. A downtrend is underway and our expectations are we are headed lower. Only regaining above 104.50 could change things. 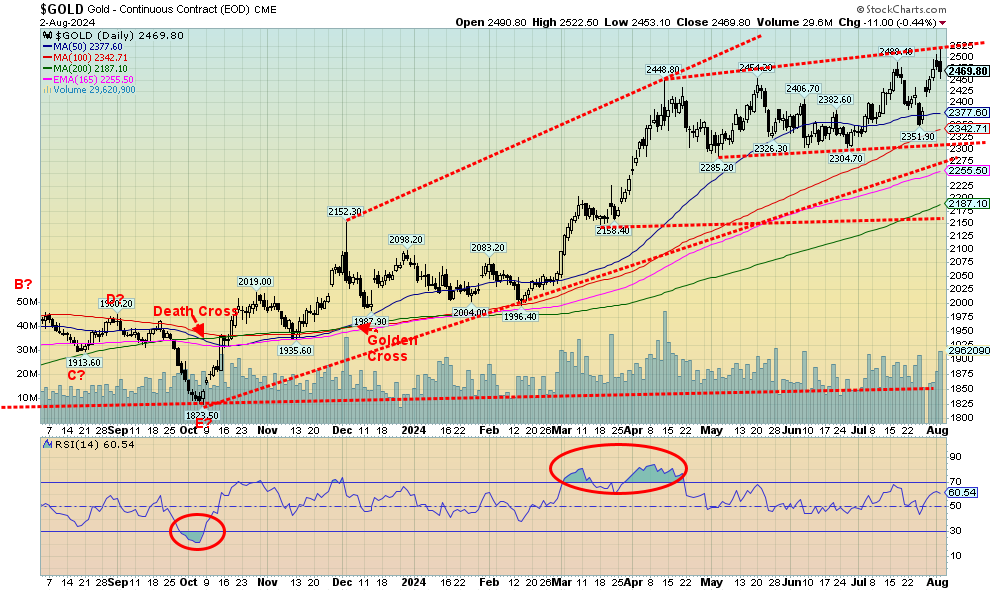
Source: www.stockcharts.com
Gold once again made new all-time highs and, for the first time ever, hit $2,500. But these round numbers also bring out a tendency to sell once they hit them. Gold peaked out at $2,522, then promptly reversed and closed lower on Friday. The job numbers seemed to act as a catalyst even if we did find it odd, given the big drop in the US$ Index. We were also buoyed by what we believed was an ABCDE-type pattern that appeared to form following that initial high back in April at $2,448. We thought the pattern might be finished with the E drop to $2,351 last week. Then came the ceiling at $2,500. So now we need to break and close above $2,525 to tell us we are indeed headed higher. Friday’s job report should have been music to gold’s ears. Initially it was. Then it wasn’t. It could just be a knee-jerk reaction to the sell-off in the stock market that prompted a wave of some profit-taking to set in for gold that prompted the reversal. On the week, gold was golden, gaining 3.7% to new all-time highs over $2,500. Silver would have been delighted to have followed suit, but it lagged, gaining only 1.3%. Platinum gained 2.5% but remains down 5.4% in 2024. Palladium is miserable, falling 0.5% this past week, and is down 22.6% in 2024. Copper, which had earlier made all-time highs remains in a funk, losing 0.5% but remaining up 5.4% in 2024. The gold stocks were higher but came off with the stock market sell-off. Still, the Gold Bugs Index (HUI) held on for a 0.2% gain and the TSX Gold Index (TGD) was up 1.3%. But Friday’s sell-off did them no favours.
Certainly, the catalysts are there for gold, which is why we believe this is just another temporary setback. A weakening economy and the Fed poised to cut rates in September (some think they’ll act even earlier) and not only cut but make it a big one of 50 bp. Then there is the almost ensured expansion of the Middle East war into Lebanon and even Iran, following that assassination in Tehran. The U.S. may want to put an end to it, but then they move more war ships into the area. As well, Iranian proxies are most likely poised to hit U.S. bases in Iraq. The Iraqi government has long asked the U.S. to leave. None of this appears to be conducive to peace. And that in turn should be positive for gold as a safe haven. If this is a new leg to the upside, we need to hold support at $2,425. If that breaks, then this upswing is in question. A break under $2,400 could send us tumbling to $2,325 and send us scrambling trying to figure out this new unfolding pattern. Meanwhile, we now need to regain and take out $2,525 to tell us we are headed higher. Despite gold’s volatility this past week, the stock market is even more volatile—which highlights that when the stock markets crash, gold goes down but a lot less than the stock markets. Hence, its safe haven appeal.
Source: www.stockcharts.com
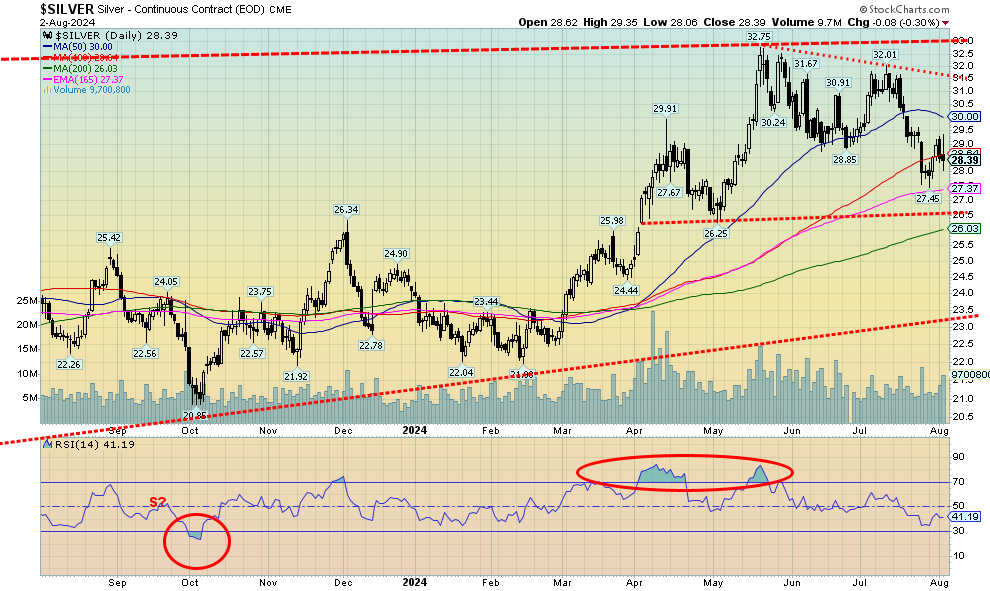
While gold prices once again made new all-time highs and finished the week to the upside, silver was up but it was a struggle and once again it underperformed. We’ve constantly noted this ongoing divergence between the two precious metals and we continue to hold that we can’t make serious headway unless both are at least making new highs. This past week, silver finished nowhere near its most recent high of $32.75, let alone all-time highs. Silver did gain 1.3% on the week, but that was underwhelming compared to gold’s 3.7% gain and new all-time highs. Until silver starts being the leader we need it to be, we remain bullish but cautious on the precious metals market. Despite it all, silver remains up 17.9% in 2024 but that is underwhelming to gold’s 19.2% gain. We do see support down to $27.50 and better support at $26.50, but we wouldn’t want to see a breakdown under $26.50. Longer term support at $23.50 is a way off. Meanwhile, to the upside, we need to regain above $31.50 to suggest new highs above $32.75. If there is any consolation, we could be completing an ABC correction of silver in its rise from $21 to $32.75. If that is correct, then we could be nearing the end of the correction. But that doesn’t change our need to regain above $31.50 to tell us this correction is over.
Source: www.stockcharts.com
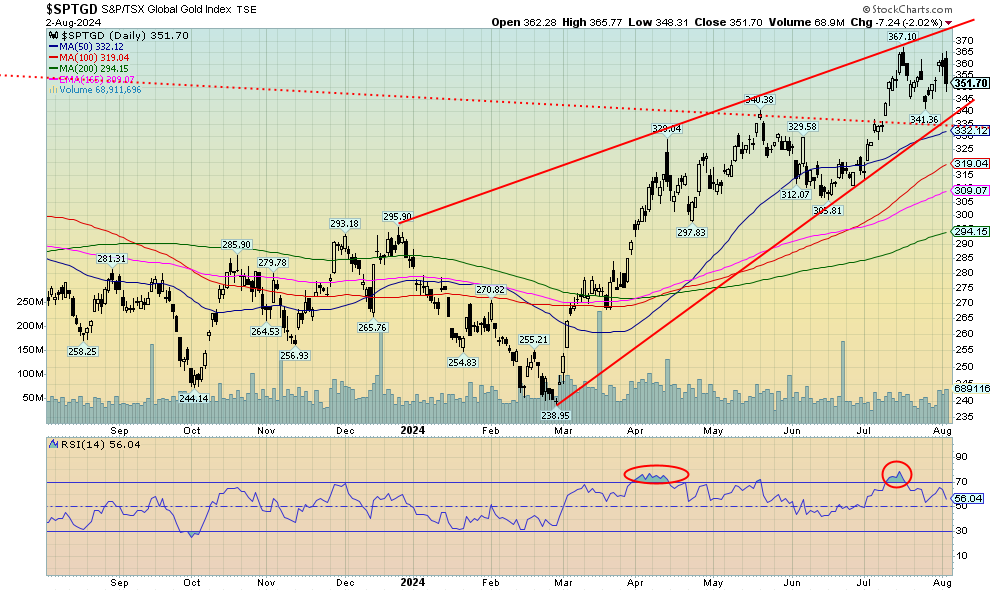
The gold stocks were on their way to recovering the earlier highs—then came Friday and the U.S. job numbers and everything was hit. It seems to happen all the time that when the stock market falls, gold stocks usually get hit as well. At least they are starting from a higher level. We reversed on Friday to the downside, suggesting we may have made a temporary top. If we are making an ABC-type correction, then this could be the start of the C wave. The gold stock indices ended mixed this past week with the TSX Gold Index (TGD) gaining 1.3% while the Gold Bugs Index (HUI) clung to a 0.2% gain on the week. It could have been worse. Our key support line lies near 335. A break under that level and especially under 332 suggests lower prices ahead. Support comes in around 320 and again around 310. There are some divergences but not any major ones so we suspect this is a correction to the recent uptrend but not the end of the uptrend. That might change if we were to break under 305 and especially under 295. Initially, however, we can’t say whether 335 will hold. We have the makings of an ascending wedge triangle but it is not totally clear. Initially at least, we’ll see if 335 holds. A swing down target could be around 315 if 335 were to break.
Source: www.stockcharts.com
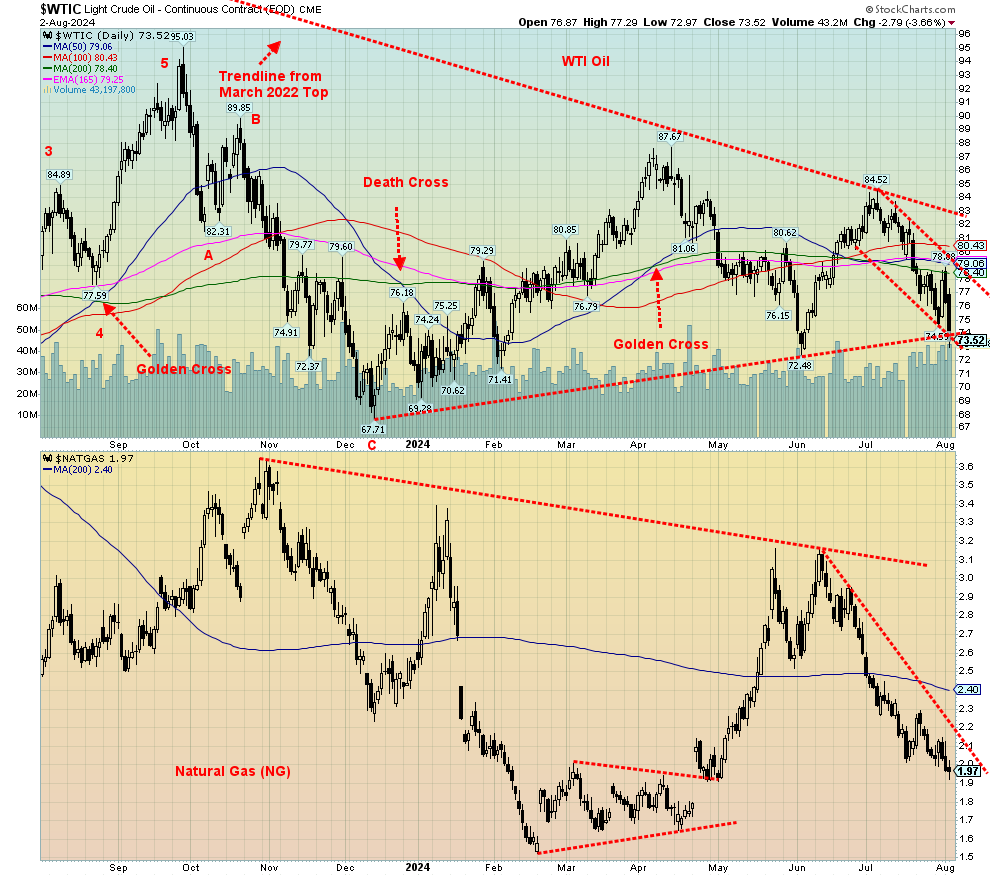
The fear of recession and lower demand quickly overwhelmed the fear of war in the Middle East, after the assassination of the Hamas political leader in Tehran. Following that killing, oil soared, then just as quickly reversed course. It fell the next day and then on Friday, after the weaker than expected U.S. job numbers, oil was slaughtered. On the week, oil fell over $3.60 or 4.7%. Brent crude fell 4.3%. The energy stocks were dumped as the ARCA Oil & Gas Index (XOI) dropped 5.0% while the TSX Energy Index (TEN) fell 4.9%. Natural gas (NG) didn’t save the day as it fell 3.9%.
NG at the Henry Hub fell because of a larger than expected build. Storage tanks are full, over 16% over the five-year average. But over in the EU it was the opposite as NG at the Dutch Hub leaped 27% as fear for supplies grew with the ongoing war between Israel/Gaza, and the potential for the war to widen to include Israel/Lebanon and Israel/Iran. That, plus the hurricane season in the Gulf of Mexico as another hurricane rises in the region. The only bright spot for NG in North America is the ongoing heat wave. We suppose if there is any good news for oil prices, it is that they appear to have fallen to the bottom of a channel and they are hitting support of the rising trend line from the December 2023 low. Volume did pick up on the drop. If we were to break down under $72, then we could be headed for a much steeper fall. But a rebound here would not be surprising, given the strong support here. However, the reality is we must then take out $78/$79 to suggest higher. Above $80 would be even better, but a more significant breakout does not occur until over $83. We are somewhat oversold here but not overwhelmingly, so more downside is possible. However, the strong support here suggests otherwise. Await the rebound. Middle East tensions, we suspect, could be the catalyst.
Copyright David Chapman 2024
GLOSSARY Trends
Daily – Short-term trend (For swing traders)
Weekly – Intermediate-term trend (For long-term trend followers)
Monthly – Long-term secular trend (For long-term trend followers)
Up – The trend is up.
Down – The trend is down
Neutral – Indicators are mostly neutral. A trend change might be in the offing.
Weak – The trend is still up or down but it is weakening. It is also a sign that the trend might change.
Topping – Indicators are suggesting that while the trend remains up there are considerable signs that suggest that the market is topping.
Bottoming – Indicators are suggesting that while the trend is down there are considerable signs that suggest that the market is bottoming.
David Chapman is not a registered advisory service and is not an exempt market dealer (EMD) nor a licensed financial advisor. He does not and cannot give individualised market advice. David Chapman has worked in the financial industry for over 40 years including large financial corporations, banks, and investment dealers. The information in this newsletter is intended only for informational and educational purposes. It should not be construed as an offer, a solicitation of an offer or sale of any security. Every effort is made to provide accurate and complete information. However, we cannot guarantee that there will be no errors. We make no claims, promises or guarantees about the accuracy, completeness, or adequacy of the contents of this commentary and expressly disclaim liability for errors and omissions in the contents of this commentary. David Chapman will always use his best efforts to ensure the accuracy and timeliness of all information. The reader assumes all risk when trading in securities and David Chapman advises consulting a licensed professional financial advisor or portfolio manager such as Enriched Investing Incorporated before proceeding with any trade or idea presented in this newsletter. David Chapman may own shares in companies mentioned in this newsletter. Before making an investment, prospective investors should review each security’s offering documents which summarize the objectives, fees, expenses and associated risks. David Chapman shares his ideas and opinions for informational and educational purposes only and expects the reader to perform due diligence before considering a position in any security. That includes consulting with your own licensed professional financial advisor such as Enriched Investing Incorporated. Performance is not guaranteed, values change frequently, and past performance may not be repeated.
About the author


Website: https://www.enrichedinvesting.com
Disclaimer: David Chapman is not a registered advisory service and is not an exempt market dealer (EMD) nor a licensed financial advisor. We do not and cannot give individualised market advice. David Chapman has worked in the financial industry for over 40 years including large financial corporations, banks, and investment dealers. The information in this newsletter is intended only for informational and educational purposes. It should not be considered a solicitation of an offer or sale of any security. The reader assumes all risk when trading in securities and David Chapman advises consulting a licensed professional financial advisor before proceeding with any trade or idea presented in this newsletter. David Chapman may own shares in companies mentioned in this newsletter. We share our ideas and opinions for informational and educational purposes only and expect the reader to perform due diligence before considering a position in any security. That includes consulting with your own licensed professional financial advisor.