
Hola from Mexico. Interesting journey so far. Fascinating and chaotic.
Markets too can be fascinating and chaotic. Inflation is alive and well. Against an inflationary backdrop, cash-strapped shoppers turn to discount stores such as Dollarama, which reported increased sales and higher income, pays a dividend and is held in the Enriched Capital Conservative Growth Strategy.* Hotter than everyone expected and it spooked the markets. Rate cuts? Fugetaboutit. And economies are slowing as more fall into recession. Risks remain. Geopolitical, domestic, commercial real estate, bank failures. Where will it be?
Oil rising as geopolitical concerns rise. Gold fell then bounced back and silver leaped. Other commodities, particularly copper, also improved this past week. Natural gas sank to new lows. Are commodities turning? Gold stocks dirt cheap. Stock market is too expensive. A turn coming?
Our markets and trends table is at the end.
Markets closed on Monday in both Canada and the U.S.
Weather great in Mexico then all of a sudden it was rainy and cold. Water shortages here so rain is welcomed. But the trip has been good. Have a great week!
DC
* Reference to the Enriched Capital Conservative Growth Strategy and its investments, celebrating a 6-year history of strong growth, is added by Margaret Samuel, President, CEO and Portfolio Manager of Enriched Investing Incorporated, who can be reached at 416-203-3028 or msamuel@enrichedinvesting.com
“Among individuals as among nations, respect for the rights of others is peace.”
—Benito Juarez, Mexican liberal lawyer, 26th president of Mexico 1858–1872, a Zapotec and first indigenous president of Mexico, known for his significant contributions to Mexico’s history; 1806–1872
This may not come as a surprise but, as we suspected all along, the Fed won’t be cutting interest rates anytime soon. It was a big week for inflation numbers. First CPI came in at 3.1%, largely as expected, but the core CPI was 3.9%, above the expected 3.7%. The previous month saw the CPI at 3.4% and the core at 3.9%. All good? Not so fast. Nobody seemed to like it as USDX soared, bond yields rose, and the stock markets and gold fell sharply. The S&P 500 (SPX) gapped down, leaving us wondering whether we have seen our top.
But no, SPX recovered and seemed headed back to the highs, even filling the gap. However, along came the PPI and it jumped 0.9% for January. Except they expected only 0.8% and December’s was 1%. The core PPI was 0.5% above the expected 0.1% and December’s negative 0.1%. The markets freaked again and dropped Friday. But gold bounced back and silver leaped. Not helping were retail sales, only 0.6% for January when they expected 5.8% and December’s number was 5.6%. Not good.
Odds of a rate cut in March are now about zip. Odds of a rate cut in May/June? Falling fast. And now, poor retail sales, poor industrial production as well—does stagflation loom? Manufacturing production year-over-year was negative 0.9%, well below the expected gain of 1.5%. But despite layoffs everywhere, it seems the most recent weekly claims were only 212,000 below the expected 220,000 and last week’s 220,000. Go figure.
The U.K. and Japan have now both entered an official recession (two consecutive quarters of negative growth), albeit a mild one. Mild, so far is the operative word. Japan has now slipped to the 4th largest economy. Japan and the U.K. now join Germany and a wobbling entire EU and eurozone. The U.S.? Not even close, it seems—hence, the strong USDX and gold struggling. Bond yields are rising again as the 10-year U.S. treasury note jumped this past week to 4.28%, up from 4.18%, and in Canada the 10-year Government of Canada bond (CGB) rose to 3.59% from 3.55%. The 2–10 spreads widened to 36 bp and 71 bp respectively, delaying the recession in both Canada and the U.S.
Despite the week for the stock market that saw the S&P 500 fall 0.4%, the Dow Jones Industrials (DJI) down 0.1%, the Dow Jones Transportations (DJT) down sharply 3.6% and continuing its negative divergence with the DJI, and, the NASDAQ off 1.3%, the bullish consensus still remains at extreme greed. At the other end, the Gold Miners Bullish Percent Index (BPGDM) is at 17.86. Okay, not extreme—3.45 in October 2023 was closer to extreme. As well, we were a bit surprised to see that the Gold/Gold Bugs Index (HUI) ratio was at 9.73, down from a high just recently at 10.24. In 2015 at the bottom, it hit 10.90 and way back in 2000 which was a major bottom for gold stocks before we took off for a solid decade from 2000–2011 it was only at 7.46.
All this suggests to us that if gold stocks are not at a bottom, they are so close to it that the odds of further significant declines are about zip. Those already long can take some solace. We’re overdue.
Gold/HUI Ratio
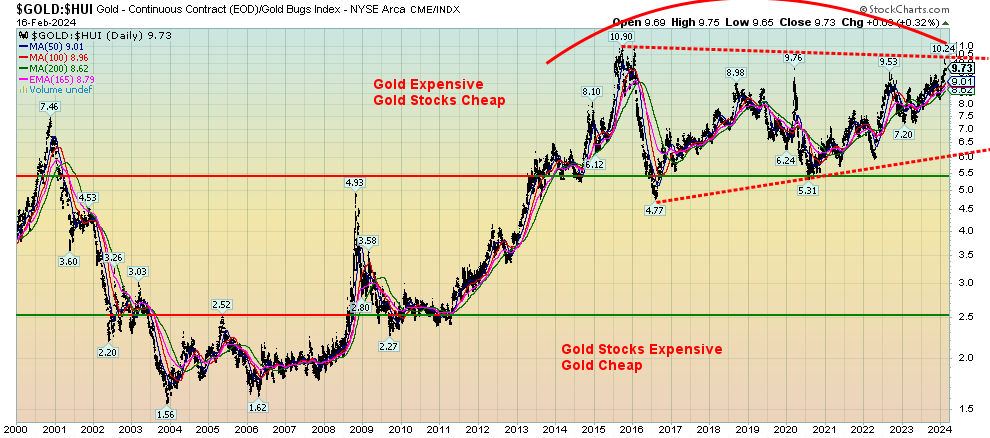
Source: www.stockcharts.com
As for the stock market, with so many making new all-time highs and the week closing mostly down, the odds are rising that we may have made a significant top. Joining the all-time highs’ lower close were the New York FANG Index and Microsoft. Other FAANGs made all-time highs but didn’t close lower, including Meta, Nvidia, and Snowflake. In the EU, the Paris CAC 40, the German DAX, and the EuroNext made all-time highs but held their gains. In Canada, Industrials (TIN) and Information Technology (TKK) both made all time highs that along with Energy (TEN) and Materials (TMT) helped the TSX Composite move to new 52-week highs. The TSX 60 also made new 52-week highs. And, in a surprise move, the TSX Venture Exchange (CDNX) was up 1.9% on the week bucking negativity elsewhere.
The fact that most indices held their gains means the rally may not be over just yet and could still run up into March, just like the dot.com bubble did in 2000. SPX needs to break 4,900 and then 4,800 to give us some sell signals. The daily MACD indicator is rolling over and on the verge of a sell signal. One really needs to the weekly MACD to roll over and that’s not close.
This week could decide. If we recover and move higher again, March is looking like our top. But if just those points we noted above break, then a top could be in. A break of 4,650 would be a weekly breakdown and confirm a top. Buying up here is not recommended unless you are going after energy and golds. Energy in particular is being driven by growing dangerous geopolitical events, but WTI oil still needs to get over $80 to give us a confirmed buy signal. Warm weather is keeping natural gas (NG) in the dumpster as it hit a 52-week
low closing at $1.61.
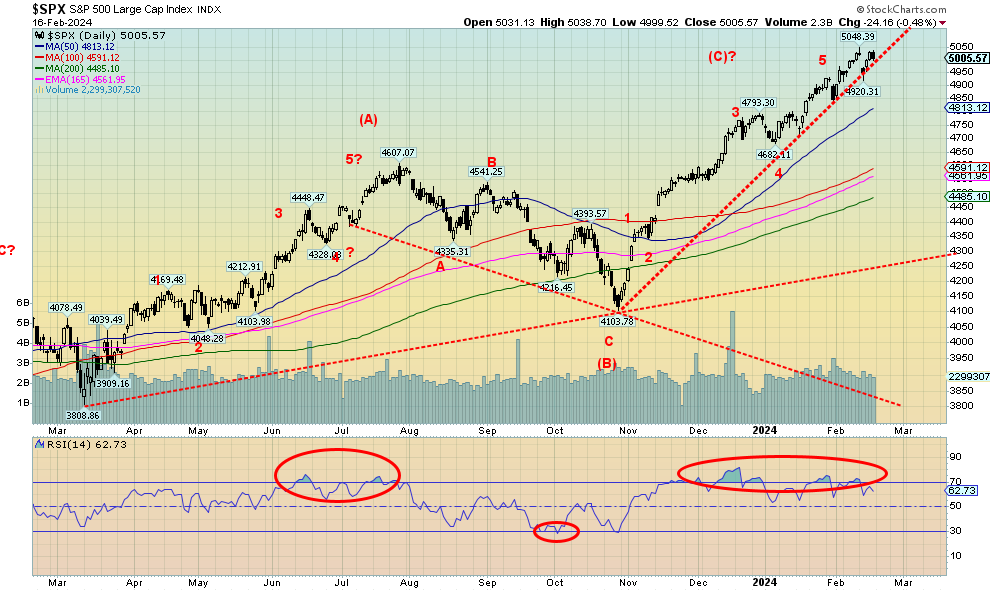
Source: www.stockcharts.com
Gold managed to recover at week’s end and still closed lower on the week, thanks to a strong USDX and rising bond yields. While gold was down 0.7% on the week, silver starred, up 3.9%, and closed over 23. Platinum +4.0%, palladium +9.61%, and copper +4.4% all hinted for us that something could get going across the spectrum for the precious metals and the metals, even as the gold indices were still down on the week. The Gold Bugs Index (HUI) fell 1.4% while the TSX Gold Index (TGD) was down 0.2%, but both were down a lot more earlier, bouncing back nicely at week’s end. The TGD made lower lows below October 2023 and the HUI basically met the October low. Notably gold itself did not. As we noted, the Gold/HUI ratio and sentiment suggests we are at or very close to a low for the gold stock indices.
Gold needs to take out $2,050, $2,060, $2,080, and $2,100 to convince us we are moving higher. The commercial COTs for both gold and silver perked up this past week and look better. Silver still needs to take out $24, $25 and once above $26 we will have a confirmed low and will be most likely headed to $30.
The geopolitical situation is deteriorating particularly in the Mid-East. The entire region is a powder keg. Costs to companies are rising because of the situation in the Red Sea. That’s inflationary. The domestic political scene is also a concern as the U.S. marches towards a potentially very confrontational election in November. We’ve seen a rise not just in attack ads but also false AI generated ads as the rhetoric rises. Risks remain in commercial real estate and the banking sector as many fund managers become concerned about a systemic event that could put the global financial system at risk. We live in increasingly dangerous times and ultimately that is good for gold. Got some?
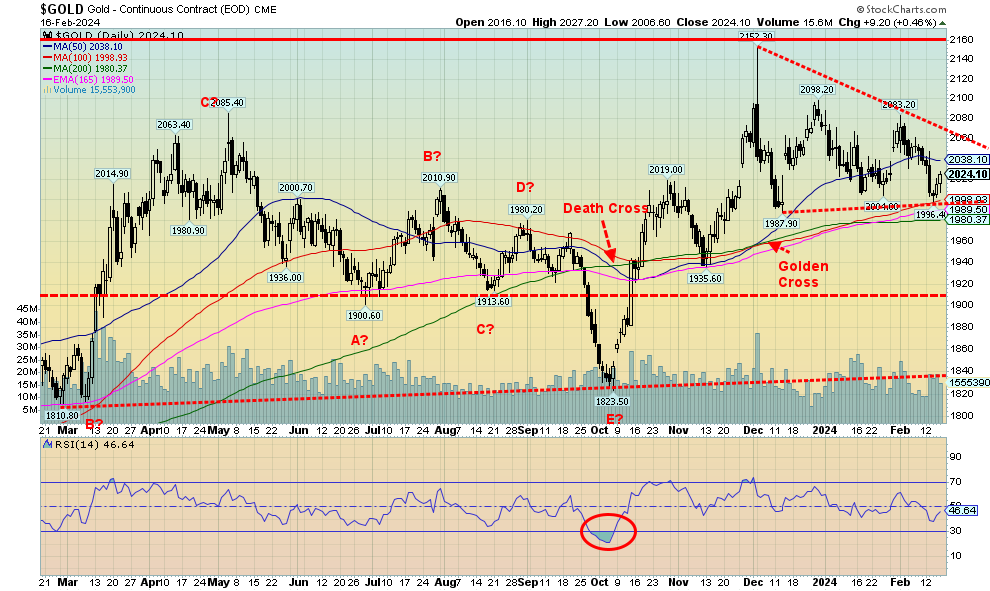
Source: www.stockcharts.com
Copyright David Chapman 2024
Markets & Trends
|
|
|
|
% Gains (Losses) Trends |
|
||||
|
|
Close Dec 31/23 |
Close Feb 16 , 2024 |
Week |
YTD |
Daily (Short Term) |
Weekly (Intermediate) |
Monthly (Long Term) |
|
|
Stock Market Indices |
|
|
|
|
|
|
|
|
|
S&P 500 |
4,769.83 |
5,005.57 (new highs)* |
(0.4)% |
4.9% |
up |
up |
up |
|
|
Dow Jones Industrials |
37,689.54 |
38,627.99 (new highs)* |
(0.1%) |
2.5% |
up |
up |
up |
|
|
Dow Jones Transport |
15,898.85 |
15,629.19 |
(3.6%) |
(1.7%) |
up |
up |
up |
|
|
NASDAQ |
15,011.35 |
15,775.65 (new highs) |
(1.3)% |
5.1% |
up |
up |
up |
|
|
S&P/TSX Composite |
20,958.54 |
21,255.61 (new highs) |
1.2% |
1.4% |
up |
up |
up |
|
|
S&P/TSX Venture (CDNX) |
552.90 |
556.76 |
1.9% |
0.7% |
up |
down (weak) |
down |
|
|
S&P 600 (small) |
1,318.26 |
1,304.98 |
1.3% |
(1.0)% |
up |
up |
up (weak) |
|
|
MSCI World |
2,260.96 |
2,256.63 |
0.8% |
(0.2)% |
up |
up |
up (weak) |
|
|
Bitcoin |
41,987.29 |
51,565.94 (new highs) |
8.7% |
22.8% |
up |
up |
up |
|
|
|
|
|
|
|
|
|
|
|
|
Gold Mining Stock Indices |
|
|
|
|
|
|
|
|
|
Gold Bugs Index (HUI) |
243.31 |
207.96 |
(1.4)% |
(14.5)% |
down |
down |
down |
|
|
TSX Gold Index (TGD) |
284.56 |
251.57 |
(0.2)% |
(11.6)% |
down |
down |
down |
|
|
|
|
|
|
|
|
|
|
|
|
% |
|
|
|
|
|
|
|
|
|
U.S. 10-Year Treasury Bond yield |
3.87% |
4.28% |
2.4% |
11.6% |
|
|
|
|
|
Cdn. 10-Year Bond CGB yield |
3.11% |
3.59% |
1.1% |
15.4% |
|
|
|
|
|
Recession Watch Spreads |
|
|
|
|
|
|
|
|
|
U.S. 2-year 10-year Treasury spread |
(0.38)% |
(0.36)% |
(20.0)% |
5.3% |
|
|
|
|
|
Cdn 2-year 10-year CGB spread |
(0.78)% |
(0.71)% |
(6.00)% |
9.0% |
|
|
|
|
|
|
|
|
|
|
|
|
|
|
|
Currencies |
|
|
|
|
|
|
|
|
|
US$ Index |
101.03 |
104.28 |
0.2% |
3.2% |
up |
up (weak) |
up (weak) |
|
|
Canadian $ |
75.60 |
74.27 |
flat |
(1.8)% |
down |
neutral |
down |
|
|
Euro |
110.36 |
107.75 |
(0.1)% |
(2.4)% |
down |
neutral |
down (weak) |
|
|
Swiss Franc |
118.84 |
113.64 |
(0.6)% |
(4.4)% |
down |
up |
up |
|
|
British Pound |
127.31 |
126.00 |
(0.3)% |
(1.0)% |
down |
neutral |
neutral |
|
|
Japanese Yen |
70.91 |
66.57 |
(0.6)% |
(6.1)% |
down |
down |
down |
|
|
|
|
|
|
|
|
|
|
|
|
|
|
|
|
|
|
|
|
|
|
Precious Metals |
|
|
|
|
|
|
|
|
|
Gold |
2,071.80 |
2,024.10 |
(0.7)% |
(2.3)% |
down |
up |
up |
|
|
Silver |
24.09 |
23.48 |
3.9% |
(2.5)% |
neutral |
down |
neutral |
|
|
Platinum |
1,023.20 |
913.50 |
4.0% |
(10.7)% |
down |
down |
down |
|
|
|
|
|
|
|
|
|
|
|
|
Base Metals |
|
|
|
|
|
|
|
|
|
Palladium |
1,140.20 |
952.80 |
9.6% |
(16,4)% |
down |
down |
down |
|
|
Copper |
3.89 |
3.84 |
4.4% |
(1.3)% |
neutral |
down (weak) |
down |
|
|
|
|
|
|
|
|
|
|
|
|
Energy |
|
|
|
|
|
|
|
|
|
WTI Oil |
71.70 |
78.46 |
2.1% |
9.3% |
up |
neutral |
neutral |
|
|
Nat Gas |
2.56 |
1.61 (new lows) |
(13.0)% |
(37.1)% |
down |
down |
down |
|
Source: www.stockcharts.com
Note: For an explanation of the trends, see the glossary at the end of this article.
New highs/lows refer to new 52-week highs/lows and, in some cases, all-time highs.
- * New All-Time Highs
GLOSSARY
Trends
Daily – Short-term trend (For swing traders)
Weekly – Intermediate-term trend (For long-term trend followers)
Monthly – Long-term secular trend (For long-term trend followers)
Up – The trend is up.
Down – The trend is down
Neutral – Indicators are mostly neutral. A trend change might be in the offing.
Weak – The trend is still up or down but it is weakening. It is also a sign that the trend might change.
Topping – Indicators are suggesting that while the trend remains up there are considerable signs that suggest that the market is topping.
Bottoming – Indicators are suggesting that while the trend is down there are considerable signs that suggest that the market is bottoming.
Disclaimer
David Chapman is not a registered advisory service and is not an exempt market dealer (EMD) nor a licensed financial advisor. He does not and cannot give individualised market advice. David Chapman has worked in the financial industry for over 40 years including large financial corporations, banks, and investment dealers. The information in this newsletter is intended only for informational and educational purposes. It should not be construed as an offer, a solicitation of an offer or sale of any security. Every effort is made to provide accurate and complete information. However, we cannot guarantee that there will be no errors. We make no claims, promises or guarantees about the accuracy, completeness, or adequacy of the contents of this commentary and expressly disclaim liability for errors and omissions in the contents of this commentary. David Chapman will always use his best efforts to ensure the accuracy and timeliness of all information. The reader assumes all risk when trading in securities and David Chapman advises consulting a licensed professional financial advisor or portfolio manager such as Enriched Investing Incorporated before proceeding with any trade or idea presented in this newsletter. David Chapman may own shares in companies mentioned in this newsletter. Before making an investment, prospective investors should review each security’s offering documents which summarize the objectives, fees, expenses and associated risks. David Chapman shares his ideas and opinions for informational and educational purposes only and expects the reader to perform due diligence before considering a position in any security. That includes consulting with your own licensed professional financial advisor such as Enriched Investing Incorporated. Performance is not guaranteed, values change frequently, and past performance may not be repeated.
About the author


Website: https://www.enrichedinvesting.com
Disclaimer: David Chapman is not a registered advisory service and is not an exempt market dealer (EMD) nor a licensed financial advisor. We do not and cannot give individualised market advice. David Chapman has worked in the financial industry for over 40 years including large financial corporations, banks, and investment dealers. The information in this newsletter is intended only for informational and educational purposes. It should not be considered a solicitation of an offer or sale of any security. The reader assumes all risk when trading in securities and David Chapman advises consulting a licensed professional financial advisor before proceeding with any trade or idea presented in this newsletter. David Chapman may own shares in companies mentioned in this newsletter. We share our ideas and opinions for informational and educational purposes only and expect the reader to perform due diligence before considering a position in any security. That includes consulting with your own licensed professional financial advisor.