
The U.S. stock market just keeps going up, up, up. Meanwhile, both gold and oil churn depending on the president's whims and his pronouncements that peace is at hand or we'll obliterate them tomorrow. This week peace is at hand so oil falls sharply while gold rises. Next week?
One thing that caught our eye was the record margin debt outstanding. As the stock market rises, margin debt increases. Can that be? Risk on. Inflation and maybe now a hint of stagflation as Q1 GDP disappoints while PCE prices—the Fed's favourite inflation measurement—rise. One sector that is resilient to inflation is the convenience and fuel retailer, including stocks such as Alimentation Couche-Tard Inc., which reported increased revenues, expanded gross profit, and higher net earnings, pays a dividend, and is held in the Enriched Capital Conservative Growth Strategy.* Not only is consumer sentiment at an all-time low, but household savings are also near an all-time low. Not a good sign. Further, we find that employee compensation is sliding as a percentage of income while corporate profits soar. Another sign of the K economy.
Copper demand is rising. Couple that with shortages, and you have the recipe for record copper prices. This week's chart of the week looks at Freeport McMoran, the world's largest copper company.
This week, stocks hit a record high again, oil was clobbered, while gold rose. Bond yields also fell, but indications are that the market expects them to rise further. What will this coming week bring?
This week, we get both the U.S. and Canadian May job numbers. Right now, the market forecasts weak job growth. But these numbers have a tendency to surprise. We await.
Have a great week!
DC
* Reference to the Enriched Capital Conservative Growth Strategy and its investments, celebrating an
8.25 - year history of 191% growth (annual 13.85%), is added by Margaret Samuel, President, CEO and Portfolio Manager of Enriched Investing Incorporated, who can be reached at 416-203-3028 or msamuel@enrichedinvesting.com This information should not be construed as an offer, or a solicitation of an offer or sale of any security. Past performance does not guarantee future returns.
“Instead of destroying an area for a paltry amount of oil, we should be increasing fuel standards for automobiles and focusing our efforts on biofuels and other alternatives.”
—Raul Grijalva, American politician and activist, member of House of Representatives from Arizona (2003–2025), member Democratic Party; 1948–2025
“Our Congress passes laws which subsidize corporation farms, oil companies, airlines, and houses for suburbia. But when they turn their attention to the poor, they suddenly become concerned about balancing the budget and cut back on the funds for Head Start, Medicare, and mental health appropriations.”
—Coretta Scott King, American author, activist, civil rights leader, wife of Martin Luther King, Jr.; 1927–2006
“Whaling was the oil business of its day.”
—Nathaniel Philbrick, American author of history, finalist for Pulitzer Prize, maritime history book In the Heart of the Sea: The Tragedy of the Whaleship Essex (2000) won the National Book Award and was adapted for a film in 2015; b. 1956
Margin debt at record high
Don’t you just love the volatility. The stock market goes straight up. Oil prices are battered about on the whims of the president. Gold zooms up and then zooms down. Traders are blindsided with violent reversals, geopolitical shocks, and mini panics. There appears to be no rhyme nor reason to these moves, even as a common element is President Trump and his penchant for saying “peace is at hand” one minute, only to be followed by, “We’ll obliterate them if Iran doesn’t sign a deal” in the next minute. Iran usually is silent. Now they are back to bombing each other and any prospect of a peace deal seems more remote than ever. However, then they announce that there might be an extension to the ceasefire.
How do you trade in a market like that? It is actually easier to invest as one maintains a longer-term outlook and needs to see past the noise. Markets going straight up with a barely a pause? As we have previously noted, we’ve seen this picture before: in 1929 during the late stages of the Roaring Twenties bubble, in 1972–1973 with the Nifty Fifty bubble, in 1998–2000 with the dot.com bubble, and in 2007 with the housing market bubble. It’s no surprise that the most dramatic one was in 1929 where a 30% gain was followed by a 48% crash. What goes up fast can come down even faster.
We can’t say when this one will end and at what level. What we do know is that these types of moves are followed by an equal and opposite reaction. Be prepared.
One thing that has caught our attention is the record margin debt outstanding. Margin debt is when an investor borrows from a broker in order to purchase stock, looking to leverage their way to higher prices.
Margin can amplify gains, but if the market turns against you, it can magnify losses and result in margin calls. A rise in the use of margin is usually seen as a measure of investor confidence and risk appetite.
According to FINRA (the Financial Industry Regulatory Authority), margin debt leaped 6.8% in April 2026 to record highs (www.advisorperspectives.com/dshort/updates/2026/05/20/margin-debt-up-6-8-in-april-to-a-record-high). That rise was 53% higher than the previous year, reaching a record $1.3 trillion. Put this in perspective with consumer sentiment, which hit a record low – more evidence of the K economy. But, as we remind ourselves, the stock market is not the economy.

Source: www.advisorperspectives.com
The chart goes back to 1997. Note the peak before the end of the dot.com bubble in late 1999 and early 2000 and the peak in July 2007, which turned out to be three months from the stock market peak in October 2007. The subsequent low after the financial crisis of 2008 didn’t come until February 2009. It appears to have avoided any major peak before the 2020 pandemic. However, subsequently, margin debt soared to a peak in October 2021 before the sharp correction and bear market of 2022. This is just the latest iteration of soaring margin debt. Now here we are today with record margin debt. How will it end? Not well, we suspect.
Inflation Again
US PCE Inflation, CPI Inflation, Fed Rate 2016–2026
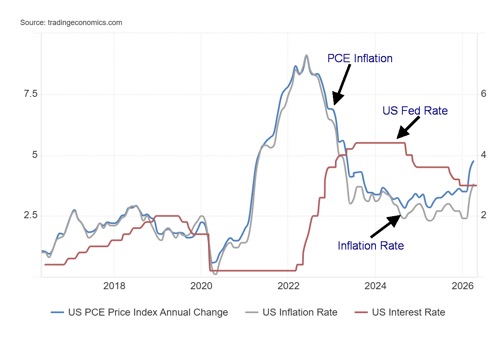
Source: www.tradingeconomics.com, www.bea.gov, www.bls.gov, www.federalreserve.gov
Inflation is rearing its head again, which could prove problematic for incoming Fed Chair, Kevin Warsh. The latest PCE (Personal Consumption Expenditure) prices showed a gain of 0.4% for the month of April. The March PCE was +0.7% while the expectation was for a gain of 0.5%. Is that good news? Yes, but the year-over-year PCE gain was 3.8% above March’s 3.5% gain, although on forecast. That’s well above the Fed’s 2% target. It’s also the highest since May 2023. Rather than falling as many would want, inflation is rising again. What does the Fed do? Trump wants lower interest rates. Warsh was appointed by Trump as he was expected to be dovish on rates.
Instead, rising inflation suggests that they might have to hike rates. It’s widely expected that the Fed will leave rates unchanged at the FOMC meeting on June 16–17. It will be Warsh’s first FOMC meeting. The other fear is that we are entering a period of stagflation, meaning sticky and rising inflation against a weakening economy.
All this points to why Trump is desperate to resolve the conflict with Iran, get the Strait of Hormuz open again, and allow oil prices to fall. As we and others have noted, even if the strait opens tomorrow, it is unclear how many ships would actually go through. Insurance costs have soared. The danger remains with any shaky truce. It will take months to clean up the mess of battered facilities, clear mines from the strait, and allow things to return to where they were before this war broke out on February 28.
Falling Savings Rate
U.S. Personal Savings Rate, GDP Growth 2016–2026
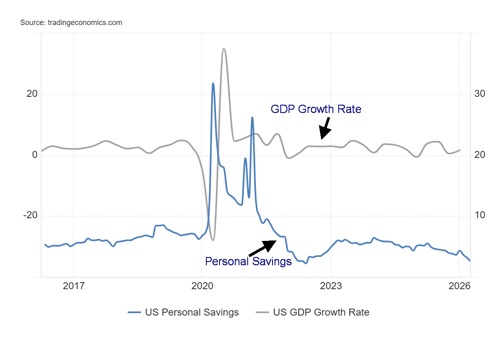
Source: www.tradingeconomics.com, www.bea.gov,
On the surface, the recent Q1 GDP growth of 1.6% doesn’t appear that bad. Except they expected 2.0%. For 2026, the expectation is still 2.2%. Sounds good. The U.S. GDP growth is the highest in the G7. But then, as a
reminder, the U.S. budget deficit is expected to be at least $1.8 trillion in 2026, adding to the already huge
debt approaching $40 trillion. That budget deficit is 6.6% of GDP, the highest in the G7. The closest to that are France at 5.3% and the U.K. at 5.1%. Both are considered to be financially vulnerable. Canada is at 2.2%, less than both Germany and Italy and the second lowest in the G7. Japan is at 1.8%. High deficits can have a positive effect on the GDP, but it’s fool’s gold as one can’t borrow and spend one’s way to prosperity.
We couldn’t help noticing that personal savings are the lowest since 2022 at 2.6%. That’s also nearly as low as they have ever been. Personal spending rose 0.5% in April vs. no gain 0% in personal income. Household debt is climbing. Personal disposable income is falling, thanks to low real salaries and rising inflation. Rising spending, rising debt vs. falling income, and personal disposable income vs. rising inflation don’t exactly sound like a growth picture.
Canada Personal Savings Rate, GDP Growth 2016–2026
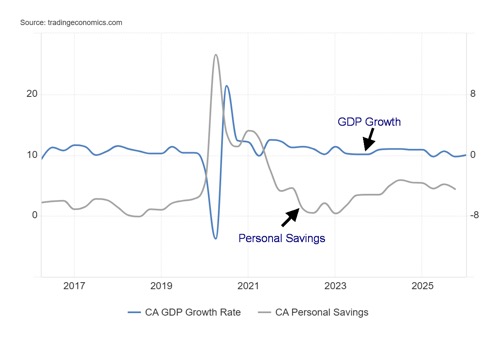
Source: www.tradingeconomics.com, www.statcan.gc.ca
For Canada, it’s good news and bad news. Canada’s economy is reported as being flat in Q1, after negative growth of 0.2% in Q4. The market had expected a gain of 0.3%. Therefore, technically, Canada is in a recession.
Besides being battered by inflation due to rising oil and food prices, Canada is also suffering under U.S. tariffs and uncertainty surrounding separatist questions in both Alberta and Quebec. While personal consumption rose, it was offset by a fall in government consumption. Rising imports and falling exports didn’t help.
Canada’s growth as measured against the other G7 countries is the second lowest for Q1. France recorded negative 0.1% growth while all the others reported slow growth under 1.0%. The good news is that Canada’s savings rate remains positive at 4.4%. Consumer spending is rising as is personal disposable income. Canada, however, does have the third highest household debt to GDP in the world behind Switzerland and Australia. Consumer confidence is waning but is well above its all-time lows seen during the pandemic. Bankruptcies and delinquencies are showing a notable rise because of falling house prices.
Another K Economy Divergence
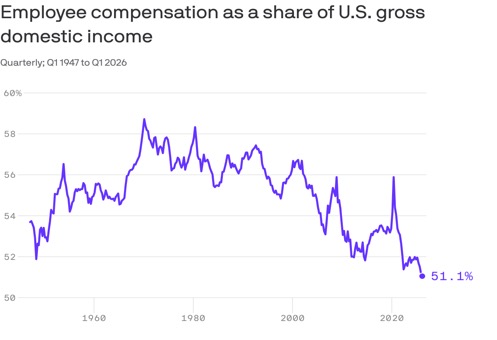
Source: www.axios.com, www.bea.gov

Source: www.axios.com, www.bea.gov
We saw this in the May 30, 2026, note from Axios and thought it interesting enough to note. Another sign of the K economy with workers compensation as a share of U.S. gross domestic income falling to record lows while corporate profits are going the opposite way to record highs. It fits well with the stock market at record highs while consumer sentiment hits record lows. Add in the widening wealth inequality gap. None of it is sustainable.
Chart of the week
Source: www.stockcharts.com
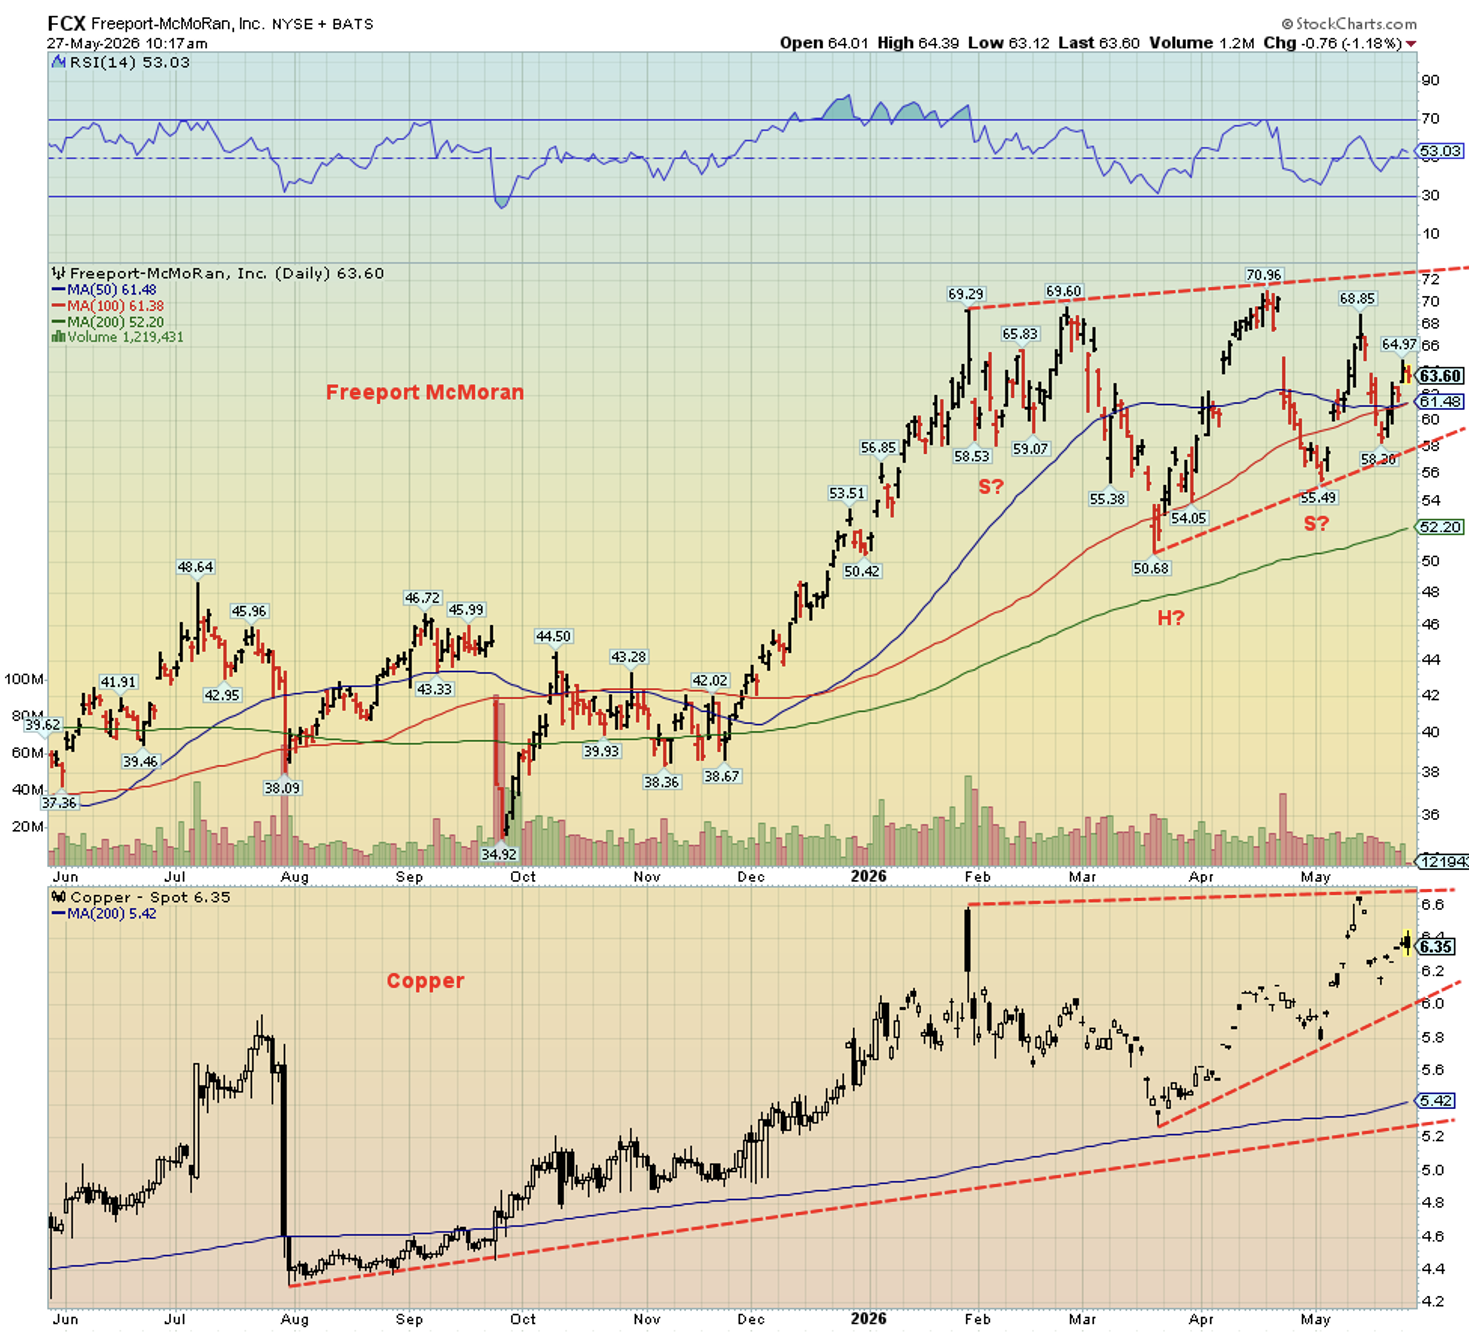
The demand for copper is rising faster than the industry can bring on new sources. So, it is no surprise to see that companies like Freeport McMoran (FCX/NYSE), the world’s largest copper company, have been doing well. From a low in September 2025, FCX almost doubled into February 2026. Since then, FCX has been in a corrective mode that may soon be coming to an end.
FCX’s flagship mine is in Indonesia, but they also have mines in both North and South America. So, what is all the fuss about copper? Copper isn’t even the most used industrial metal, being surpassed by iron and aluminum. But copper’s usage is wide: EV vehicles, power grids, renewables, batteries, AI data centers, and more. Copper’s use is so prevalent they call it Dr. Copper. But its ability to bring on new supply is constrained after years of underinvestment, a fall in ore grades, and the fact that it takes 10–20 years to build a mine from time of discovery. The International Energy Agency (IEA) estimates that copper could be in a 30% supply deficit by 2035.
The largest copper producer is Chile, followed by Peru, the Democratic Republic of Congo, China, and Russia. However, all are facing challenges from declining grades, shortages of water, labour issues, flooding of mines, political instability, and export restrictions. There is also the question of smelter operations, especially in China. All this helps explain why copper prices have soared to all-time highs and companies like Freeport McMoran have done well. Where is the demand? The world’s largest consumer of copper is China, which gobbles up almost 58% of refined consumption. The U.S. is a distant second. Other heavy users include Japan, Germany, South Korea, and India.
The copper chart appears to be a rising triangle, which suggests to us that we should break out further to the upside. A move over $6.65/$6.70 could project as high as $8. Copper starts to break down under $5.80. Is FCX forming a head-and-shoulders bottom pattern? It’s hard to say as the pattern is not one we would call the pure definition of a head-and-shoulders bottom. It has an upward sloping, albeit small, neckline, with the right shoulder exceeding the left shoulder to the downside when it is normally the other way around. We don’t break out until we are over $72, but then we could project up to over $90. Major support is seen at $58 and under $55 the H&S pattern is busted.
Shortages and high demand all suggest that copper is not only a key ingredient but companies like Freeport McMoran should benefit substantially. What investors need to be wary of is overenthusiasm for the sector, resulting in a sharp correction.
Stocks
Source: www.stockcharts.com
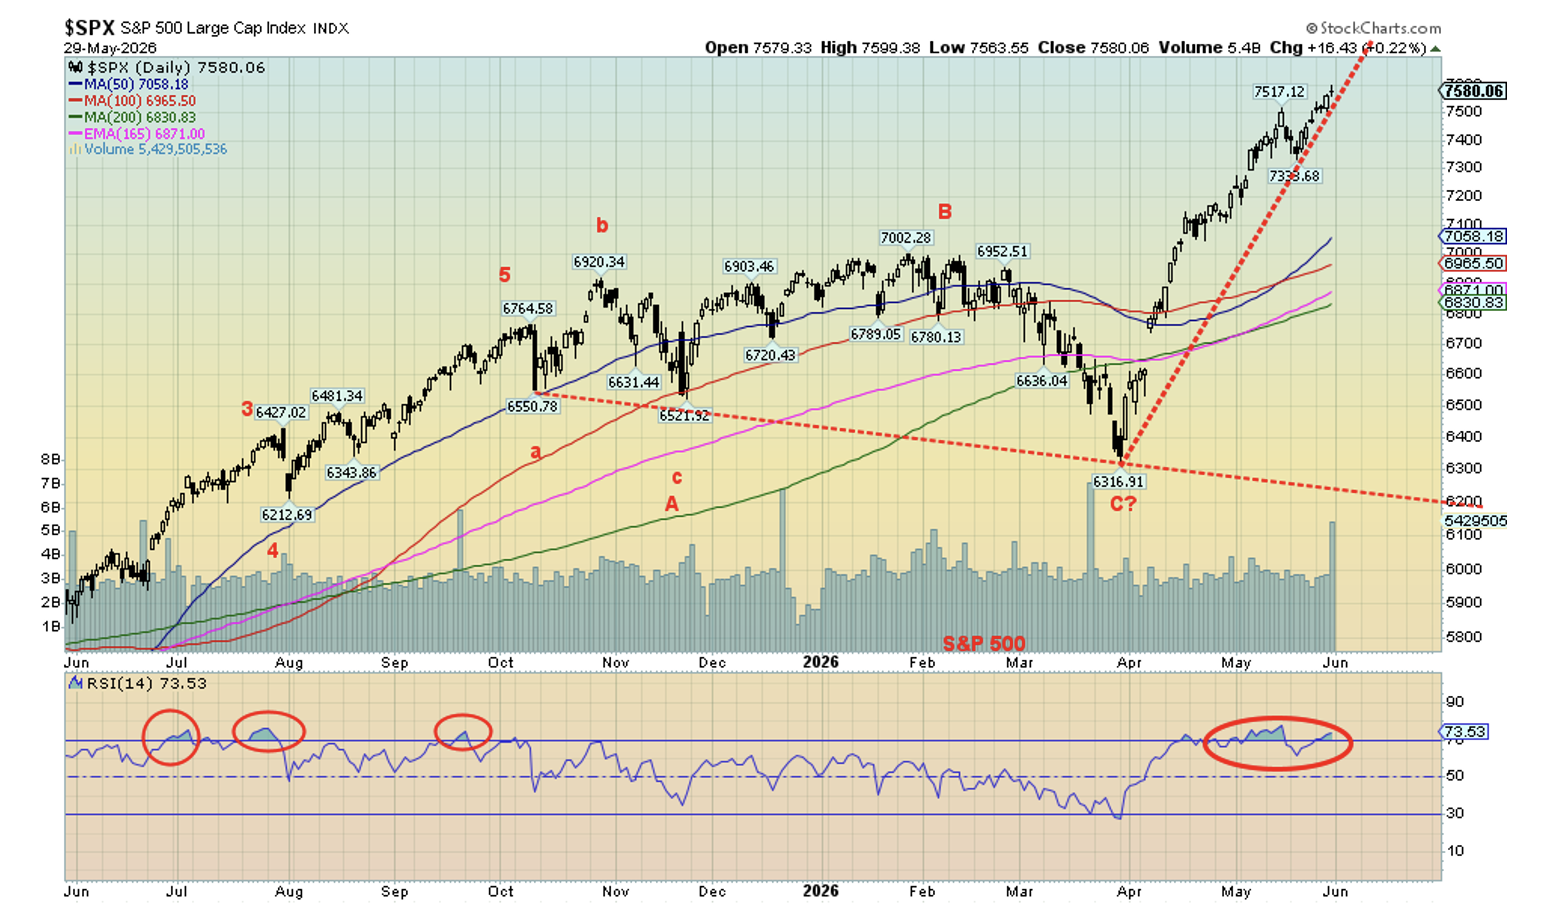
Is there anything that stops this market? It seems not as, once again, we soared to new all-time highs with the MAG7 leading the way. We don’t know what to say, except history suggests that this will end badly. What goes up fast comes down even faster. Yes, the market loves thoughts of a ceasefire between the U.S. and Iran. Yes, it loves the ongoing profits being pumped out by companies, some of whom even beat expectations. The market appears to ignore rising inflation, that the U.S. Iran ceasefire could fall apart at any moment, and the ongoing deep political polarization in the U.S. The K economy: record high stock prices and record low consumer sentiment. One of them is wrong.
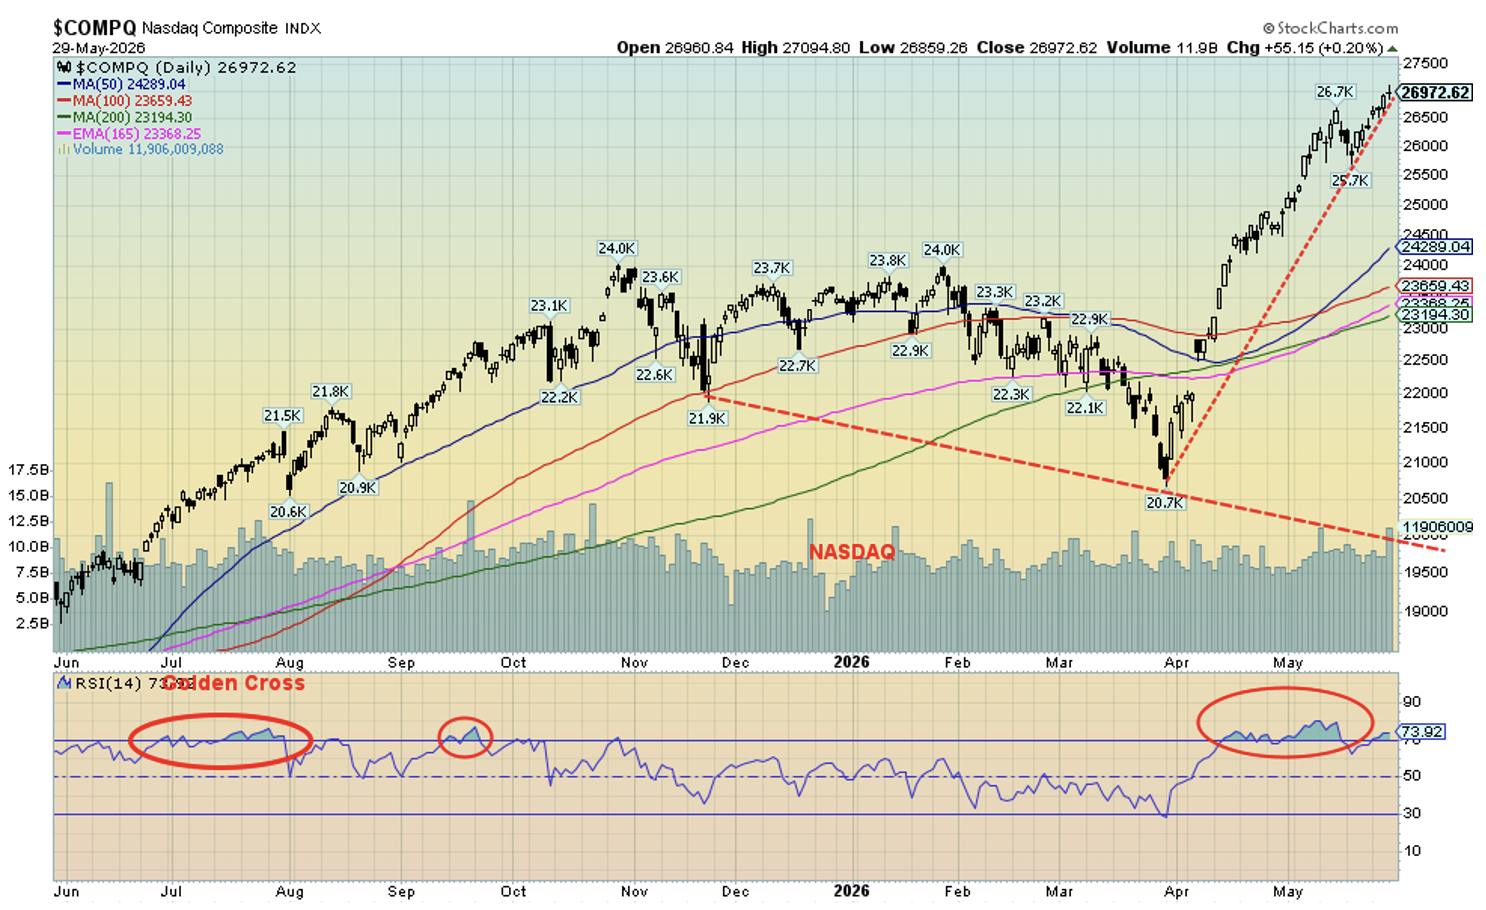
This past week, the S&P 500 rose 1.4%, the Dow Jones Industrials (DJI) was up 0.9%, while the NASDAQ leaped 2.4%. All three made new all-time highs. The Dow Jones Transportations (DJT) rose 3.1% but remains well below its all-time high, a divergence with the DJI. The S&P 600 (Small) made an all-time high, up 0.8%, but the S&P 400 (Mid) did not, even though it was up 1.4%. Others making all-time highs included the Russell 1000, 2000 and 3000, the NASDAQ 100, and the S&P 100 (OEX). The S&P Equal Weight Index and the NY FANG Index made all-time highs, up 1.0% and 6.8% respectively. Celebrations all around.
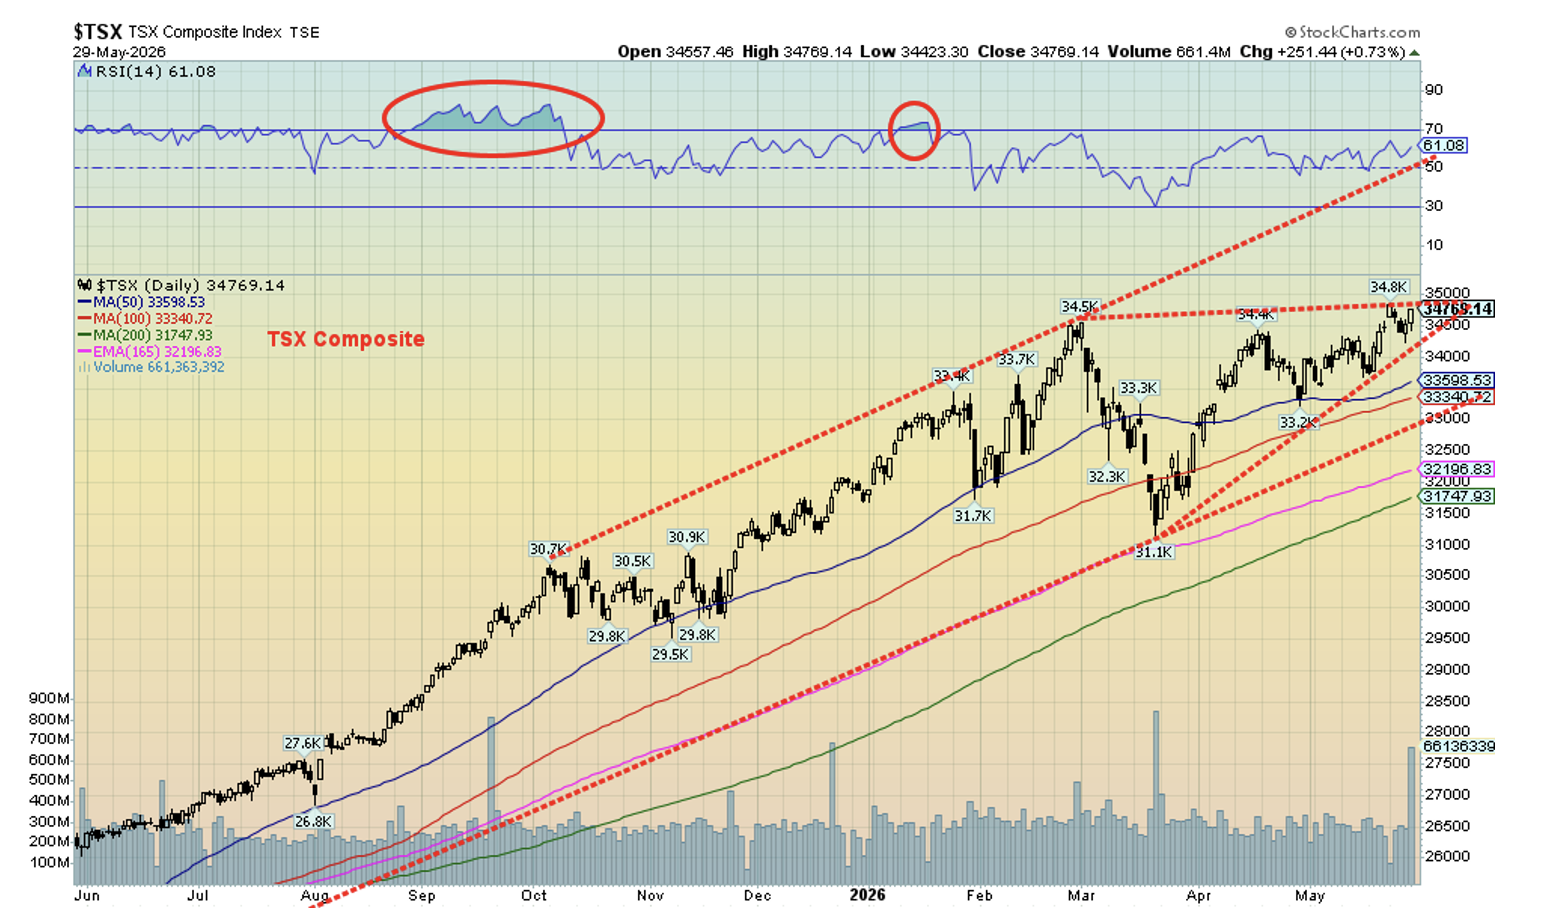
Elsewhere in Canada, the TSX Composite made an all-time high, up 0.9%, while the TSX Venture Exchange (CDNX) gained 3.9%. In the EU, the London FTSE lost 0.5%, the EuroNext made an all-time high but fell about 0.2%, the Paris CAC 40 was up 0.8%, and the German DAX gained 2.0%. In Asia, China’s Shanghai Index (SSEC) lost 1.1% but the Tokyo Nikkei Dow (TKN) made another all-time high, up 4.7%. Hong Kong’s Hang Seng (HSI) fell 1.7% while India’s Nifty Fifty lost 0.7%. The MSCI World Index (ex U.S.) made an all-time high, up 1.8%. Bitcoin lost about 3.0%.
Source: www.stockcharts.com
So, all-time highs in the U.S. but mixed elsewhere. The bubble conditions seen in the U.S. are not visible elsewhere. Five of the MAG7 made gains on the week. Significantly, Nvidia was down 1.9% on the week. The big star for the week was Snowflake (SNOW), up a remarkable 48%, egged on by its positive pronouncements on AI. FAANG stocks making all-time highs this past week included Apple, Advanced Micro (AMD), Broadcom, and CrowdStrike. Despite the big gain, SNOW remains well shy of an all-time high.
In Canada, eight of the 14 sub-indices were up on the week, led by Information Technology (TTK), up 6.9%. Golds (TGD) +4.8%, Metals (TGM) +5.3%, and Materials (TMT) +5.8% were other solid gainers. As to the losers, Energy (TEN) fell 6.9%, leading the way. Significantly, Financials (TFS) made an all-time high and lost 0.3%, as did Utilities (TUT) with a new high and down 0.8%. Joining the crowd was Income Trusts (TCM), down 0.1% after an all-time high.
Source: www.stockcharts.com
The rise has been incredibly steep. The S&P 500 is up 20% from that March low while the NASDAQ has gained 30%. The DJI has jumped a more modest 13%. We can’t even begin to consider that a top is in until we break back under 7,330 at least and preferably under 7,300. The NASDAQ must get back to under 25,700, preferably under 25,000. The TSX could be forming a rising triangle, which is bullish. If that’s correct, then it will be necessary for the commodity sectors (Golds, Metals, Materials, and Energy) to perform well.
We don’t want to predict at what level this will end, except that it will end and it won’t be pretty. It has been rare to see sharp moves like this. As we have noted, the biggest ones we’ve seen were in 1929, 1972–1973, 1999–2000, and 2007. All of them ended up in tears.
Fear and Greed
Source: www.stockcharts.com
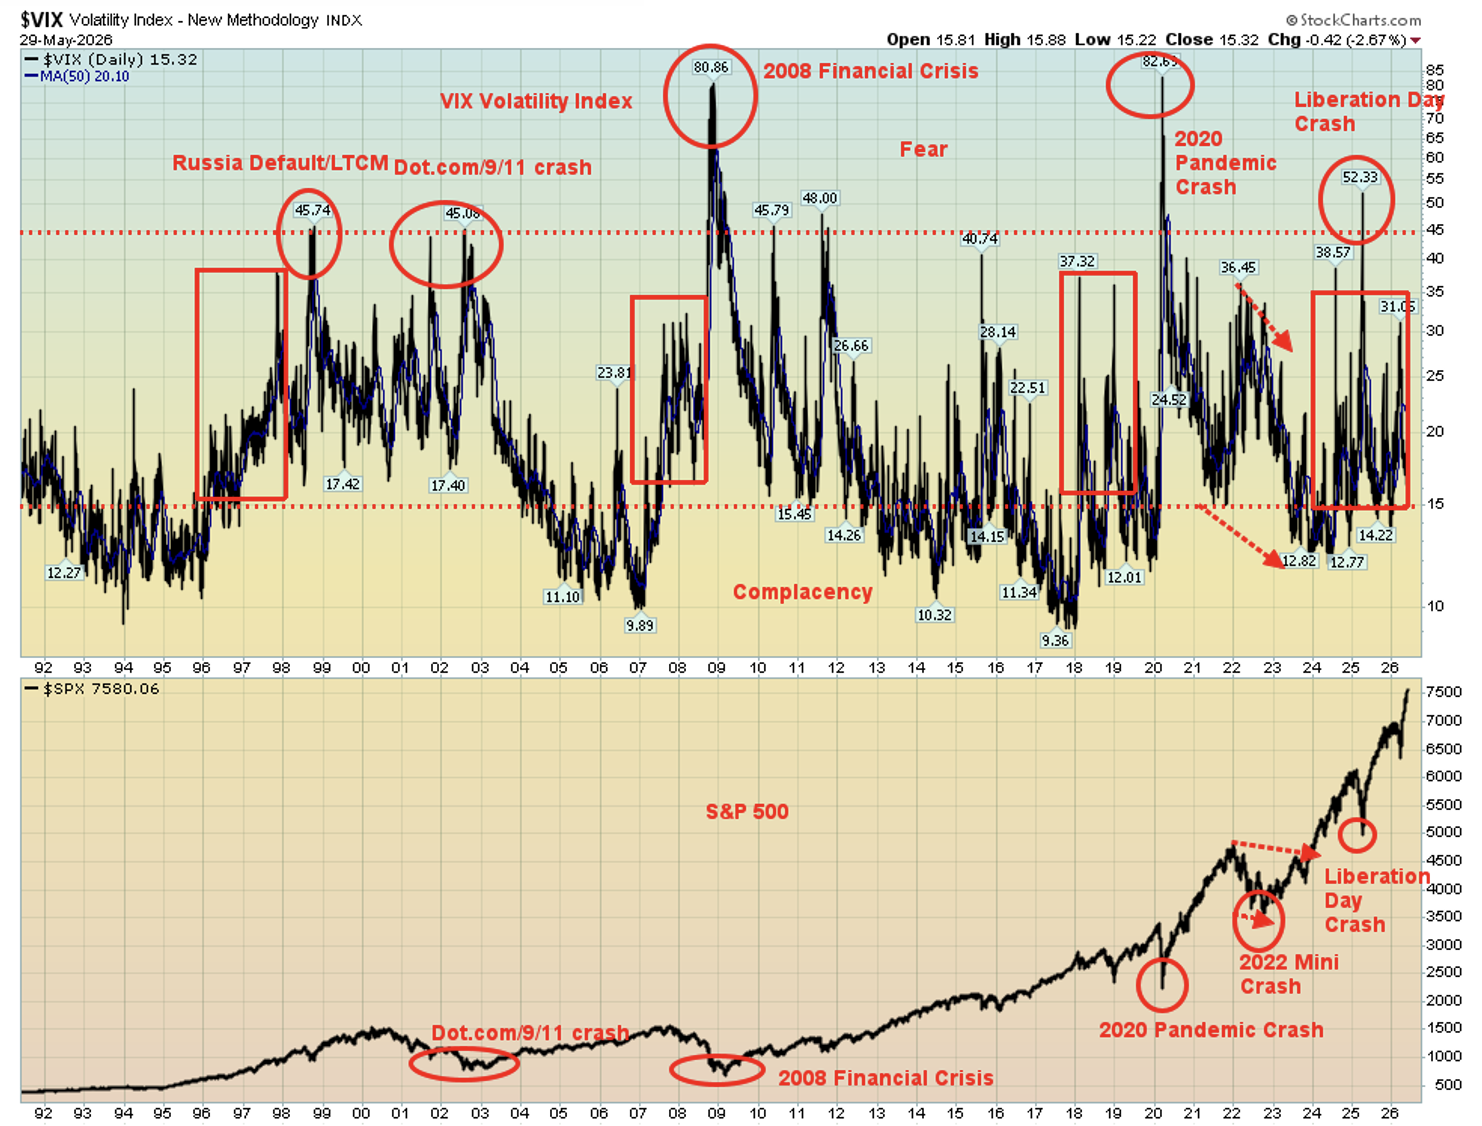
Maybe it should come as no surprise that with the stock market at record heights that the VIX Volatility Index, a measurement of fear and greed sits at 15.32. That just hangs above the complacency level. The low was seen back at 2017 at 9.36. It’s a warning nothing more.
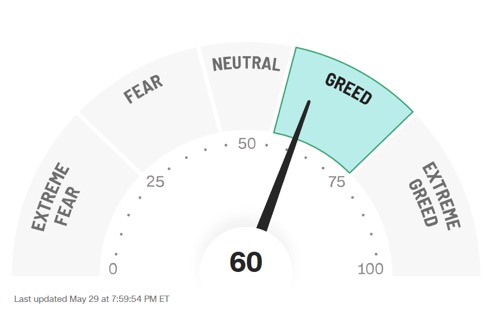
The CNN Fear and Greed Index is registering greed. That’s still better than extreme greed but still another warning sign. Of the seven components one registers neutral – stock market volatility. That seems to sit well with the VIX Index. Registering extreme greed are market momentum, put and call options and safe haven demand. At the other end stock price strength and stock price breadth are both registering fear while junk bond demand is registering extreme fear. More to keep in mind.
Source: www.cnn.com
Bonds
Source: www.tradingeconomics.com, www.home.treasury.gov, www.bankofcanada.ca
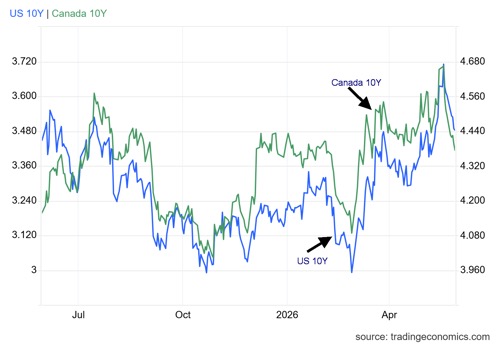
The bond market likes the thought of a U.S./Iran ceasefire agreement. Bond yields fell this past week with the U.S. 10-year Treasury note down 2.6% to 4.44% while the 10-year Government of Canada bond (CGB) fell 3.7% to 3.40%. However, they remain well up from the lows seen just before the onset of this war. Back then the U.S. 10-year was at 3.95%. The 30-year U.S. Treasury bond has fallen to 4.97%, down from a high of 5.18% but well up from the February low of 4.62%.
What’s key is whether the U.S. and Iran will actually agree to a ceasefire. Recent action suggests not as both sides have lobbed missiles at each other again. Coming up in June is the FOMC meeting on June 16–17. Wide expectation remains that they will leave rates unchanged at 3.75%. Despite a muted reaction, the recent PCE inflation numbers were not friendly to a rate cut.
With the fall this past week, we look for support areas. For the U.S., it is here at 4.44% and down to 4.35%. In Canada, support can be seen at 3.35%. Canada 10-year is roughly 100 basis points lower than in the U.S., reflecting a somewhat weaker economy, lower budget deficit, and lower inflation.
Gold and silver
Source: www.stockcharts.com
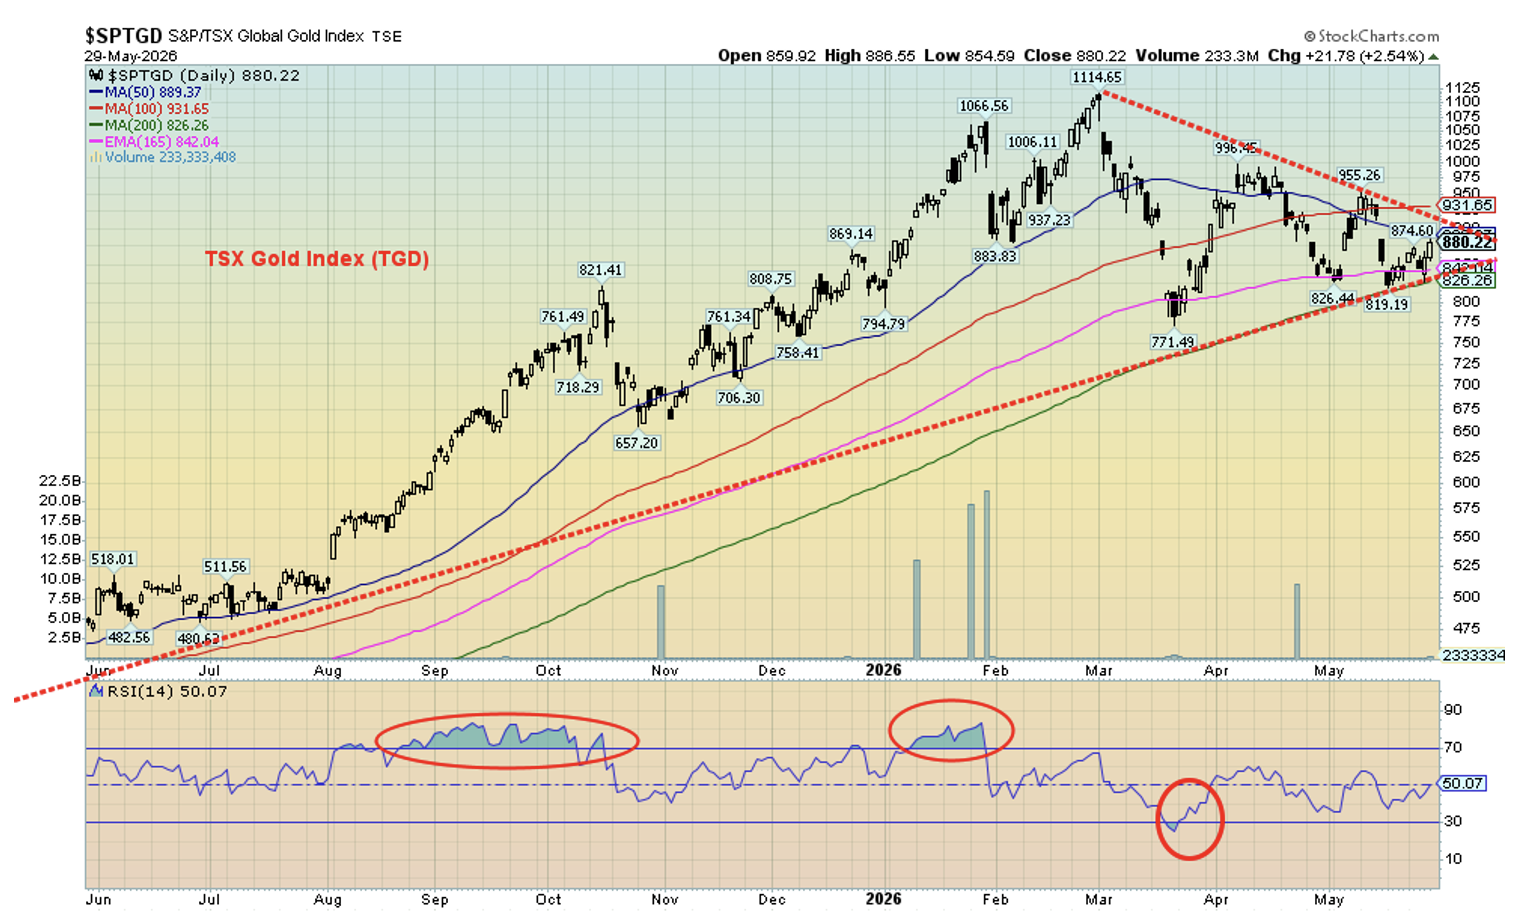
Lower oil prices, which in turn sparks lower bond yields, are music to gold’s ears. With oil plunging this past week, gold rose, continuing its ongoing whipsaws of the past few months. Yes, the war against Iran will be entering its fourth month this week. As a result, gold rose this past week, offsetting the previous week’s loss by gaining 0.8%. The lower US$ Index didn’t hurt. Silver was up only 0.1%, but the gold stocks responded positively as the Gold Bugs Index (HUI) rose 5.0% while the TSX Gold Index (TGD) jumped 4.8%. There was even positive movement in the junior gold market this past week, helping the TSX Venture Exchange (CDNX) to a gain of 3.9%. Platinum didn’t fare as well, falling 0.3%, while the near precious metals rose with palladium up 1.1% and copper gaining 0.2%. Small but significant gains.
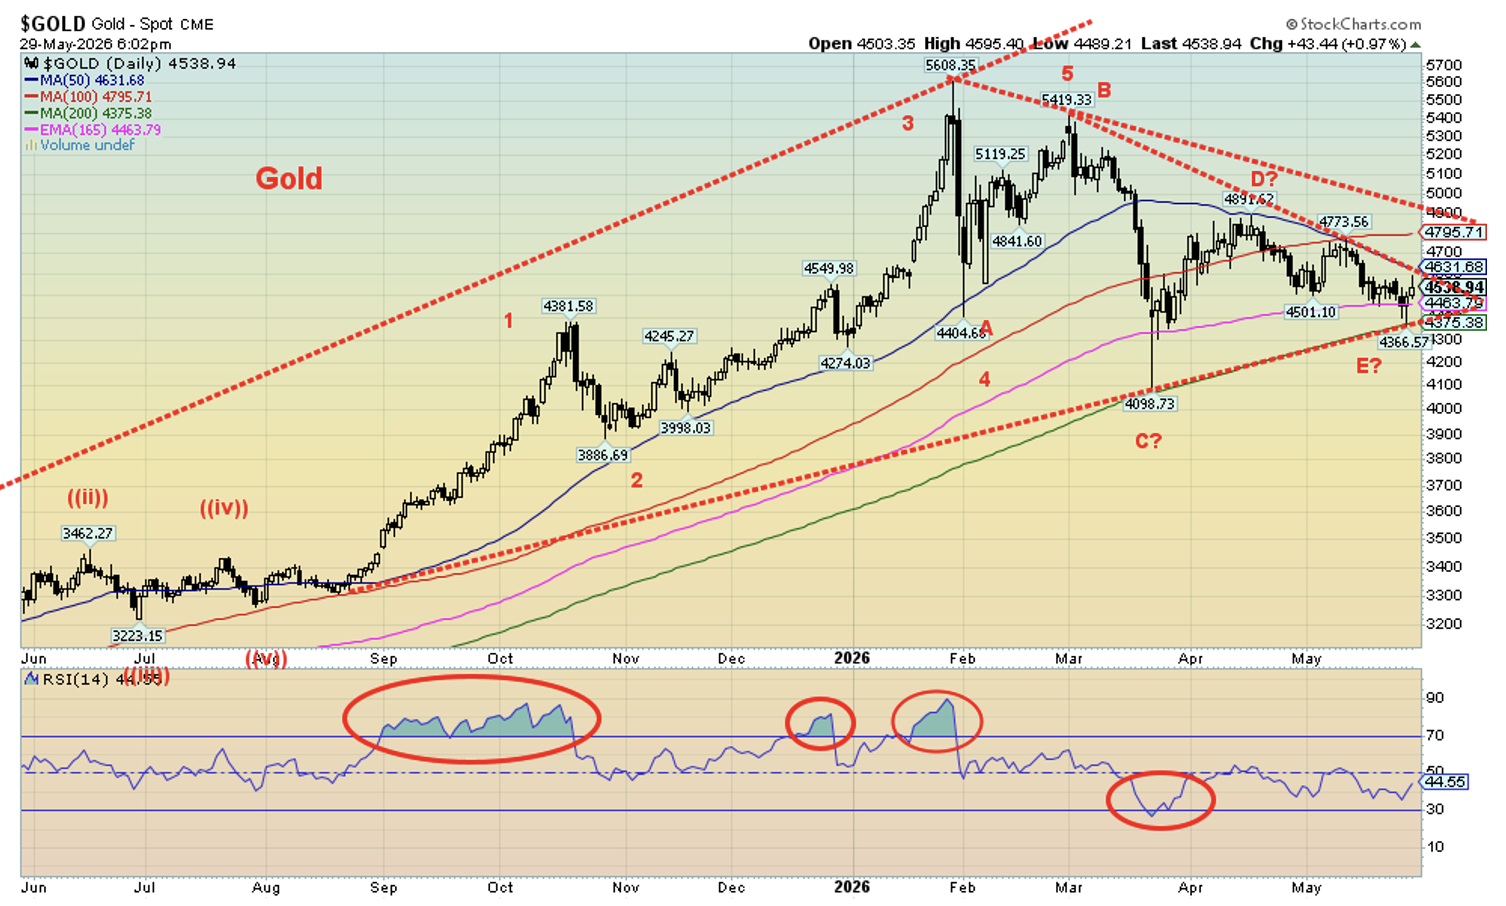
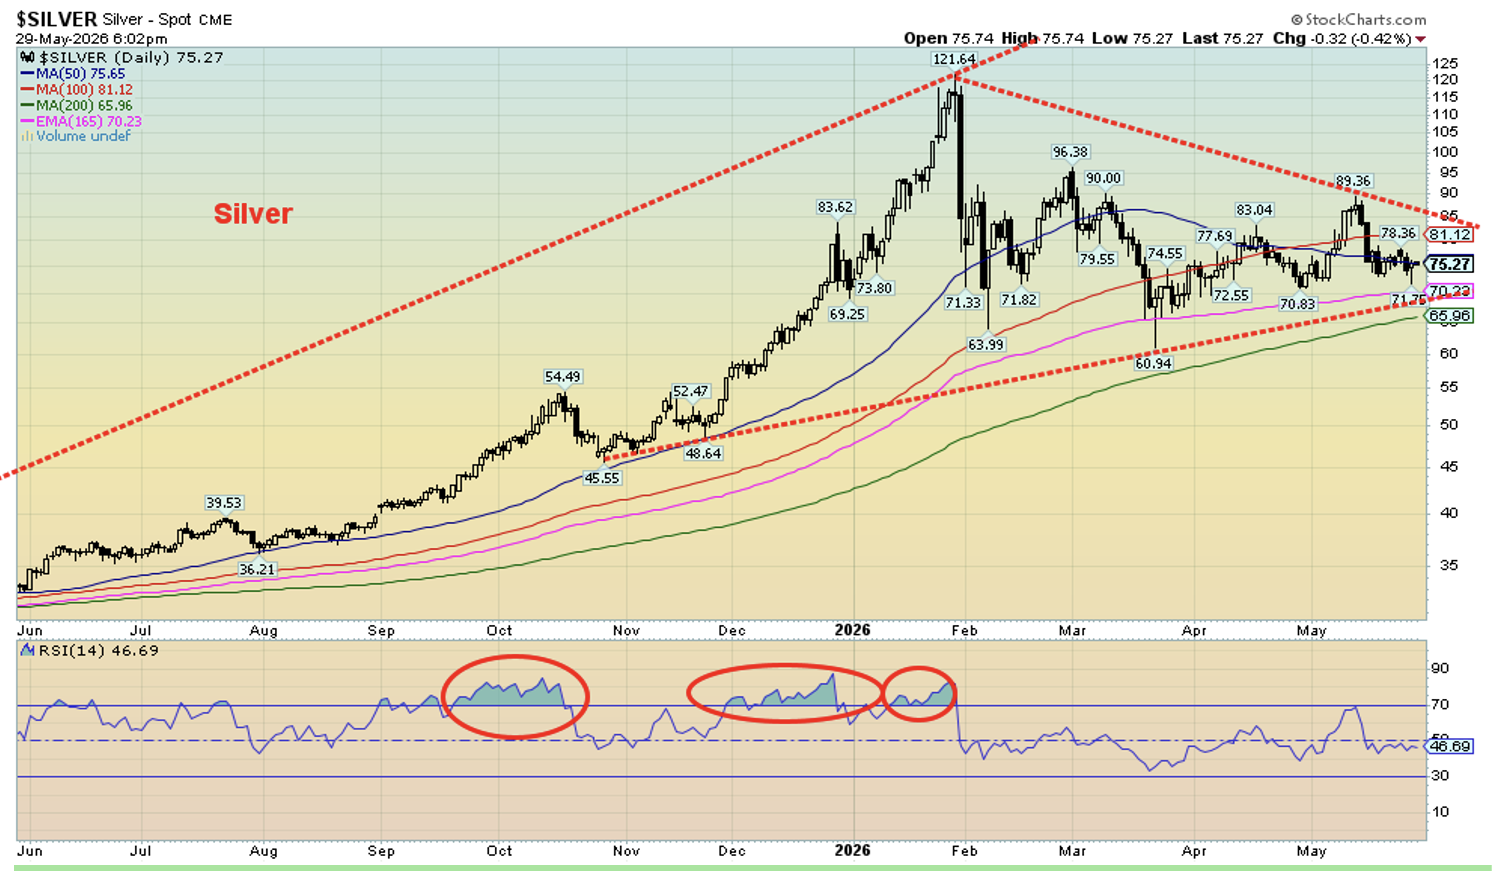
Despite the gains this past week, gold lost 1.8% in May while silver gained 2.1%. The HUI was up 1.8% and the TGD was up 3.4%. We’ll just call it a holding pattern. That’s what the chart indicates to us as gold, we believe, continues to form what appears to be a large symmetrical triangle. The trouble is now we are near the end of the apex, which usually translates into just wiggling through rather than a breakout in either direction. In other words, our near-term expectations are more of the same while the triangle pattern takes on new formations. Ultimately, however, the pattern remains bullish, and the break should be to the upside. Risk remains for a further decline towards $4,000 which would in effect suggest a downside break, initially, at least. The good news is that we are moving into a more friendly seasonal period for gold and silver. However, what we can’t tell is whether the low will be in June or July.
Right now, for an upside breakout we’d like to regain over $4,800. Silver needs to break over $86 and hold on in further pullback to $65. Nonetheless, the five-point pattern that has formed should be ultimately bullish.
Source: www.stockcharts.com
Silver has fared better overall. The gold/silver ratio has fallen from 107 in April to near 60 today. That’s a considerable gain for silver vis-à-vis gold, which is why we touted silver as the place to be. And the gold stocks too. The TGD is down 21% from its all-time high but up 268% since a low seen in February 2026. That’s significant. Even with these sharp gains there has been little sense that gold stocks have been in a bubble. They remain undervalued. Even the CDNX has doubled since late 2023, taking numerous junior gold miners to new heights as well. But even here we sense no bubble conditions, yet. The CDNX could double again from here. The CDNX remains down 70% from its all-time high recorded in 2008.
Gold is buoyed by the thoughts of the ceasefire along with lower bond yields. But will it hold? No ceasefire is in place, and a deal could fall apart any time. In theory, the two sides remain far apart. None of this precludes owning some gold exposure of at least 10%. For safety, hold gold bullion; for speculation, junior mining development stocks.
Source: www.stockcharts.com
Oil and gas

Source: www.stockcharts.com
The markets love it but the U.S.’s gambit for an extended 60-day ceasefire with Iran is still not in place. Trump has still not said whether he’ll sign it, and Iran has been mostly quiet on any deal. Trump wants a deal because the war has caused economic disruption with rising oil prices and shipping disruption, at a cost estimated at $60 billion so far. Iran wants a deal for sanctions relief plus ongoing confirmation that Iran controls the Strait of Hormuz. However, they don’t want to appear that they are surrendering, either.
Nonetheless, markets don’t seem to care, and oil suffered its biggest collapse in two months. This past week, WTI oil fell 8.8% while Brent crude was hit harder, down 11.4%. No worries as WTI is still up about 53% in 2026 while Brent is up just under 51%. Relief? What relief?
The fall this past week seemed to send WTI through its uptrend line. However, by the week’s end it bounced back, leaving what appears to us as a hammer, a Japanese candlestick pattern that suggests a low could be hand. That wouldn’t be a surprise, given the uncertainty as to whether a ceasefire will happen or not and the ongoing whipsaws of this market. Both sides recently appeared to be abandoning the idea of a ceasefire as the U.S. bombed Iran again and in retaliation Iran bombed U.S. military facilities. So, is the ceasefire in doubt even before it begins? Time will tell. Nonetheless, the market wants to believe a ceasefire will happen.
Natural gas (NG) was mixed as NG at the Henry Hub rose 12.7%, due to rising concerns about the storage build. It was the opposite in the EU as it responded more to the thoughts of a ceasefire and NG at the EU Dutch Hub fell 5.7%. As no surprise, the energy stocks fell with the ARCA Oil & Gas Index (XOI) down 4.1% and the TSX Energy Index (TEN) down 6.9%.
Notably, the U.S. strategic oil reserves remain moribund, trending at 5-year lows. Gasoline stocks have bounced back but not oil stocks.
If you are an oil and gas bull, the past week was not comfortable. However, as we’ve seen time and time again over the past few months, plunges are often followed by big up days. In other words, whipsaw. WTI oil continues to build what appears to us as a large symmetrical triangle. Resistance is up to $100/$102 and support is at this week’s lows near $87. The market has been whipsawed before, and it could happen again as they await the decision of the president while Iran sits mostly quiet.
Markets and trends follow
Markets and Trends
|
|
|
|
% Gains (Losses) Trends |
|
||||
|
|
Close Dec 31/25 |
Close May 29/26 |
Week |
YTD |
Daily (Short Term) |
Weekly (Intermediate) |
Monthly (Long Term) |
|
|
|
|
|
|
|
|
|
||
|
S&P 500 |
6,845.50 |
7,580.06 (new highs) * |
1.4% |
10.7% |
up |
Up |
up |
|
|
Dow Jones Industrials |
48,063.29 |
51,032.56 (new highs) * |
0.9% |
6.2% |
up |
up |
up |
|
|
Dow Jones Transport |
17,357.19 |
21,410.31 |
3.2% |
19.7% |
up |
up |
up |
|
|
NASDAQ |
23,241.99 |
26,972.62 (new highs) * |
2.4% |
16.1% |
up |
up |
up |
|
|
S&P/TSX Composite |
31,712.76 |
34,769.14 (new highs) * |
0.9% |
9.6% |
up |
up |
up |
|
|
S&P/TSX Venture (CDNX) |
987.74 |
1,011.51 |
2.4% |
3.9% |
up (weak) |
up |
up |
|
|
S&P 600 (small) |
1,467.76 |
1,684.49 (new highs) * |
0.8% |
14.8% |
up |
up |
up |
|
|
ACWX MSCI World x US |
67.18 |
76.50 (new highs) * |
1.8% |
13.9% |
up |
up |
up |
|
|
Bitcoin |
87,576.98 |
73,606.69 |
(3.0)% |
(16.0)% |
up |
down |
neutral |
|
|
|
|
|
|
|
|
|
|
|
|
Gold Mining Stock Indices |
|
|
|
|
|
|
|
|
|
Gold Bugs Index (HUI) |
701.49 |
763.82 |
5.0% |
8.9% |
down (weak) |
neutral |
up |
|
|
TSX Gold Index (TGD) |
817.76 |
880.63 |
4.8% |
7.7% |
down (weak) |
neutral |
up |
|
|
|
|
|
|
|
|
|
|
|
|
Bonds% |
|
|
|
|
|
|
|
|
|
U.S. 10-Year Treasury Bond yield |
4.17% |
4.44% |
(2.6)% |
6.5% |
|
|
|
|
|
3.3Cdn. 10-Year Bond CGB yield |
3.44% |
3.40% |
(3.7)% |
(1.2)% |
|
|
|
|
|
Recession Watch Spreads |
|
|
|
|
|
|
|
|
|
U.S. 2-year 10-year Treasury spread |
0.69% |
0.43% |
flat |
(37.7)% |
|
|
|
|
|
Cdn 2-year 10-year CGB spread |
0.85% |
0.60% |
(1.6)% |
(29.4)% |
|
|
|
|
|
|
|
|
|
|
|
|
|
|
|
Currencies |
|
|
|
|
|
|
|
|
|
US$ Index |
98.26 |
98.92 |
(0.4)% |
0.7% |
up (weak) |
down |
down |
|
|
Canadian $ |
72.87 |
72.51 |
0.2% |
(0.5)% |
down |
up |
neutral |
|
|
Euro |
117.48 |
116.62 |
0.5% |
(0.7)% |
down (weak) |
up |
up |
|
|
Swiss Franc |
126.21 |
128.03 |
0.5% |
1.5% |
up |
up |
up |
|
|
British Pound |
134.78 |
134.61 |
0.1% |
(0.1)% |
neutral |
up |
up |
|
|
Japanese Yen |
63.83 |
62.78 |
(0.1)% |
(1.6)% |
down (weak) |
down |
down |
|
|
|
|
|
|
|
|
|
|
|
|
Precious Metals |
|
|
|
|
|
|
|
|
|
Gold |
4,311.97 |
4,542.35 |
0.8% |
5.3% |
down |
neutral |
up |
|
|
Silver |
71.16 |
75.55 |
0.1% |
6.2% |
down (weak) |
up (weak) |
up |
|
|
Platinum |
124.81 |
1,925.30 |
(0.3)% |
(5.9)% |
down |
neutral |
up |
|
|
|
|
|
|
|
|
|
|
|
|
Base Metals |
|
|
|
|
|
|
|
|
|
Palladium |
1,619.50 |
1,374.00 |
1.1% |
(15.2)% |
down |
down |
up |
|
|
Copper |
5.64 |
6.36 |
0.2% |
12.8% |
up |
up |
up |
|
|
|
|
|
|
|
|
|
|
|
|
Energy |
|
|
|
|
|
|
|
|
|
WTI Oil |
57.44 |
87.85 |
(8.8)% |
52.9% |
down |
up |
up |
|
|
Nat Gas |
3.71 |
3.28 |
12.7% |
(11.6)% |
up |
neutral |
neutral |
|
Source: www.stockcharts.com
* New All-Time Highs
Note: For an explanation of the trends, see the glossary at the end of this article.
New highs/lows refer to new 52-week highs/lows and, in some cases, all-time highs.
Copyright David Chapman 2026
GLOSSARY
Trends
Daily – Short-term trend (For swing traders)
Weekly – Intermediate-term trend (For long-term trend followers)
Monthly – Long-term secular trend (For long-term trend followers)
Up – The trend is up.
Down – The trend is down
Neutral – Indicators are mostly neutral. A trend change might be in the offing.
Weak – The trend is still up or down but it is weakening. It is also a sign that the trend might change.
Topping – Indicators are suggesting that while the trend remains up there are considerable signs that suggest that the market is topping.
Bottoming – Indicators are suggesting that while the trend is down there are considerable signs that suggest that the market is bottoming.
Disclaimer
David Chapman is not a registered advisory service and is not an exempt market dealer (EMD) nor a licensed financial advisor. He does not and cannot give individualised market advice. David Chapman has worked in the financial industry for over 40 years including large financial corporations, banks, and investment dealers. The information in this newsletter is intended only for informational and educational purposes. It should not be construed as an offer, a solicitation of an offer or sale of any security. Every effort is made to provide accurate and complete information. However, we cannot guarantee that there will be no errors. We make no claims, promises or guarantees about the accuracy, completeness, or adequacy of the contents of this commentary and expressly disclaim liability for errors and omissions in the contents of this commentary. David Chapman will always use his best efforts to ensure the accuracy and timeliness of all information. The reader assumes all risk when trading in securities and David Chapman advises consulting a licensed professional financial advisor or portfolio manager such as Enriched Investing Incorporated before proceeding with any trade or idea presented in this newsletter. David Chapman may own shares in companies mentioned in this newsletter. Before making an investment, prospective investors should review each security’s offering documents which summarize the objectives, fees, expenses and associated risks. Although Artificial Intelligence (AI) may be deployed from time to time, AI output is monitored and adjusted, if necessary, for accuracy. David Chapman shares his ideas and opinions for informational and educational purposes only and expects the reader to perform due diligence before considering a position in any security. That includes consulting with your own licensed professional financial advisor such as Enriched Investing Incorporated. Performance is not guaranteed, values change frequently, and past performance may not be repeated.
About the author


Website: https://www.enrichedinvesting.com
Disclaimer: David Chapman is not a registered advisory service and is not an exempt market dealer (EMD) nor a licensed financial advisor. We do not and cannot give individualised market advice. David Chapman has worked in the financial industry for over 40 years including large financial corporations, banks, and investment dealers. The information in this newsletter is intended only for informational and educational purposes. It should not be considered a solicitation of an offer or sale of any security. The reader assumes all risk when trading in securities and David Chapman advises consulting a licensed professional financial advisor before proceeding with any trade or idea presented in this newsletter. David Chapman may own shares in companies mentioned in this newsletter. We share our ideas and opinions for informational and educational purposes only and expect the reader to perform due diligence before considering a position in any security. That includes consulting with your own licensed professional financial advisor.