
Is Japan where a sovereign debt crisis could start? Huge debt, rising inflation, and interest rates follow years of ultra-low interest rates and massive stimulus intended to revive the moribund Japanese economy. Japan is the largest foreign holder of U.S. Treasuries. Fear is they will have to sell to defend the sinking Japanese yen. BOJ intervention and from the U.S. Treasury as well, even though the U.S. sold euros instead of dollars. The ECB was surprised. It helped improve the yen, but is it only temporary? We show Japan in a series of eight (8) charts.
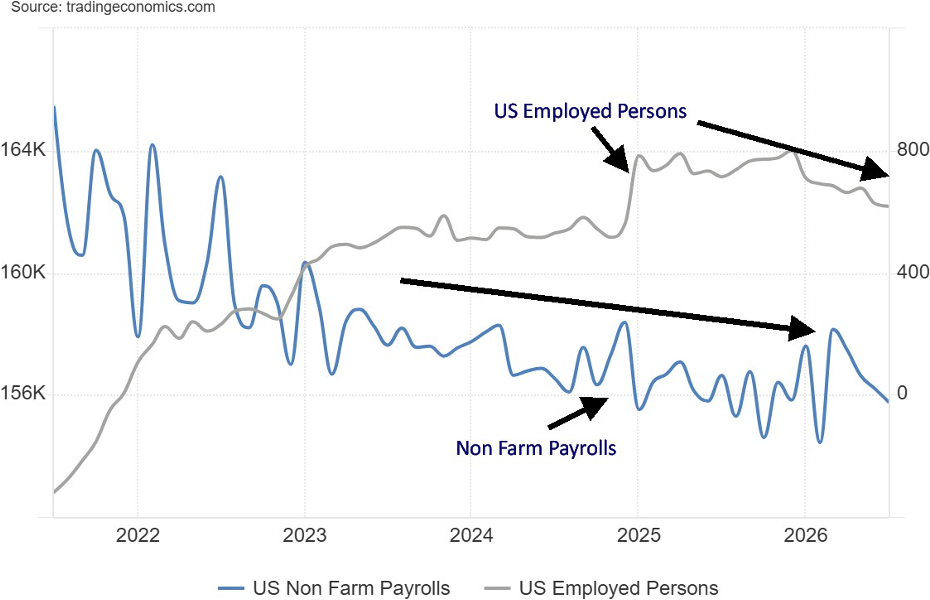
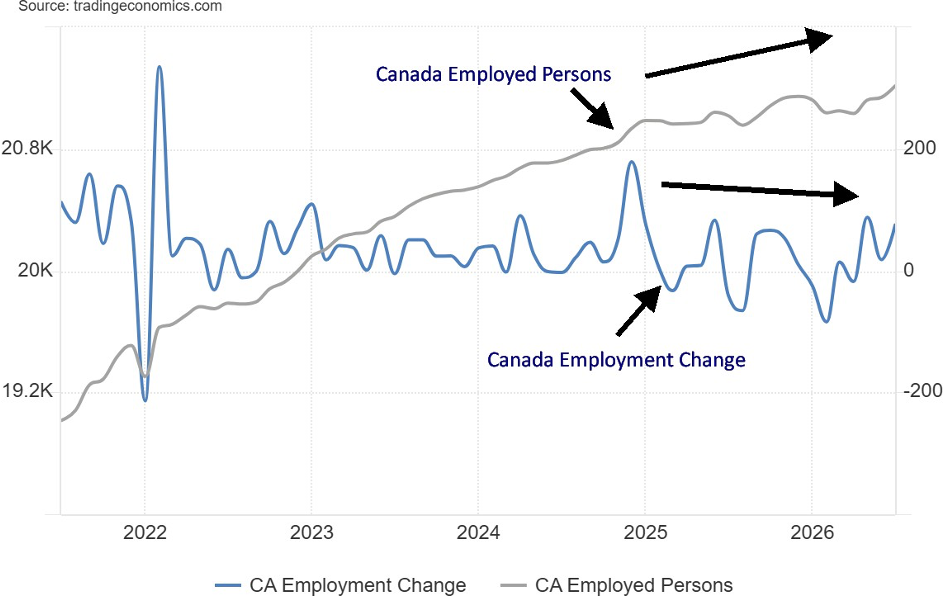
It was the week of the July job numbers. The U.S. surprised to the downside while Canada surprised to the upside. Both saw their unemployment rate fall. But for the U.S. it was primarily due to a big drop in their civilian labour force (deportations?) and fewer people working as a percentage of the population. The job numbers are the subject of our chart of the week.
With the weak job numbers, odds shifted to a Fed interest rate cut rather than a hike. That sparked another stock market rally, which once again leaped to new all-time highs. The MAG7 caught fire along with numerous AI stocks. Gold also caught a bid and had its best week in weeks. The gold stocks were breaking out. Will it last?
The war continues to meander, and the Strait of Hormuz is still closed. But hope for a deal lives eternal with Trump. Oil prices fell again. But will it last? A sustained increase in oil prices would likely benefit an energy infrastructure and after-market services firm such as Enerflex Ltd., which announced reduced debt, increased cash, higher free cash flow, and an expanded backlog, pays a dividend, and is held in the Enriched Capital Conservative Growth Strategy.* The Strait of Hormuz is still not open, and there is little sign it will open, as Iran has demands that the U.S. can't or won't fulfill. Result - the war will most likely recommence.
This week sees the release of the July CPI/PPI data.
We're into August and halfway through the summer. A thought to all those impacted by the huge wildfires. Have a great week.
DC
* Reference to the Enriched Capital Conservative Growth Strategy and its investments, celebrating an
8.42 - year history of 204% growth (annual 14.17%) and alpha exceeding the index, is added by Margaret Samuel, President, CEO and Portfolio Manager of Enriched Investing Incorporated, who can be reached at 416-203-3028 or msamuel@enrichedinvesting.com This information should not be construed as an offer, or a solicitation of an offer or sale of any security. Past performance does not guarantee future returns.
“But if arming Iran to support Israel was insane, the flip side of the policy, in the long run at least, was truly demented: Weinberger and Shultz favored defending Saudi Arabia and the enormous U.S. oil interests there by secretly bolstering the brutal Iraqi dictator Saddam Hussein. As a result of their efforts, billions of dollars in aid and weapons were funneled to Saddam's regime.”
—Craig Unger, American journalist and writer, wrote House of Bush, House of Saud (2004), House of Trump, House of Putin: The Untold Story of Donald Trump and the Russian Mafia (2018), deputy editor of The New York Observer, editor-in-chief of Boston magazine; b. 1949
“The fossil fuel industry commands outsize sway over U.S. politics, markets, and democracy. I knew these companies were formidable, but when I served on the National Commission on the BP Deepwater Horizon Oil Spill and Offshore Drilling, I got a close-up view of how the industry disregards government safeguards.”
—Frances Beinecke, American activist, chairman Natural Resources Defense Council (2006–2015), serves on a number of environmental boards; b. 1949
“The Bush administration and Congressional Republicans have failed to bring up comprehensive energy reform or any piece of legislation for that matter that would lower gas prices, opting instead to give massive subsidies to the oil and gas industry”.
—Rosa DeLauro, American politician, U.S. representative for Connecticut's 3rd congressional district since 1991, chair of the House Appropriations Committee for the 117th Congress; b. 1943
In what has been a rare move, the U.S. Treasury joined the Bank of Japan (BOJ) recently in propping up the Japanese yen. A weak yen is not in the U.S.’s interest, given it makes Japanese exports cheaper. In 2025, the U.S. trade deficit with Japan was $63.9 billion. To date in 2026 it has reached $21.7 billion (June 2026). The U.S. worries this situation undermines their tariffs. A weak yen also makes Japanese imports more expensive. Japan imports some 97% of its energy needs for both oil and LNG. Japan also relies on food imports, representing some 60% of needs. Japan also has other needs, again relying heavily on imports.
Japan is the U.S.’s biggest ally in Asia. Japan also poses a financial threat to the U.S. in that it holds some $1.14 trillion of U.S. treasury securities, the largest of any holder. Yes, it represents only about 3% of all outstanding U.S. federal debt of about $40 trillion, but it is significant. Over the past year, Japan has not significantly added to its U.S. treasury holdings. Foreign holdings of U.S. treasury securities have gone up roughly $350 billion over the past year. Over the past year, the U.S. has added some $3.2 trillion to its national debt. Japan’s share is negligible while foreign holdings gains represent only about 11% of the total.
The U.S. needs buyers of its debt, given it runs a 6.5% budget deficit to GDP. The fear is that holders of U.S. debt could sell it to raise funds for domestic needs. If that happened U.S. bond prices would fall, yields would rise and the cost to service the massive U.S. debt could rise to unmanageable levels. The U.S. dollar would also fall as sellers of the debt convert their funds back into their home currency.
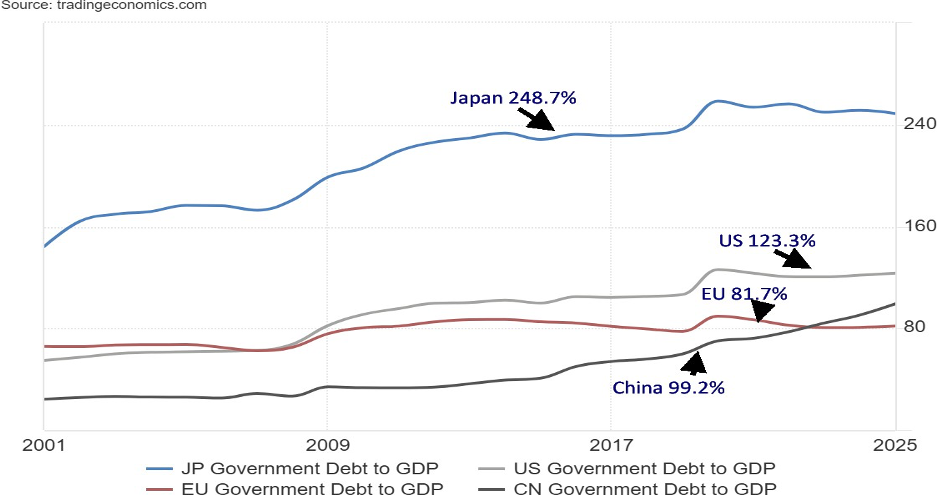
Japan has the largest debt to GDP, not just in the G7 but also in the world. Surprisingly, little is owned by foreign entities. Japanese debt (known as Japanese Government bonds or JGBs) is primarily owned by the BOJ,
along with pension funds, Japanese banks, and insurance companies. The BOJ owns about half. The huge debt accumulated over decades due to very slow growth and stimulus spending to grow the moribund Japanese economy.
The fear has been that Japan would be forced to sell some of their huge holdings of U.S. treasuries for domestic reasons. After years of low inflation (even deflation) and cheap debt, Japanese inflation has perked up and interest rates on JGBs have gone up, pushing borrowing costs higher. As a result, the BOJ has been forced to raise its key interest rate, even as it lags considerably the JGB market. As JGB yields hit record highs, the Japanese yen fell to 40-year lows. Cheap borrowing rates also contributed to the yen carry trade whereby one could borrow in yen at low rates, sell yen for primarily U.S. dollars, and invest in the higher-yielding U.S. treasury market or the stock market. Rising bond yields in Japan do not help the carry trade. A rising yen would hurt it even more. If Japan has to sell U.S. treasuries, this could set up the scenario for a bond crash, which could spread to the rest of the global financial market.
Chart 1 – Japanese debt to GDP with U.S. debt/GDP, EU debt/GDP, China debt/GDP 2001–2026
Source: www.tradingeconomics.com, www.mof.go.jp, www.whitehouse.gov, www.ec.europa.eu
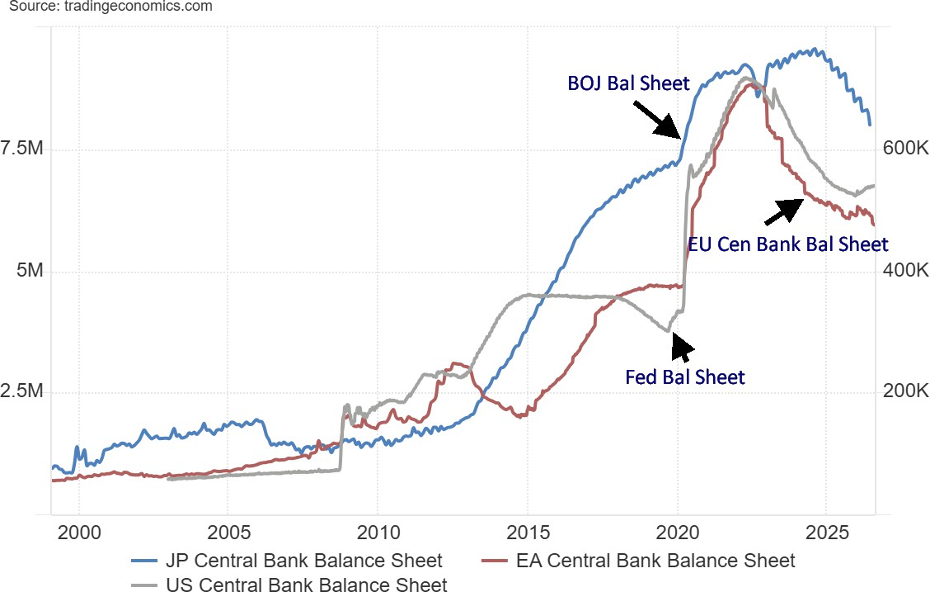
The world experienced a massive increase in debt after the 2008 financial crisis. Central banks of the world intervened heavily to prevent a complete financial collapse. The EU/Greek debt crisis that got underway in 2009 and lasted through most of the next decade added to the growth in debt. The pandemic of 2020 was the final push. Since then, actions by central banks have seen their balance sheets come down, although the U.S. Federal Reserve’s balance sheet has begun to grow again. The BOJ’s balance sheet was 123,000 billion yen (¥) in 2008. Today it sits at 639,551 yen (¥).
Chart 2 – Central Bank Balance Sheets Japan (BOJ), U.S. Federal Reserve (Fed), European Central Bank (ECB) 2000–2026
Source: www.tradingeconomics.com, www.boj.or.jp, www.ecb.europa.eu, www.federalreserve.gov
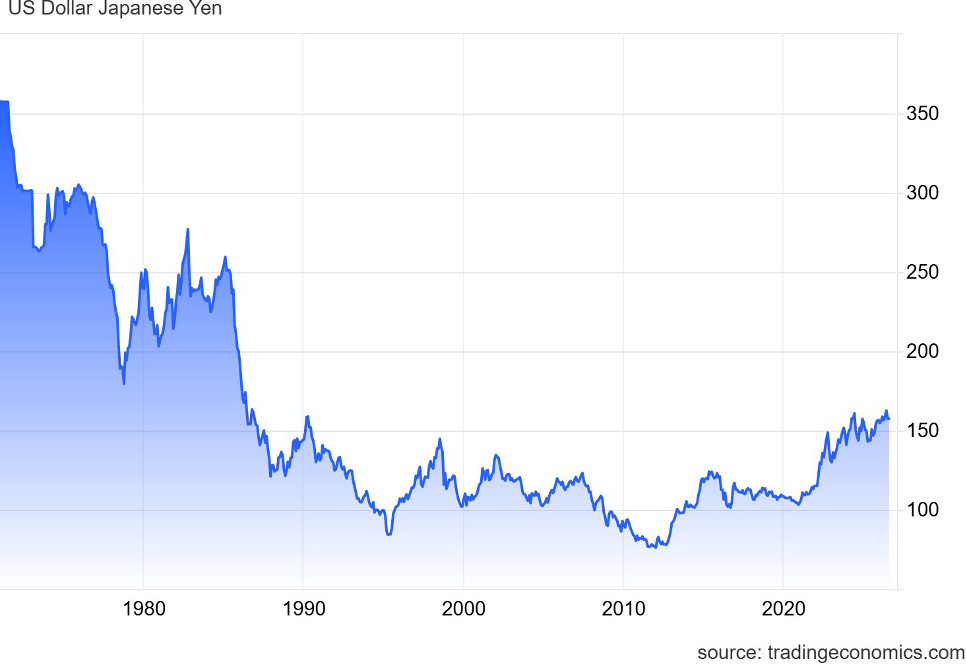
During the 1970s and 1980s the U.S. dollar was strong, while the Japanese yen was weak. US1$ could buy roughly 250 yen in the early 1980s. Over the years the yen was strengthened against the U.S. dollar and by 2010 US$1 could only buy about 75–80 yen. Since then, the yen has been weakening. With U.S. interest rates higher than Japanese interest rates, this has encouraged the dumping of yen for U.S. dollars. Today, US$1 could buy roughly 157 yen. Intervention by the BOJ and U.S. Treasury has brought it down. Barely two weeks ago US$1 could buy 163 yen. The U.S. didn’t sell U.S. dollars to buy yen but instead used euros so as to not weaken the U.S. dollar. Total intervention by the BOJ was about U.S.$52.8 billion while U.S. intervention was between $5–$10 billion. Will further intervention be necessary? A stronger yen puts less pressure on Japan to have to sell U.S. treasuries for domestic purposes. Some believe this is a desperation move on the part of the U.S. Treasury in order to prevent a bond sell-off.
Chart 3 – U.S. Dollar Japanese Yen 1976–2026
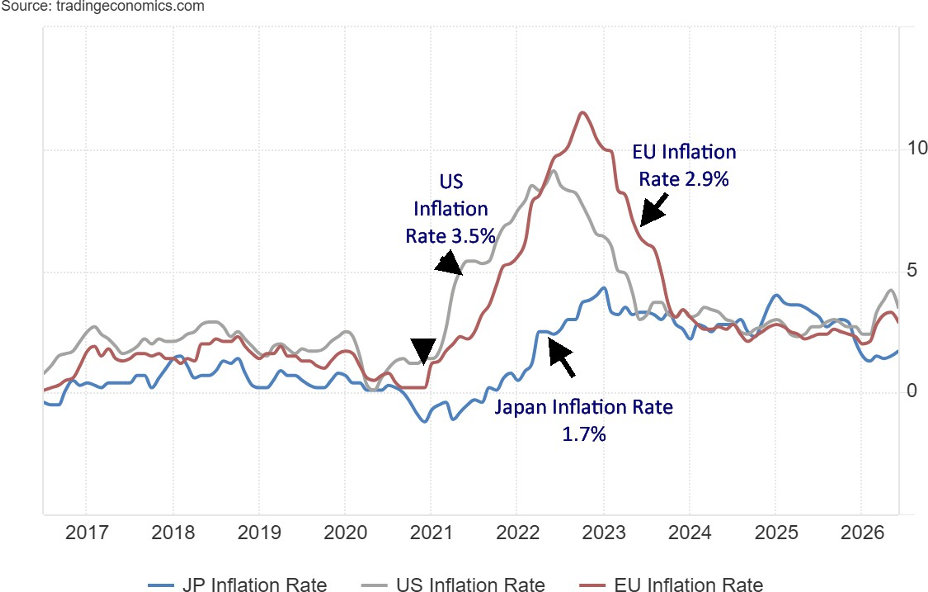
For years, Japanese inflation was low: near zero, and occasionally under zero. Like the U.S. and elsewhere, the rush to save the financial system during the 2020 pandemic unleashed a big bout of inflation by 2022. This was because of the massive increase in debt and stimulus, plus ultra-low interest rates (Japan’s interest rates went negative as did those in the eurozone). It was also the result of supply constraints and shortages. Inflation rates rose above central bank targets, primarily 2%. Japan’s inflation rate was last at 1.7%, the U.S.’s was at 3.5%, and the EU’s was at 2.9%.
Chart 4 – Inflation Rates Japan, U.S. and EU 2016–2026
Source: www.tradingeconomics.com, www.soumo.go.jp, www.bls.gov, www.ec.europa.eu
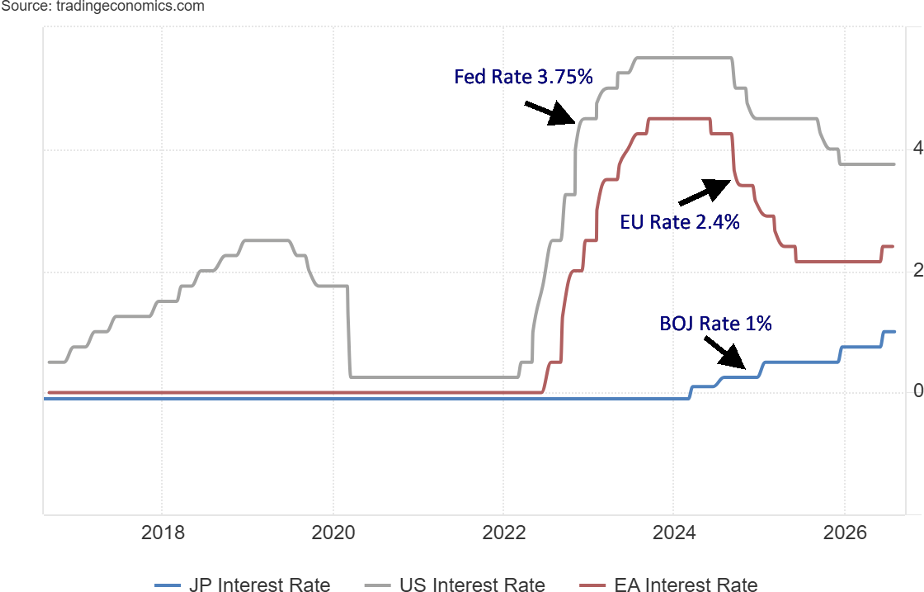
The result of all of that is that central banks have been hiking interest rates since 2022. While the U.S. and the EU have subsequently lowered rates as inflation eased, Japan continues to hike its rates. Today, the BOJ rate is 1% while the Fed rate is 3.75%, and the ECB’s rate is 2.4%. Compare that to inflation of 1.7% in Japan, 3.5% in the U.S., and 2.9% in the EU. Today, only the ECB has positive yields while both Japan and the U.S. are negative yields (inflation is higher than the central bank rate).
The low interest rates in Japan hurts the Japanese yen. But borrowing costs in Japan remain low, even as they have been rising.
Chart 5 – Central Bank Interest Rates BOJ, FED, ECB 2016–2026
Source: www.tradingeconomics.com, www.boj.or.jp, www.federalreserve.gov, www.ecb.europa.eu
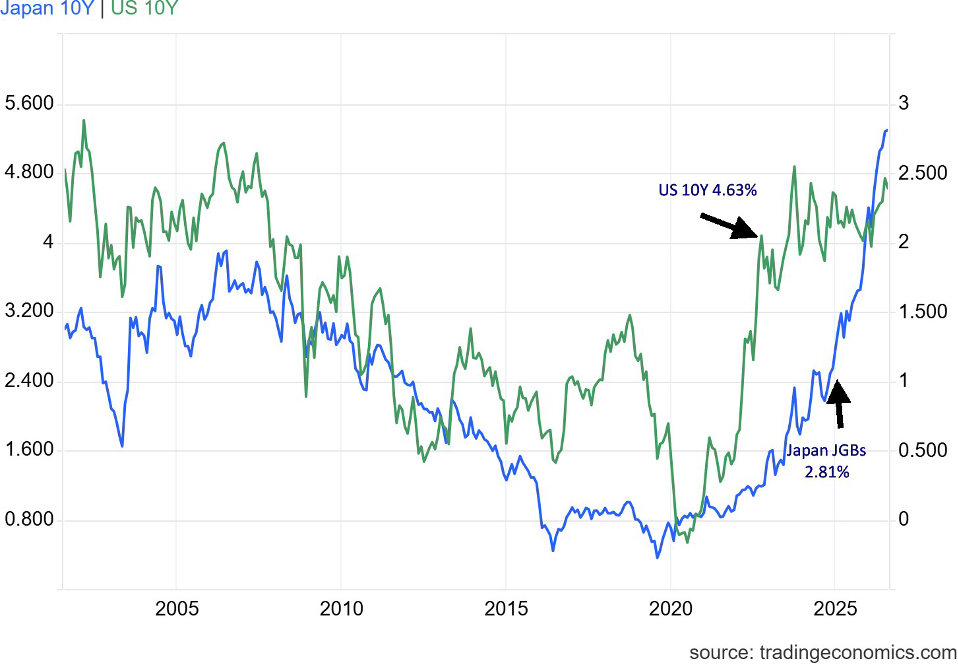
If the U.S. 10-year Treasury note rates have been rising, the Japanese 10-year bond (JGBs) has soared. Rates in Japan are at their highest levels seen since 1996. In September 2019, the Japanese 10-year hit its nadir at negative 0.23%. Yes, negative. Today, it sits at 2.81% and is rising. The Japanese 30-year bond hit 3.90% recently, near a record high. The Japanese 10-year has spent most of the time since 2000 hanging just above zero. Today, the spread between the Japanese 10-year and the U.S. 10-year is roughly 187 bp. At a nadir in August 2020, the differential was only 64 bp. Japanese rates were near zero.
Higher borrowing costs are having consequences for both countries. Recently, the U.S. borrowing costs were approaching $1.2 trillion annually. For Japan, recent borrowing costs were only about $68 billion but they are rising fast as their bond yields rise. In another few years they are projected to more than double current levels. All this is trouble for the Japanese market. Rising interest rates are putting the yen carry trade in trouble. The cost of borrowing is rising quickly for the Japanese government. Some say if the Japanese 10-year were to go over 3%, Japan would have trouble covering its interest costs. Just paying interest on the debt could represent some 30% of the budget.
For comparison purposes, U.S. interest payments now represent some 15% of their budget and they are rising. Interest payments as a percentage of the budget is growing. Interest payments now exceed the U.S. defense budget and is now third behind Social Security and Medicare/Medicaid.
Combine rising interest rates with a rising Japanese yen and the estimated $10 trillion yen carry trade could unravel. Interest costs are increasingly taking up a large percentage of the budget in both the U.S. and Japan. That crowds out other needs or requires more printing of money (inflationary).
Chart 6 – 10-year bond yields Japan (JGB) and U.S. (treasury note) 2001–2026
Source: www.tradingeconomics.com
One overlooked characteristic of Japan is they have both a large elderly population and a declining population. A large elderly population means rising pensions and healthcare costs straining government finances. A falling population means that economic growth could slow and there are fewer taxpayers to cover government expenses. Neither event is positive. The same is happening to a lesser extent in the EU, Canada, and even the U.S. Japan’s situation is the most worrisome.
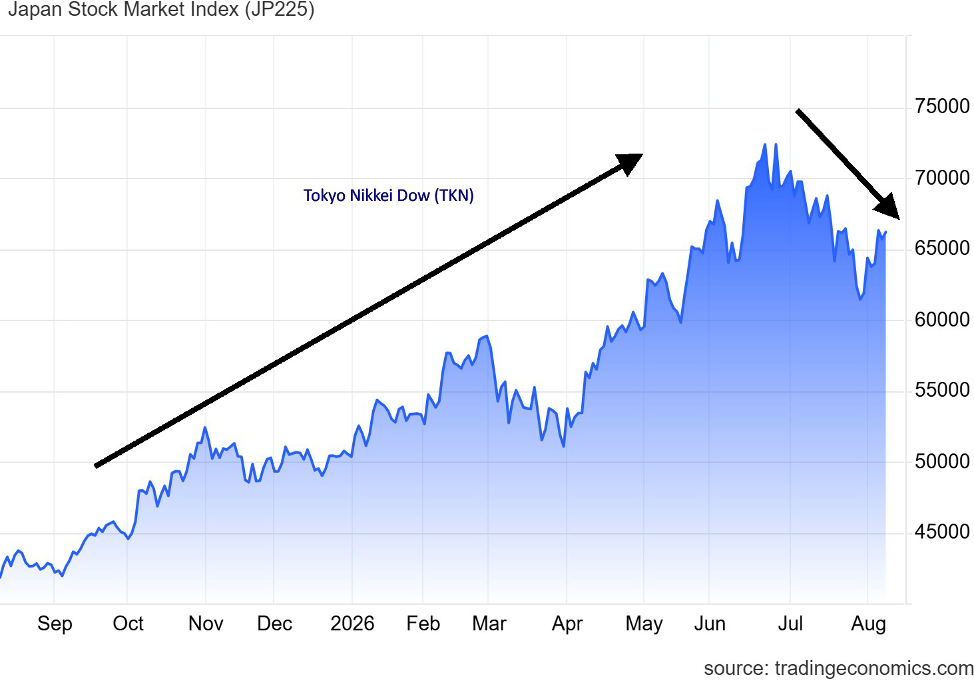
Japan’s stock market is rolling over. The market is being weighed down by rising energy costs, rising bond yields, and the end of cheap money. There are also signs that Japanese consumer spending is slowing. Finally, there is growing concern about AI.
Chart 7 – Japanese Nikkei 225 Index
Source: www.tradingeconomics.com
Japan’s elderly population is currently 29.3% of its population and is projected to grow to 34.8% by 2040. For most of the G7 countries, the elderly population makes up between 19% (United Kingdom and Canada) and 25% (Italy) of the population. The U.S. is the lowest at around 17%. In all cases, the elderly populations are
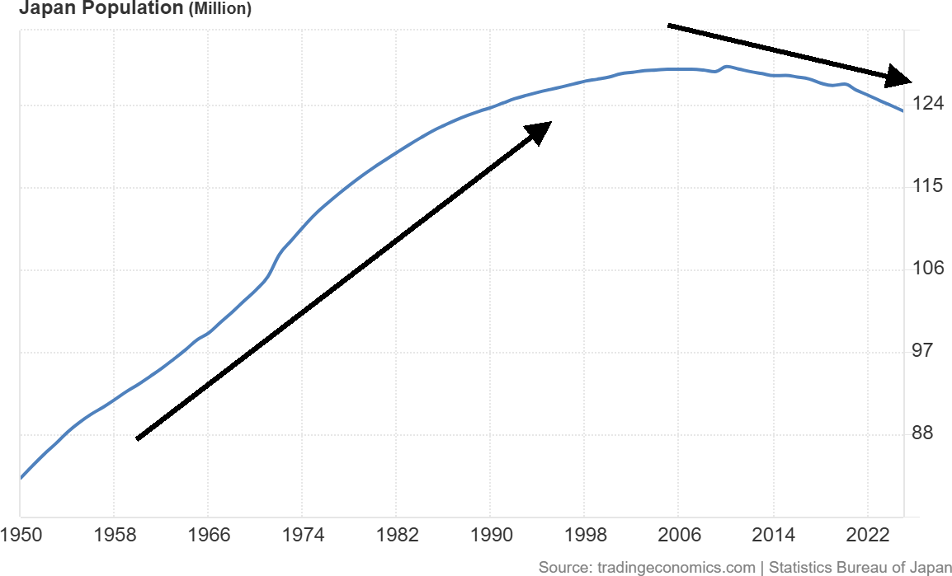
growing and, to different extents, all are experiencing declining populations. Japan’s population peaked around 2010 at roughly 128.6 million. Today it sits at 123.2 million (2025). The EU, U.S., and Canada are still experiencing rising population growth but it’s slowing. It would be foolish to underestimate the potential negative impact of both a falling population and a rising elderly population on the government finances of Japan. It could be a ticking time bomb.
All this leads us to believe that, of the G7 countries, if a financial crisis were to get underway it could start in Japan.
Chart 8 - Japan’s Population 1950–2026
Source: www.tradingeconomics.com, www.stat.go.jp
Chart of the week
U.S. job numbers
U.S. Employed Persons, NonFarm Payrolls 2021–2026
Source: www.tradingeconomics.com, www.bls.gov
In what was a surprise, the U.S. Bureau of Labor Statistics (www.bls.gov) reported that the U.S. lost 23,000 jobs in July. The market expected a gain of 80,000. What’s worse, both May and June were revised downward by 103,000 jobs. The unemployment rate (U3) was 4.1%, down from June’s 4.2%. That was caused solely by the fact that the civilian labour force fell by 264,000. The labour force participation rate was 61.4% vs. 61.5%, and the employment population ratio fell to 58.9% from 59%. The U6 unemployment rate (total unemployed, plus all persons marginally attached to the labour force, plus total employed part-time for economic reasons, as a percent of the civilian labour force, plus all persons marginally attached to the labour force) was 7.9%, unchanged from June. Notably, the number of people unemployed (official U3) fell by 178,000. But the population level rose by 116,000.
More people, fewer working, and fewer unemployed. Government, leisure, and hospitality workers led the decline. Full-time employment fell by 106,000 but part-time employment rose by 138,000. The not in the labour force category rose 79,000 (retirees make up the bulk of this category). Why is the labour force shrinking? Evidence suggests ICE deportations are causing many companies to lose workers. In some cases, it places the companies’ ability to continue into question. To replace workers, companies are looking at a shrinking pool and most likely a poor job match.
The number of multiple job holders rose by 39,000. Those unemployed 27 weeks or longer fell 64,000 while the average weeks unemployed fell to 24.9 from 25.5 and the median weeks unemployed rose to 9.5 from 8.8. Market reaction saw gold soar and stocks creep higher. Interest rates, measured by the U.S. 10-year Treasury note, saw yields tick marginally lower. All this puts the Fed in a new bind. Inflation says to raise rates. A slowing economy says to lower rates. Stagflation? Given some dovish statements from Fed Chair Kevin Warsh, lower rates are a possibility if the three who voted for higher rates at the last FOMC meeting back off. We won’t know until the September FOMC. The latest inflation numbers will be reported this coming week.
All this points to a weaker labour market than many expected. ICE deportations are also causing a labour problem. The anti-immigration policies have slowed the growth of the pool of potential workers. This is not a good sign going forward. The U.S. has become two-tiered where a booming AI market helps push up prices but war and tariffs are pushing in the opposite direction. Those not benefitting from the AI boom are increasingly left behind.
The labour market has weakened, although not drastically yet. We note that wage growth is also slowing, suggesting weak bargaining power from workers. Those in the labour force have also become more pessimistic about the ability to find a job. “The hottest economy,” as Trump claims? Not a chance.
Canada job numbers
Canada Employed Persons, Employment Change 2021–2026
Source: www.tradingeconomics.com, www.statcan.gc.ca
Despite all the trade uncertainty, Canada surprised by adding 75,100 jobs in July, well above the 15,000 forecasted. The unemployment rate fell to 6.4% from 6.5%, the best level in two years. The R8 unemployment rate (plus discouraged searchers, waiting group, portion of involuntary part-timers), the highest level reported by Statistics Canada (www.statcan.gc.ca) jumped to 9.3% from 8.5%. Full-time employment jumped 38,600 while part-time employment was up 36,600. Gains came from wholesale and retail, finance, and insurance. Public sector employment fell. Ontario led the job gains.
A bonus in this was a decline in student unemployment. All this points to a stronger than expected economy for Q2. Statistics Canada is expecting 3.4% growth in Q2. Canada job gains are up 196,000 over the past year. The U.S. is up 316,000 jobs in the past year on a population base eight times the size of Canada.
All this was good as the Canadian dollar jumped, as did the TSX Composite thanks to the materials sector. Bond yields eased slightly. However, danger continues to lurk in the background in the form of Trump’s threats of 50% tariffs later in August. As well, word is negotiations on the trade front are not going well because of U.S. demands that Canada cannot accede to. Canada will, no doubt, seek compromises to avoid another 50% tariff.
Markets and Trends
|
|
|
|
% Gains (Losses) Trends |
|
||||
|
|
Close Dec 31/25 |
Close Aug 7/26 |
Week |
YTD |
Daily (Short Term) |
Weekly (Intermediate) |
Monthly (Long Term) |
|
|
|
|
|
|
|
|
|
||
|
S&P 500 |
6,845.50 |
7,757.64 (new highs) * |
3.6% |
13.3% |
up |
up |
up |
|
|
Dow Jones Industrials |
48,063.29 |
54,036.93 (new highs) * |
3.0% |
12.4% |
up |
up |
up |
|
|
Dow Jones Transport |
17,357.19 |
21,506.09 |
2.2% |
23.9% |
down |
up |
up |
|
|
NASDAQ |
23,241.99 |
26,690.62 |
5.2% |
14.8% |
up |
up |
up |
|
|
S&P/TSX Composite |
31,712.76 |
36,381.23 (new highs) * |
3.3% |
14.7% |
up |
up |
up |
|
|
S&P/TSX Venture (CDNX) |
987.74 |
954.90 |
10.1% |
(3.3)% |
up |
down |
up |
|
|
S&P 600 (small) |
1,467.76 |
1,811.16 (new highs) * |
2.4% |
23.4% |
up |
up |
up |
|
|
ACWX MSCI World x US |
67.18 |
77.41 (new highs) * |
2.9% |
15.3% |
up |
up |
up |
|
|
Bitcoin |
87,576.98 |
64,956.19 |
3.2% |
(25.8)% |
up |
down |
neutral |
|
|
|
|
|
|
|
|
|
|
|
|
Gold Mining Stock Indices |
|
|
|
|
|
|
|
|
|
Gold Bugs Index (HUI) |
701.49 |
753.05 |
21.9% |
7.4% |
up |
down (weak) |
up |
|
|
TSX Gold Index (TGD) |
817.76 |
885.70 |
20.4% |
8.3% |
up |
neutral |
up |
|
|
|
|
|
|
|
|
|
|
|
|
Bonds% |
|
|
|
|
|
|
|
|
|
U.S. 10-Year Treasury Bond yield |
4.17% |
4.65% |
(1.9)% |
11.5% |
|
|
|
|
|
3.3Cdn. 10-Year Bond CGB yield |
3.44% |
3.64% |
(0.8)% |
5.8% |
|
|
|
|
|
Recession Watch Spreads |
|
|
|
|
|
|
|
|
|
U.S. 2-year 10-year Treasury spread |
0.69% |
0.44% |
(4.4)% |
(36.2)% |
|
|
|
|
|
Cdn 2-year 10-year CGB spread |
0.85% |
0.67% |
(10.7)% |
(21.2)% |
|
|
|
|
|
|
|
|
|
|
|
|
|
|
|
Currencies |
|
|
|
|
|
|
|
|
|
US$ Index |
98.26 |
99.59 |
(0.4)% |
1.4% |
down |
up (weak) |
down (weak) |
|
|
Canadian $ |
72.87 |
71.71 |
0.6% |
(1.6)% |
up |
down |
down |
|
|
Euro |
117.48 |
115.58 |
0.3% |
(1.6)% |
up |
down (weak) |
up |
|
|
Swiss Franc |
126.21 |
123.76 |
flat |
(1.9)% |
neutral |
down |
up |
|
|
British Pound |
134.78 |
134.93 |
0.1% |
0.1% |
up |
up (weak) |
up |
|
|
Japanese Yen |
63.83 |
63.43 |
0.8% |
(0.6)% |
up |
neutral |
down |
|
|
|
|
|
|
|
|
|
|
|
|
Precious Metals |
|
|
|
|
|
|
|
|
|
Gold |
4,311.97 |
4,341.17 |
7.3% |
0.7% |
up |
down |
up |
|
|
Silver |
71.16 |
63.50 |
9.9% |
(10.8)% |
up |
down |
up |
|
|
Platinum |
2,046.90 |
1,757.30 |
5.9% |
(14.2)% |
up |
down |
up |
|
|
|
|
|
|
|
|
|
|
|
|
Base Metals |
|
|
|
|
|
|
|
|
|
Palladium |
1,619.50 |
1,382.00 |
8.0% |
(14.7)% |
up |
down |
neutral |
|
|
Copper |
5.64 |
6.57 (new highs) * |
1.0% |
16.4% |
up |
up |
up |
|
|
|
|
|
|
|
|
|
|
|
|
Energy |
|
|
|
|
|
|
|
|
|
WTI Oil |
57.44 |
77.05 |
(9.0)% |
34.4% |
neutral |
up (weak) |
up (weak) |
|
|
Nat Gas |
3.71 |
2.67 |
(1.1)% |
(28.0)% |
down |
down |
down (weak) |
|
Source: www.stockcharts.com
* New All-Time Highs
Note: for an explanation of the trends, see the glossary at the end of this article.
New highs/lows refer to new 52-week highs/lows and, in some cases, all-time highs.
Stocks
Source: www.stockcharts.com
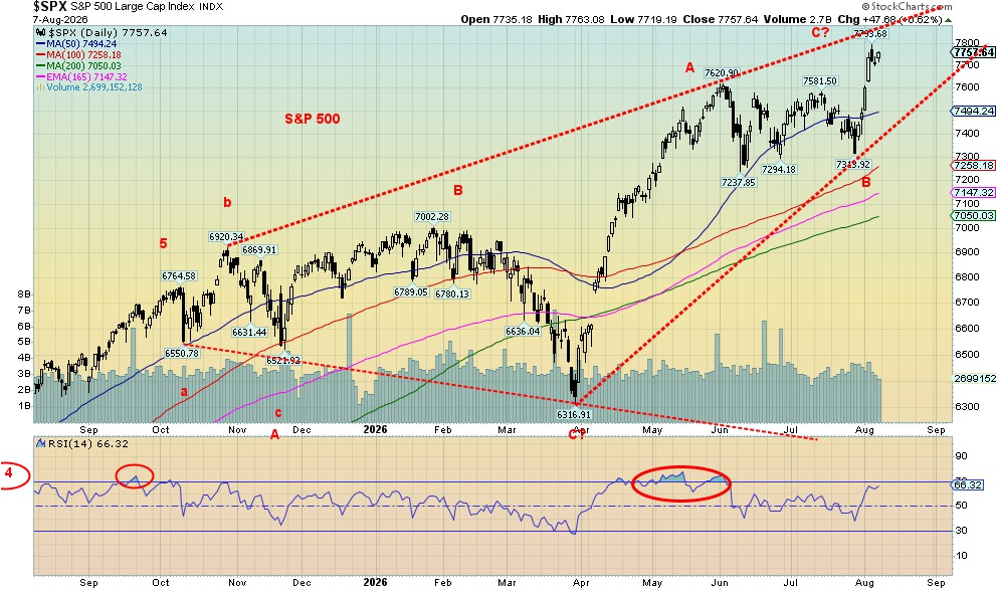
My, my. It’s the bull that doesn’t want to die. AI stocks and the MAG7 all leaped this past week, and the result was new all-time highs for the S&P 500 and the Dow Jones Industrials (DJI). Others that joined the all-time high parade were the NYSE Composite, the Dow Jones Composite (DJC), the S&P 500 Equal Weight Index, the S&P 100 (OEX), the S&P 400 (Mid), the S&P 600 (Small), the Russell 1000, 2000, and 3000, and the NY FAANG Index (barely).
It’s the market that refuses to die. Eventually all do, but in the interim, yes, we could go higher still. Robust corporate earnings, investments in AI infrastructure, and resilient economic indicators despite this week’s nonfarm payrolls report are all helping to push markets higher. An accommodative Fed is also helping as we note that both M1 and M2 are rising and the Fed’s balance sheet is growing once again. All have ended downtrends and turned higher. That tells us that the Fed is being more accommodative. The last thing Trump wants is a falling stock market. The bottom half (even 80%) of the economy is not relevant as long as the stock market goes up and the 1% get richer.
Despite the weaker than expected job numbers on Friday, the market also got excited about a possible deal to open the Strait of Hormuz. The odds of that happening? Slim to none. But in the interim, the market doesn’t care.
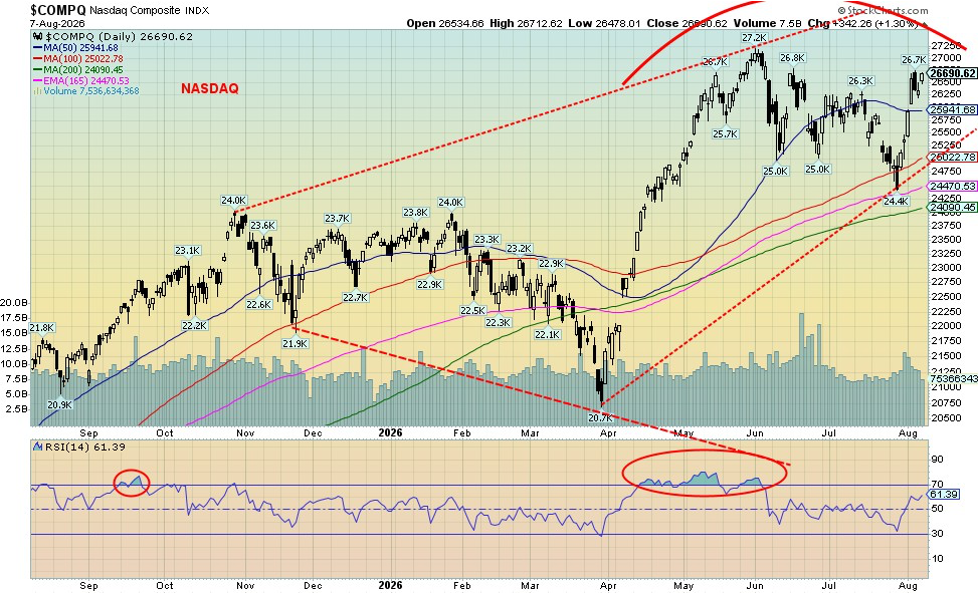
Just the thought of it is enough. On the week, the S&P 500 rose 3.6%, the DJI was up 3.0%, the Dow Jones Transportations (DJT) rose 2.2%, and the NASDAQ was up 5.1%, thanks to the tech rally. The S&P 400 (Mid) was up 3.4%, the S&P 600 (Small) gained 2.4%, the NY FANG Index gained 8.5% while the S&P 500 Equal Weight Index made all-time highs, up 2.4%. Bitcoin, not to be outdone, gained 3.2% but remains down almost 50% from its all-time high.
In the EU, records also fell. The London FTSE was up 0.3%, the EuroNext made all-time highs, up 2.3%, the Paris CAC 40 also made all-time highs, up 2.4%, as did the German DAX, up 2.7%. Contagion spread to the EU, catching the bull move. In Asia, China’s Shanghai Index (SSEC) was up 2.8%, the Tokyo Nikkei Dow (TKN) gained 1.9%, Hong Kong’s Hang Seng (HSI) faltered, down 0.8%, but India’s Nifty Fifty was up 0.8%.
Source: www.stockcharts.com
Highlighting the MAG7, we noted all were up except for Google, which was down 0.9%. Nvidia led the way up, 11.6%. Others making double-digit gains included Snowflake, up 12.7% to all-time highs, ServiceNow (NOW), up 12.3%, CrowdStrike (CRWD), up 12.3%, and a big rebound from SpaceX (SPCX), up 22.8%.
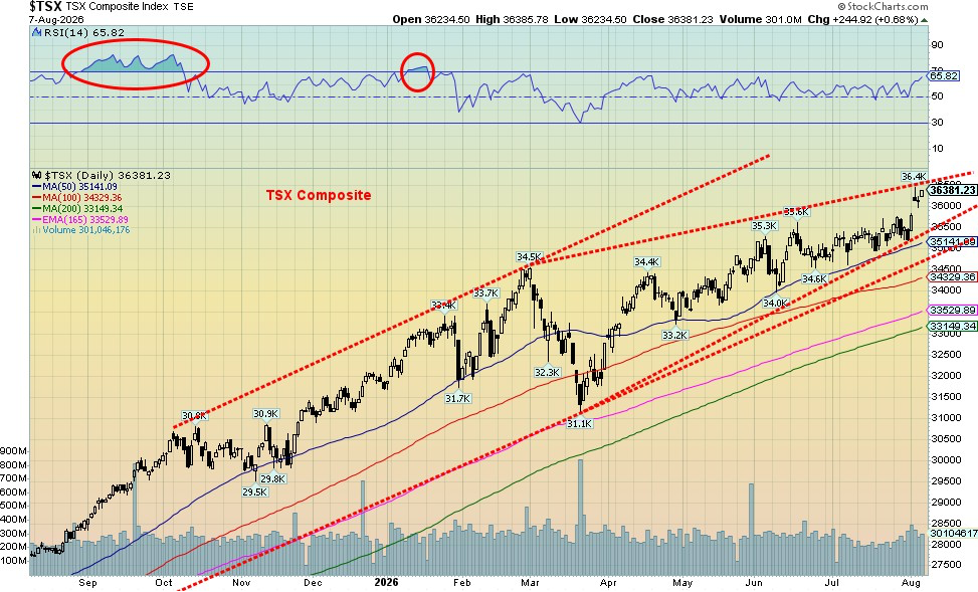
In Canada, the TSX Composite gained 3.3% to new all-time highs. The TSX Venture Exchange (CDNX) saw some life, up 10.1%. Of the sub-indices, six were down and eight up. Leading the way was the material indices with Golds (TGD) up 20.4%, Metals (TGM) up 14.9%, and Materials (TMT) up 16.9%. The biggest loser was Energy (TEN), down 6.3%.
Source: www.stockcharts.com
Where is the market headed? Higher, it seems. We could make an argument that the S&P 500 target is 8,000. But if this market fades, then a break under 7,300 could prove deadly. It’s the market that doesn’t want to die.
The 1982–2000 bull that culminated in the dot.com bull lasted 18 years. That was despite interruptions in 1987, 1990, 1994, and 1998. So far, this one is only up 17 years (2009–2026) with interruptions in 2015/2016, 2018, 2020, and 2022. Do we really have another year to go? The next example of the well-defined six-year cycle is not due until 2028. Watch the downside breaks. Otherwise, the trend is up. For the moment.
Bonds
Source: www.tradingeconomics.com, www.home.treasury.gov, www.bankofcanada.ca
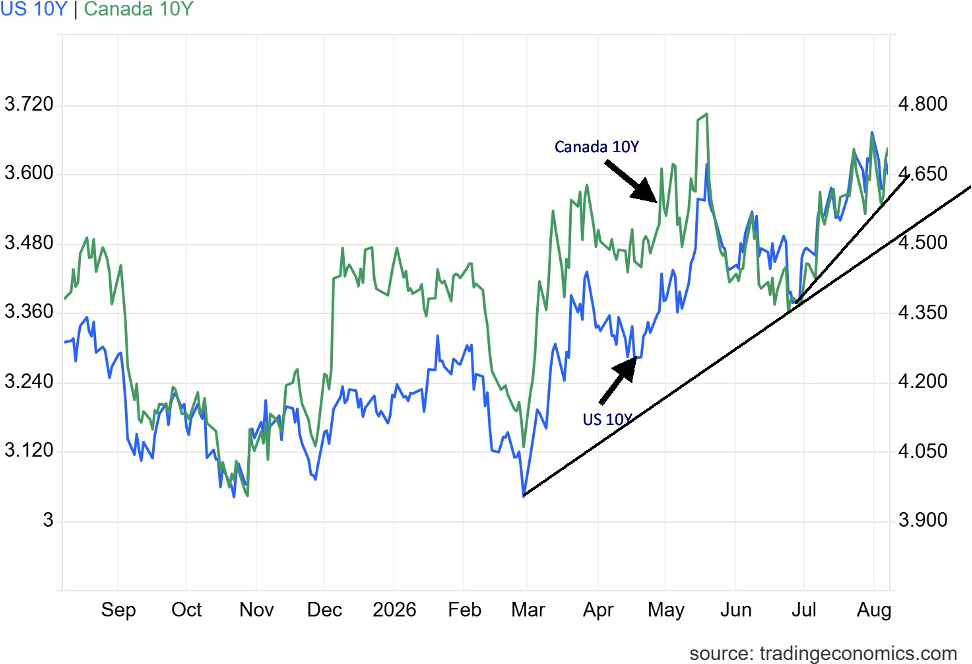
Treasury yields eased slightly this past week, thanks to the weaker than expected July job numbers. The 10-year U.S. Treasury note fell to 4.65% from 4.74%. Canada’s 10-year government of Canada bond (CGB) also eased to 3.64% from 3.67%, despite Canada’s big jump in jobs. The fall in the U.S. job numbers has raised concerns about the U.S. labour market. It also dims the chances of a Fed rate hike on the September 15–16 FOMC. We have a dovish Fed chair in Warsh but dissident governors that wanted a rate hike. The July CPI/PPI is out this coming week, so that may indicate what direction interest rates should go in.
Still, the consensus on rates puts some odds on a September rate hike and even more so on an October rate hike. However, the odds on a rate hike have fallen. Complicating things is the move by Warsh to end forward guidance. Warsh had long criticized the Fed’s practice of forward guidance. That may be the case, but dropping forward guidance may cause more volatility in the bond market. The bond market is the purveyor of forward guidance. If the Fed won’t provide guidance, the bond market will.
PCE Price Index vs. Fed Rate 2016–2026
Source: www.tradingeconomics.com, www.federalreserve.gov, www.bea.gov
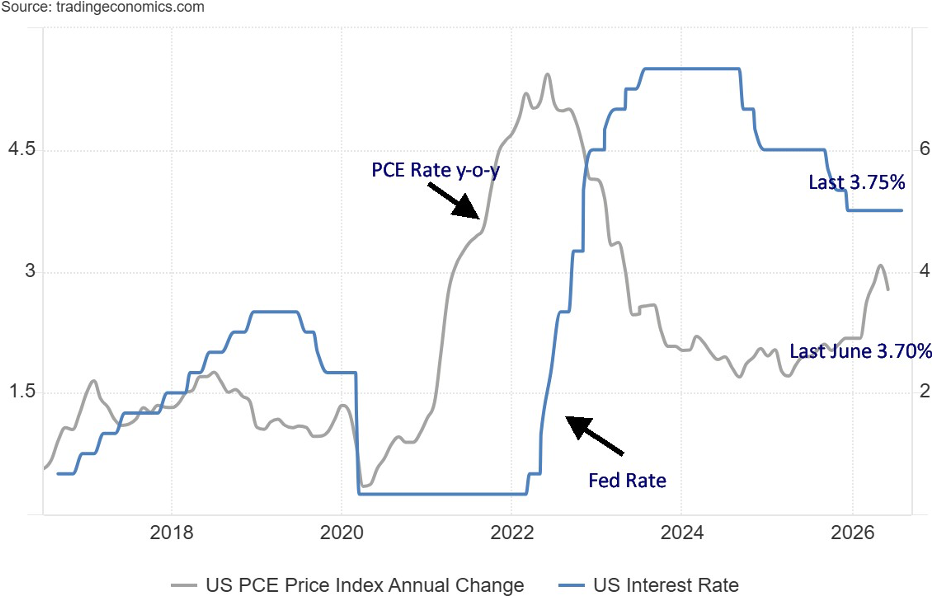
The Fed’s favourite inflation measurement is Personal Consumption Expenditures (PCE). Currently, the PCE rate is last at 3.70% year over year. The July rate is due later this month. The Fed rate is 3.75%. If the PCE rises, pressure will be on the Fed to hike rates, not lower them. Or it will leave them in a quandary as to what to do. Hike, lower, or do nothing. The Fed’s inflation target is 2%, and we can see we are nowhere near that.
Despite the easing of rates this past week, the trend is up. We’d have to get under 4.50% to suggest that the uptrend is reversing. Getting under 4.35% would be a better sign. Otherwise, the trend is rates up. And the Fed’s lack of forward guidance isn’t helping.
Gold and silver
Source: www.stockcharts.com
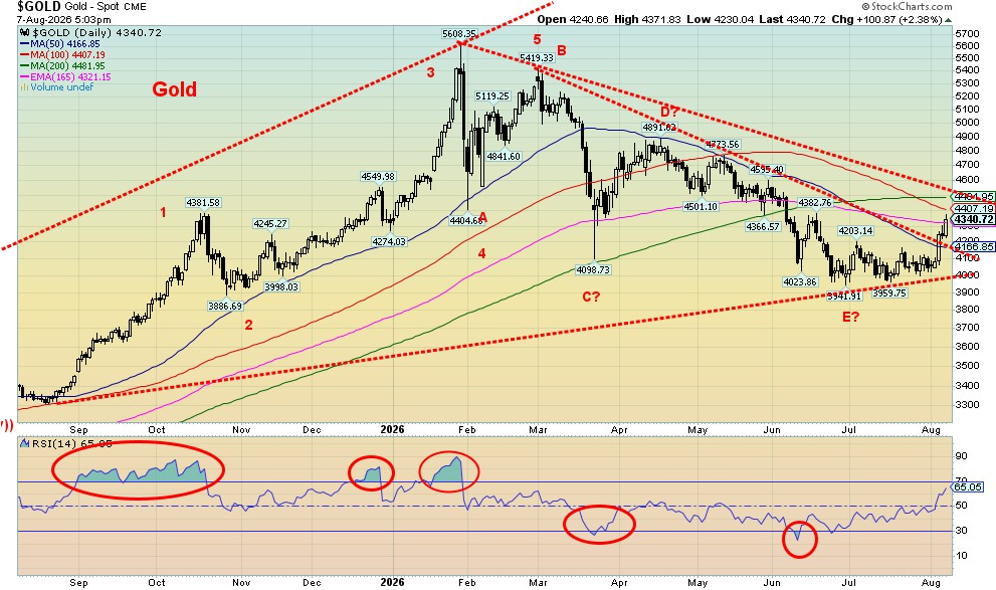
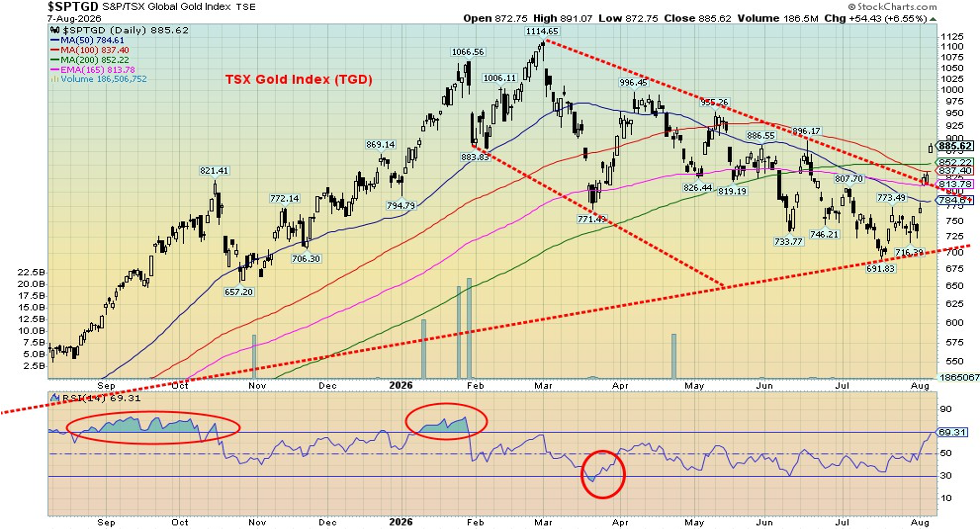
Is gold’s low in? Many are declaring so or at least would like to believe that is the case. We’re not quite with them. Yes, the breakout this past week looks good. Gold stocks appear to have broken a sharp downtrend line. Note the chart of the TSX Gold Index (TGD) on the next page. We’ve seen similar breakouts on others as well. It’s all very positive, but we can’t quite say the final low is in. We usually reserve that to making new highs. $5,600 remains a way away.
The five-wave descent which we have labeled ABCDE could just be an A wave of a higher degree. We could now be embarking on the B wave of a higher degree. We have entered a positive seasonal period which could last into September and even October. But the October/December period is often a weak period as we have noted in the past. Failure to make new highs on this run could result in another test of the lows and even new lows before we embark on a stronger up move. We are roughly four years from the important 2022 low but that tells us that we are only halfway through the current 7.8-year cycle. The question, of course, is will the second half-cycle see new highs or are we entering a more prolonged down cycle? The gold bulls believe it is the former and we will see new highs up to $6,000 or $7,000. Some are even calling for $10,000. All that may be true, but to date we see no evidence nor do we have confirmation of a low.
Source: www.stockcharts.com
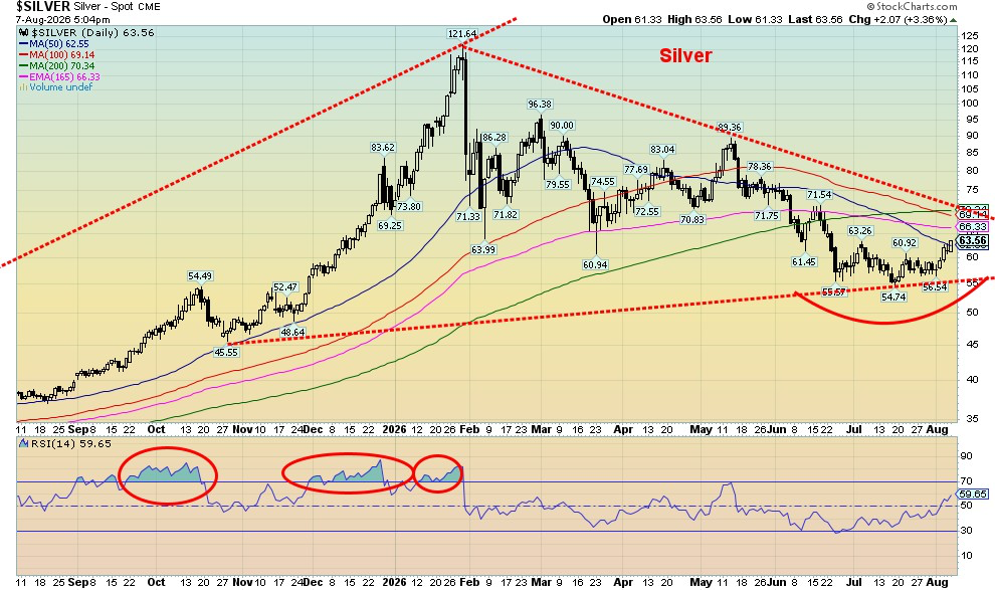
For starters, we need to break out over $4,400 to confirm the low at $3,941. But we need to break and close above $5,200 to even begin to think about a run to new highs. Once we see new highs above $5,600, then we can focus on possible higher targets. Silver is in the same position. The decline from the January high of $121.64 has unfolded as either an ABC or also an ABCDE – a corrective wave. We won’t break out until we are over $70. We need to regain above $106 to suggest new highs. As a result, we are cautious about silver until we see better action. The gold/silver ratio did improve and now sits at 68.37, well down from the 126 high of 2020 during the pandemic.
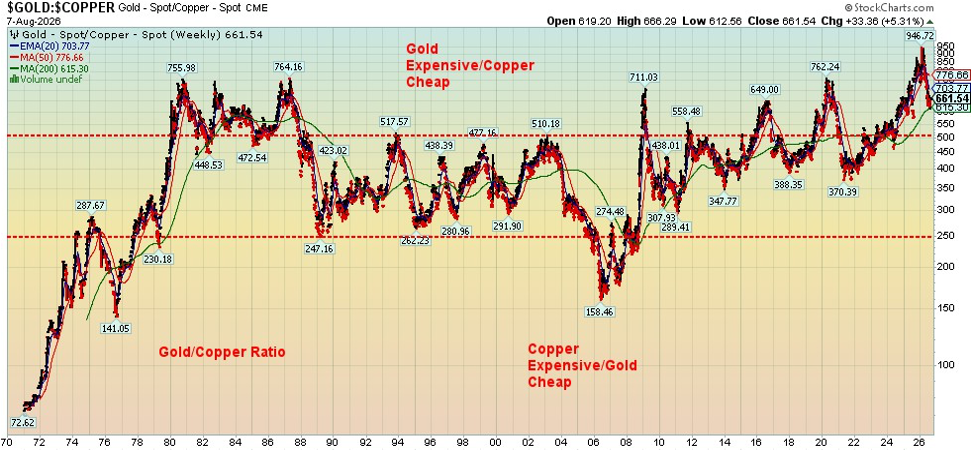
On the week, gold rose 7.3% and is now positive on the year again. Silver was up 9.9% but remains negative for 2026. The gold stocks were impressive, where the Gold Bugs Index (HUI) jumped 21.9% and the TSX Gold Index (TGD) was up 20.4%. Both are now positive on the year with the HUI up 7.4% and the TGD up 8.3%. Platinum rose 5.9% while palladium was up 8%. Copper made new all-time highs (barely), gaining 1%. Copper, we believe, is the leader. So, gold will move to catch up. That said, gold remains somewhat expensive vis-à-vis copper. The following chart of the Gold/Copper ratio still shows that gold remains expensive. Even if gold were to start to catch up to copper’s move, copper could still outperform.
The rally this past week is positive. We appear to be embarking on another up move. Our big question is, is this a move that takes us to new highs or merely a corrective wave to the January/July down move? We suspect it’s the latter. But eventually we should break out to new highs. However, that might not occur until 2027.
Source: www.stockcharts.com
Source: www.stockcharts.com
Oil and gas
Source: www.stockcharts.com
If you are confused about what is going on between the U.S. and Iran and the operation of the Strait of Hormuz, welcome to the club. The two issue contradicting statements. Trump says a deal is at hand; Iran doesn’t know what he’s talking about and lays out its demands; the Strait of Hormuz remains effectively closed. Iran and Oman have been working on a deal that would allow limited access in and out of the strait. The Iranian bill would, however, effectively ban the U.S., Israel, and any other country hostile to Iran from using the strait. That includes just about any country in the Gulf region. Iran backs up its threat with drones and missiles that could strike ships going through the Strait of Hormuz. Is the final deal close? Not a chance. Iran has demands that have not been met. Nor will they be any time soon. For that matter, is the Iran/Oman deal completely resolved? No. The Strait of Hormuz remains closed. War could break out again at any time.
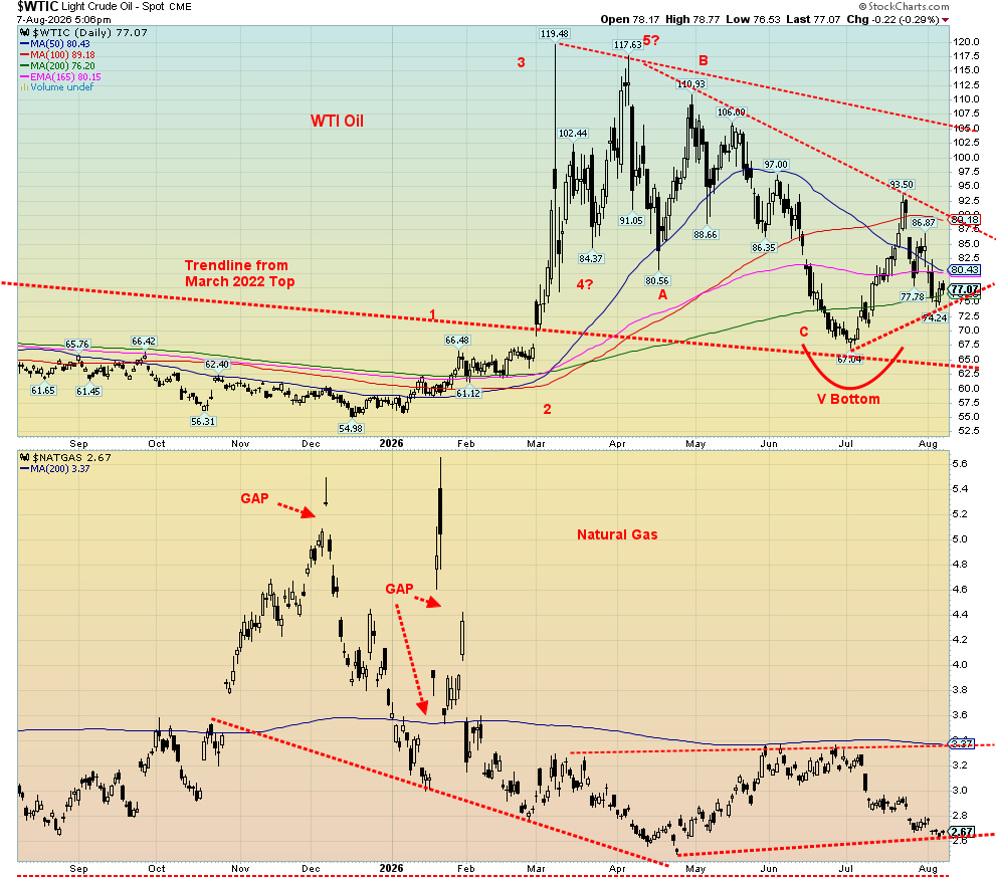
Yet the oil market takes it all to heart and seemingly wants to believe that a deal is close. As a result, oil sells off like it did this past week. WTI oil fell almost 9% this past week. Brent crude was down 6.7%. Yes, we bounced back a bit at week’s end. Natural gas wasn’t immune as NG at the EU Dutch Hub fell 7.8%. North American NG, not particularly impacted by the events in the Gulf, was also off but only 1.1%. Energy stocks fell with the ARCA Oil & Gas Index (XOI) down 5.2% while the TSX Energy Index (TEN) fell 6.3%. Relatively speaking, the energy stocks are hanging in despite the turmoil.
Not helping is Ukraine’s ongoing bombing of Russian oil facilities. While it does harm Russia, it also helps put upward pressure on the price of oil globally. The ongoing Russia/Ukraine war seems to have taken a back seat to the events in the Gulf. But the two are converging, given Ukraine’s recent assault on an Iranian cargo ship alleged to be carrying arms to Russia. The convergence had been ongoing at any rate as Iran was supplying drones and other military weapons to Russia, no different than the EU and the U.S. supplying Ukraine with the same. As wars converge and others are dragged into the conflict, the potential for it to become World War III rises.
We should note that commercial oil stocks in storage remain painfully low, not just in the U.S. but in the EU and elsewhere. Diesel is a particular problem. Asia is in better shape than the U.S. and the EU.
Technically, we view oil positively. We had a clear ABC decline from the March/April 2026 high. It remains possible that the spike July low $67 was the low. Since then, we appear to have made a V bottom reversal. Recent action has a corrective ABC look to it. If WTI can hold above $75 and then take out $90 once again, we could have confirmation of a low. A full breakout does not occur until we are over $105. NG could be making a double bottom here but now must hold above $2.50. The takeout point is at $3.40, although we’d require a few days close above that level to confirm the low.
Seasonally, we are in a weak period for energy. So maybe all this should be no surprise. We remain a few months away from another seasonally strong period. But inevitably oil appears destined to rise again, and the events in the Gulf will guide the way.
Copyright David Chapman 2026
GLOSSARY
Trends
Daily – Short-term trend (For swing traders)
Weekly – Intermediate-term trend (For long-term trend followers)
Monthly – Long-term secular trend (For long-term trend followers)
Up – The trend is up.
Down – The trend is down
Neutral – Indicators are mostly neutral. A trend change might be in the offing.
Weak – The trend is still up or down but it is weakening. It is also a sign that the trend might change.
Topping – Indicators are suggesting that while the trend remains up there are considerable signs that suggest that the market is topping.
Bottoming – Indicators are suggesting that while the trend is down there are considerable signs that suggest that the market is bottoming.
Disclaimer
David Chapman is not a registered advisory service and is not an exempt market dealer (EMD) nor a licensed financial advisor. He does not and cannot give individualised market advice. David Chapman has worked in the financial industry for over 40 years including large financial corporations, banks, and investment dealers. The information in this newsletter is intended only for informational and educational purposes. It should not be construed as an offer, a solicitation of an offer or sale of any security. Every effort is made to provide accurate and completeinformation. However, we cannot guarantee that there will be no errors. We make no claims, promises or guarantees about the accuracy, completeness, or adequacy of the contents of this commentary and expressly disclaim liability for errors and omissions in the contents of this commentary. David Chapman will always use his best efforts to ensure the accuracy and timeliness of all information. The reader assumes all risk when trading in securities and David Chapman advises consulting a licensed professional financial advisor or portfolio manager such as Enriched Investing Incorporated before proceeding with any trade or idea presented in this newsletter. David Chapman may own shares in companies mentioned in this newsletter.Before making an investment, prospective investors should review each security’s offering documents which summarize the objectives, fees, expenses and associated risks. Although Artificial Intelligence (AI) may be deployed from time to time, AI output is monitored and adjusted, if necessary, for accuracy. David Chapman shares his ideas and opinions for informational and educational purposes only and expects the reader to perform due diligence before considering a position in any security. That includes consulting with your own licensed professional financial advisor such as Enriched Investing Incorporated. Performance is not guaranteed, values change frequently, and past performance may not be repeated.
About the author


Website: https://www.enrichedinvesting.com
Disclaimer: David Chapman is not a registered advisory service and is not an exempt market dealer (EMD) nor a licensed financial advisor. We do not and cannot give individualised market advice. David Chapman has worked in the financial industry for over 40 years including large financial corporations, banks, and investment dealers. The information in this newsletter is intended only for informational and educational purposes. It should not be considered a solicitation of an offer or sale of any security. The reader assumes all risk when trading in securities and David Chapman advises consulting a licensed professional financial advisor before proceeding with any trade or idea presented in this newsletter. David Chapman may own shares in companies mentioned in this newsletter. We share our ideas and opinions for informational and educational purposes only and expect the reader to perform due diligence before considering a position in any security. That includes consulting with your own licensed professional financial advisor.