
It was a week of sticky inflation and rising oil prices. Inflation numbers (CPI, PPI) came in mostly as expected but remain elevated. Oil prices leaped after the Houthis of Yemen seized a Red Sea port and solidified their hold on an island in the Bab-el-Mandeb Strait. The Saudis shut down their East-West pipeline to the Red Sea after the Houthis bombed it. The war continues in the Persian Gulf/Strait of Hormuz with no sign of an end, irrespective of what President Trump might say.
Commodities are the lifeblood of the economy. Over the past 60 years we have seen two such periods described as commodity supercycles. We are currently in the midst of another one. Our conclusion is that we have a lot further to go. The leaders are oil, gold and copper and to a lesser extent wheat. Our opener examines the commodity supercycle.
"I am the house," declared U.S. Treasury Secretary Scott Bessent. He's joined the BOJ to help push up the value of the Japanese yen and is intervening in the U.S. bond market in an attempt to push long yields down. He's the house because he is effectively daring anyone to take him on. The house always wins. Bessent's house and his attempts on the U.S. bond market and the yen are the subject of our chart of the week. Is it working? The 10-year U.S. treasury note is approaching 5%, a danger point.
This past week, stocks faded, gold bobbled, bond yields rose, and oil prices leaped. Has the stock market topped once again? There is no confirmation yet but the market continues to look shaky. Gold is being pushed around by rising bond yields. Rising yields, positively impacting investment income of insurance companies, are likely to benefit Manulife Financial Corporation that reported increased core earnings, higher ROE, and improved financial leverage ratio, pays a dividend, and is held in the Enriched Capital Conservative Growth Strategy.* Oil prices leaped because the Saudis shut the important East-West pipeline that carries 2-3 million barrels of oil per day. Thank the Houthis of Yemen who are effectively now controlling the Bab-el-Mandab Strait between the Red Sea and the Gulf of Aden. The strait is one of the most important trade chokepoints behind the Strait of Hormuz.
Big week as the Fed announces its interest rate decision on Sep 16. The expectation now has shifted to the Fed hiking rates by 25 bp to 4.00% as inflation remains sticky and oil prices are soaring. Will they? The surprise now will be if they leave them unchanged. Canada releases its inflation numbers this week.
Fall is in the air and just around the corner. Have a great week!
DC
* Reference to the Enriched Capital Conservative Growth Strategy and its investments, celebrating an
8.6 - year history of 193% growth (annual 13.33%) to August 31, strong alpha and second August ranking at www.emergingmanagers.ca, is added by Margaret Samuel, President, CEO and Portfolio Manager of Enriched Investing Incorporated, who can be reached at 416-203-3028 or msamuel@enrichedinvesting.com This information should not be construed as an offer, or a solicitation of an offer or sale of any security. Past performance does not guarantee future returns.
"Do you know, we've been taking out millions of barrels of oil? Nobody knows it. You know who doesn't know about it? Iran. Until right now. We took out the other night, 22 ships late at night with no lights, because they don't have any radar, because we blasted the crap out of it."
—Donald Trump, American politician, businessman, media personality, 45th and 47th president of the United States of America, member Republican party, media host of The Apprentice, has been found liable for sexual abuse, defamation, business fraud, 34 felony counts, has been impeached twice, accused of trying to overturn the results of the 2020 election, resulting in the January 6, 2021, attack on the U.S. Capitol; b: 1946
“We import a lot of oil, particularly to eastern Canada, from Saudi Arabia, Kazakhstan, Venezuela, a lot from the U.S. So, if we're looking at how do we phase out fossil fuels in the period in which we're phasing them out, let's only use Canadian.”
—Elizabeth May, Canadian politician, environmentalist, lawyer, activist, author, MP for Saanich-Gulf Islands 2011–present, leader of the Green party, executive director of the Sierra Club Canada (1989–2006), author of Who We Are: Reflections of My Life and Canada; b. 1954
“I flew a full string of 35 combat missions over some of the most heavily defended targets in Europe. We were hitting Hitler's oil refineries, his tank factories, his aircraft factories, his railway yards. Those were our prime targets.”
—George McGovern, American politician, diplomat, historian from South Dakota, congressman South Dakota (1957–1961), senator 1963–1981, member Democratic party, presidential nominee, 1972; 1922–2012
Commodities are the life blood of the global economy. They build the foundation of the economy. Everything we consume requires a commodity: transportation, manufacturing, power. They help determine our cost of living, they power our economic activity, and they drive our technology. Countries that control commodities, whether they be oil, natural gas, wheat, critical minerals, and more, are what drive our economy. When commodities are squeezed, our inflation rises. Commodities don’t grow on trees. You must mine them, extract them, grow them. Some are politically driven, such as oil, while others are limited, even rare, such as critical minerals, copper, and gold. Others are driven by the weather; for example, wheat, soybeans, and corn.
There are numerous indices that track commodities. One of the oldest is the Thompson Reuters Core Commodity Index (CRB). Other well-known ones include the MSCI Commodity Producers Index, the Bloomberg Commodity Index, and the S&P GCSI Index. There are many others, including one in Canada: The Bank of Canada Commodity Price Index (BCPI). Some indices just track certain commodities, such as energy. There are six main sectors: energy, metals, agricultural, industrial, livestock, and electricity. There are broad indices and there are narrow indices, which follow a particular sector. There are numerous commodity ETFs.
Major commodity exchanges include the Chicago Mercantile Exchange (CME) and the Chicago Board of Trade (CBOT), the London Metals Exchange (LME), the New York Mercantile Exchange (NYMEX), the Shanghai Futures Exchange (SHFE), and the Commodity Exchange (COMEX). There are other smaller ones including in Canada the Montreal Exchange (MX) part of the TMX Group that includes the Toronto Stock Exchange (TSX) and the ICE Futures Canada (IFC) which used to be the Winnipeg Commodity Exchange. The most traded commodity in the world is crude oil. But others that do considerable trading include natural gas, gold, copper, silver, aluminum, corn, wheat, soybeans, sugar, coffee, and iron ore.
Crude oil dominates global commodity markets because it is essential for transport, energy production, petrochemicals, manufacturing, and global trade. It is also highly sensitive to economic growth, interest rates, inflation, OPEC+ decisions, supply disruptions, and geopolitical risk. The two main benchmarks are WTI oil and Brent crude. WTI is the benchmark for North American oil while Brent is the benchmark for global oil. Gold may be the one that brings the most attention, while copper is the basis for the global economy, industrial demand, and global growth. On the agricultural side, the most heavily traded and watched is wheat, in addition to corn and soybeans.
We focus on the CRB Index because it covers several of the sectors and is well known. The CRB Index comprises five sectors: agricultural (wheat, corn, soybeans, cotton, sugar, coffee, cocoa, and orange juice are 41% of the index), energy (oil, natural gas, heating oil, gasoline 39% of the index), precious metals (gold, silver 7% of the index), industrial metals (copper, aluminum, nickel 13% of the index), and livestock (cattle, hogs).
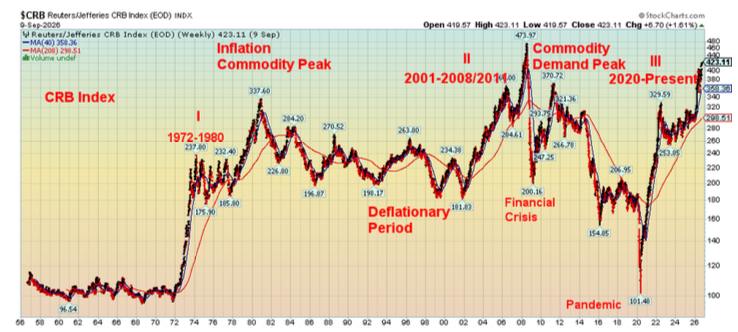
The CRB Index has been around since the mid-1950s. The CRB Index shows the three most recent commodity supercycles. A supercycle is a period whereby commodity prices soar, driven by a number of factors, including demand shocks (shift in trends such as electrification, AI centres), underinvestment (low prices during the lulls means they are not investing in finding and building new mines), supply response (it takes 10–15 years to build a new mine, so that supply lags demand), and geopolitical concerns (wars, trade wars, sanctions all have a negative impact, choking off supply chains).
Since the late 1800s, we have seen these five commodity supercycles:
Key historical supercycles
- Late 1800s–early 1900s: driven by the Industrial Revolution and rapid urban growth in the West, spiking demand for coal, iron, and steel
- 1940s–1960s: triggered by post-World War II reconstruction across Europe and Japan
- 1970s–1980s: fueled by major oil shocks, geopolitical tensions, and inflation
- 1996–2011: propelled by China's explosive industrialization and urbanization boom alongside emerging BRICS economies
- post-2020 (current): driven by the global transition to green energy, limited mining capacity, and surging infrastructure needs for artificial intelligence hardware and data centres, plus geopolitical tensions, war, trade wars, and sanctions
Some have studied commodity prices dating back to ancient times and there too one can find evidence of commodity supercycles. It’s no surprise that many of these supercycles were caused by wars, collapse of empires, and environmental events (famines, disease). Commodity supercycles are as old as the ages. The oldest we’ve seen dates to the emergence of the Bronze Age in the fourth millennium BC.
Our chart of the CRB Index shows three of these cycles quite clearly. The current one hasn’t topped yet. Based on the length of the previous two commodity supercycles, we might not expect this one to top until at least 2030, maybe longer.
CRB Index 1956–2026
Source: www.stockcharts.com
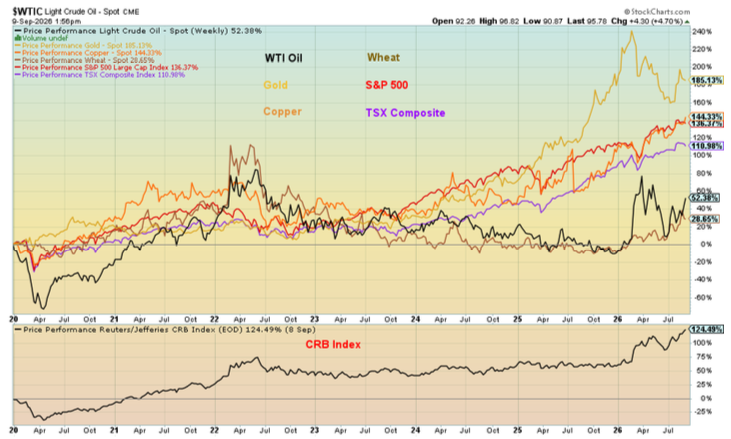
The current commodity supercycle got underway out of the pandemic of 2020. As noted, it hasn’t topped yet. Since 2020, the best performing commodity has been silver, up 277%. Gold follows, up 185%. This compares to the S&P 500, up 136%, and the TSX Composite, up 110%. Despite the recent jump in oil prices, they are, surprisingly, only up 52% since 2020. Gains since 2020 are calculated based on prices December 31, 2019, and not the lows seen in March 2020 during the pandemic.
The commodity bull cycle does not mean that all commodities rise. The commodities with the best chance of rising sharply are those where demand, geopolitics, and disruptions will drive the agenda. Gold is rising because of currency debasement, too much debt, central bank demand, and monetary and geopolitical uncertainty. Oil will rise because of geopolitics and wars, offset somewhat by slowing long-term demand. Silver is both a monetary metal and an industrial metal, needed particularly in semiconductors. Copper has faced underinvestment for years and is now needed in electrification, power grids, and AI data centres. Others include uranium, lithium, natural gas, aluminum, and nickel. Agriculture will be primarily driven by the weather and to a lesser extent by geopolitics, as noted with Ukrainian wheat being blockaded and Russian grain ships being attacked because of the ongoing Russia/Ukraine war. Fertilizers are a key product blocked in the Strait of Hormuz because of the U.S./Iran war.
Price Performance WTI Oil, Gold, Copper, Wheat, S&P 500, TSX Composite, CRB Index 2020–2026
Source: www.stockcharts.com
Three factors have been noted that will drive the current commodity supercycle. They are:
- a pivot to real assets
- demographic shifts
- the global energy transition
The three commodities we focus on the most are gold, oil, and copper. Not to be ignored are silver, uranium, iron ore/steel, lithium, nickel, cobalt, soybeans, corn and wheat, and natural gas. Why the focus on these three? For gold, it’s because of the huge global debt, particularly in the U.S., currency devaluation or debasement, massive money printing by central banks, and now central banks selling U.S. securities and buying gold. For oil, it’s because of its need for transportation and a host of other products. For copper, it’s due to the huge need for EVs, data centres, and renewable energy. However, the others shouldn’t be ignored.
Urbanization is driving the need for food. Hence, the fact that fertilizers that are needed for food production are also at the heart of the wars, sanctions, and blockades in the Middle East because of the Iran war. Climate change and more are driving the need for alternative sources of energy. Underinvestment in copper mines is now driving the price of copper higher as demand soars.
So, are we on the cusp of a commodity supercycle or are we already part way through? Judging by how gold, oil, and copper have soared, it appears that we are at least part way through. But we are nowhere near the top. Previous moves have lasted upwards of a decade. There is nothing on the horizon that suggests this move could be running its course. Note how all three supercycles of the past 75 years have had an initial surge, followed by a sharp correction, then a third surge to the upside. Based on previous up moves, it could suggest that the CRB could double from current levels.
We appear to be in a powerful bull market that is not finished. Gold, oil, and copper will lead the way. But don’t ignore the others.
Price Performance CRB Components 2020–2026
|
CRB Index component |
Percentage gain (loss) % |
|
CRB Index |
124.5% |
|
|
|
|
Agricultural |
|
|
Wheat |
28.7% |
|
Corn |
31.8% |
|
Soybeans |
37.4% |
|
Cotton |
26.1% |
|
Sugar |
37.8% |
|
Coffee |
130.0% |
|
Cocoa |
135.5% |
|
Orange juice |
54.4% |
|
|
|
|
Energy |
|
|
WTI oil |
52.4% |
|
Natural gas |
34.3% |
|
Heating oil |
133.2% |
|
Gasoline |
81.0% |
|
|
|
|
Metals – precious and industrial |
|
|
Gold |
185.1% |
|
Silver |
276.9% |
|
Copper |
144.3% |
|
Aluminum |
84.8% |
|
Nickel |
83.2% |
|
|
|
|
Livestock |
|
|
Feeder cattle |
29.7% |
|
Live cattle |
72.0% |
|
Hogs |
21.2% |
Source: www.stockcharts.com
Note: percentages in bold are the largest in the group.
Chart of the week
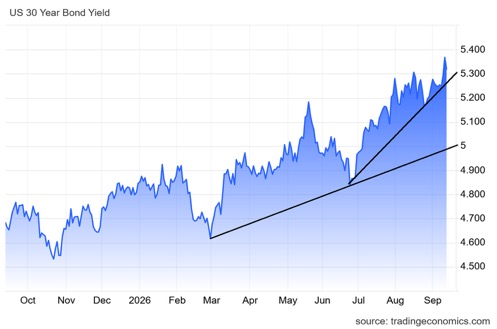
U.S. 30-year Treasury bond yield
Source: www.tradingeconomics.com
“I am the house now. You can bet against me if you want.”
—Scott Bessent, American businessman, financial commentator, government official, currently the 79th U.S. secretary of the treasury, formerly with Soros Fund Management, founder of Key Square Group, a global macro investment firm hedge fund; b. 1962
Like at a casino, the gambler takes all the risk. The casino (the house) can steer the results. In this case, investors take the risk, and the U.S. Treasury can steer the results through intervention; e.g., buying or selling currencies or bonds. Then maybe we should ask him what happened in 1992 when the Soros Fund and others bet against the Bank of England (the house) by building a large short position against the pound sterling. Who won? Why, the Soros Fund, which made roughly £1 billion. Bessent should know, as he was part of the Soros team and played a role in initiating the trade.
So now Bessent is the house. He’s using his power to try and influence the value of the Japanese yen. No, he is not alone as it has been conducted along with the Bank of Japan (BOJ). The U.S. Treasury sold euros to buy yen rather than U.S. dollars. They also set up a repo mechanism with the Fed whereby Japan could borrow U.S. dollars using its U.S. treasury securities as collateral. This would help prevent Japan from selling off any of its $1.1 trillion worth of U.S. securities held.
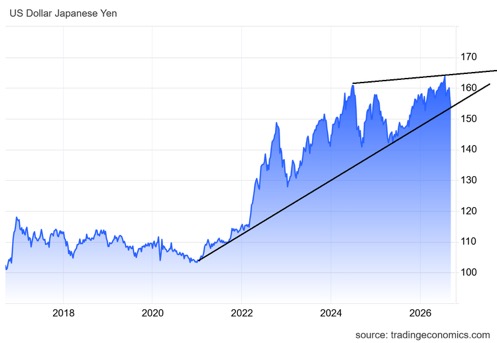
Has it worked? So far, so good. The yen has fallen from about US$1=164 yen to about US$1=153 yen. Bessent’s “I am the house” declaration is intended to scare short sellers of yen to buy them back. Is it working? Time will tell, as right now the yen is at support but a break under 150 could signal further declines. That would put pressure on the yen carry trade where traders might be forced to unwind. The yen carry trade was investors borrowing cheap yen, converting them to U.S. dollars (or another currency), and investing in stocks or bonds in the U.S. (or elsewhere) at a higher yield. The trade works as long as borrowing costs stay low (no longer the case) and the yen stays weak (it is now strengthening).
U.S. Dollar Japanese Yen 2016–2026
Source: www.tradingeconomics.com
Bessent’s second gambit is to try and push long-dated U.S. Treasury rates down. The U.S. treasury market exceeds $32 trillion. Yes, the debt is $40 trillion but roughly $8 trillion is U.S. intragovernmental debt held by agencies rather than the public. Those funds are largely locked and held to maturity. Of the $32 trillion, roughly $5.5 trillion is in longer-dated bonds (20–30 years).
Bessent has been buying about $6 billion of bonds, triple what they might ordinarily buy. It’s Bessent’s version of Operation Twist that was Carried out by the Fed following quantitative easing (QE) as a result of the 2008 financial crisis. So how has that gone? Initially, it pushed rates down, but that brought in sellers who helped push rate rates right back up again. Bessent launched the program on September 9, 2026. The 30-year was trading at 5.29%. Today we are at 5.36% and hit a high of 5.39%, the highest level since 2002.
The program is on shaky ground because the market sees it as manipulation. Instead of buying, they are selling. Of foreign U.S. securities holders, both Japan and China have been sellers over the past year. The slack has been picked up by the U.K., Belgium, and Canada to round out the top five holders. But others, including sovereign wealth funds and hedge funds, are not so tied to U.S. securities that they must continue holding them. By default, Bessent has made himself a player in the market. He’s no different than other players, including hedge funds. And that potentially puts this entire operation at risk. Bessent should have taken a lesson from 1992. The house does not always win.
Markets and Trends
|
|
|
|
% Gains (Losses) Trends |
|
||||
|
|
Close Dec 31/25 |
Close Sep 11/26 |
Week |
YTD |
Daily (Short Term) |
Weekly (Intermediate) |
Monthly (Long Term) |
|
|
|
|
|
|
|
|
|
||
|
S&P 500 |
6,845.50 |
7,756.98 |
(0.8)% |
11.9% |
neutral |
up |
up |
|
|
Dow Jones Industrials |
48,063.29 |
52,573.29 |
(1.6)% |
9.4% |
down |
up |
up |
|
|
Dow Jones Transport |
17,357.19 |
20,628.27 |
(1.8)% |
18.9% |
down |
up |
up |
|
|
NASDAQ |
23,241.99 |
26,333.04 |
(0.7)% |
13.3% |
up (weak) |
up |
up |
|
|
S&P/TSX Composite |
31,712.76 |
35,697.49 |
(2.2)% |
12.6% |
down (weak) |
up |
up |
|
|
S&P/TSX Venture (CDNX) |
987.74 |
927.66 |
(3.9)% |
(6.1)% |
neutral |
down |
up |
|
|
S&P 600 (small) |
1,467.76 |
1,726.18 |
(2.2)% |
17.6% |
down |
up |
up |
|
|
ACWX MSCI World x US |
67.18 |
77.25 (new highs) * |
(1.6)% |
15.0% |
up (weak) |
up |
up |
|
|
Bitcoin |
87,576.98 |
77,424.20 |
(3.0)% |
(11.6)% |
up |
neutral |
neutral |
|
|
|
|
|
|
|
|
|
|
|
|
Gold Mining Stock Indices |
|
|
|
|
|
|
|
|
|
Gold Bugs Index (HUI) |
701.49 |
813.83 |
(2.2)% |
16.0% |
up |
up |
up |
|
|
TSX Gold Index (TGD) |
817.76 |
959.43 |
(1.9)% |
17.3% |
up |
up |
up |
|
|
|
|
|
|
|
|
|
|
|
|
Bonds% |
|
|
|
|
|
|
|
|
|
U.S. 10-Year Treasury Bond yield |
4.17% |
4.98% |
4.0% |
19.4% |
|
|
|
|
|
3.3Cdn. 10-Year Bond CGB yield |
3.44% |
3.94% |
4.2% |
14.5% |
|
|
|
|
|
Recession Watch Spreads |
|
|
|
|
|
|
|
|
|
U.S. 2-year 10-year Treasury spread |
0.69% |
0.34% |
(17.1)% |
(50.1)% |
|
|
|
|
|
Cdn 2-year 10-year CGB spread |
0.85% |
0.58% |
(14.7)% |
(31.8)% |
|
|
|
|
|
|
|
|
|
|
|
|
|
|
|
Currencies |
|
|
|
|
|
|
|
|
|
US$ Index |
98.26 |
99.16 |
flat |
0.9% |
down |
neutral |
neutral |
|
|
Canadian $ |
72.87 |
72.12 |
(0.2)% |
(1.0)% |
up (weak) |
up |
down (weak) |
|
|
Euro |
117.48 |
115.94 |
(0.2)% |
(1.3)% |
up (weak) |
neutral |
up |
|
|
Swiss Franc |
126.21 |
122.47 |
(0.8)% |
(3.0)% |
down |
down |
up |
|
|
British Pound |
134.78 |
135.26 |
0.1% |
0.4% |
neutral |
up |
up |
|
|
Japanese Yen |
63.83 |
65.07 |
1.7% |
1.9% |
up |
up (weak) |
down |
|
|
|
|
|
|
|
|
|
|
|
|
Precious Metals |
|
|
|
|
|
|
|
|
|
Gold |
4,311.97 |
4,348.24 |
(1.8)% |
0.8% |
neutral |
down (weak) |
up |
|
|
Silver |
71.16 |
64.40 |
(2.7)% |
(9.5)% |
neutral |
down |
up |
|
|
Platinum |
2,046.90 |
1,800.50 |
(1.5)% |
(12.0)% |
up (weak) |
down (weak) |
up |
|
|
|
|
|
|
|
|
|
|
|
|
Base Metals |
|
|
|
|
|
|
|
|
|
Palladium |
1,619.50 |
1,315.00 |
(6.3)% |
(18.9)% |
up |
down |
up (weak) |
|
|
Copper |
5.64 |
6.47 (new highs) * |
(1.7)% |
14.7% |
down (weak) |
up |
up |
|
|
|
|
|
|
|
|
|
|
|
|
Energy |
|
|
|
|
|
|
|
|
|
WTI Oil |
57.44 |
100.41 |
10.2% |
74.8% |
up |
up |
up |
|
|
Nat Gas |
3.71 |
2.82 |
(4.1)% |
(24.0)% |
neutral |
down |
down (weak) |
|
Source: www.stockcharts.com
* New All-Time Highs
Note: for an explanation of the trends, refer to the glossary at the end of this article.
New highs/lows refer to new 52-week highs/lows and, in some cases, all-time highs.
Stocks
Source: www.stockcharts.com
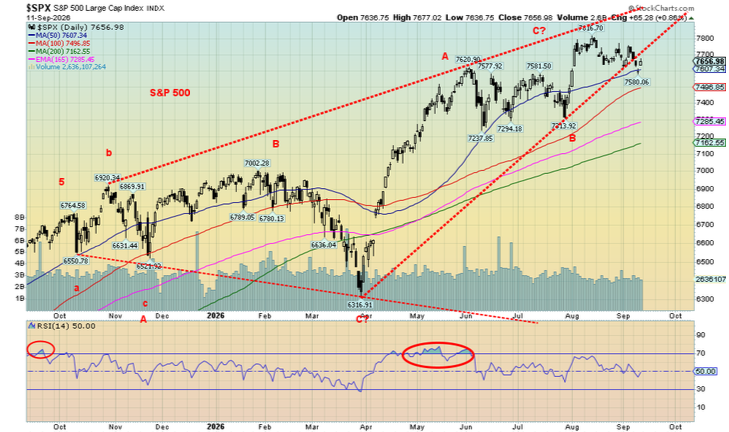
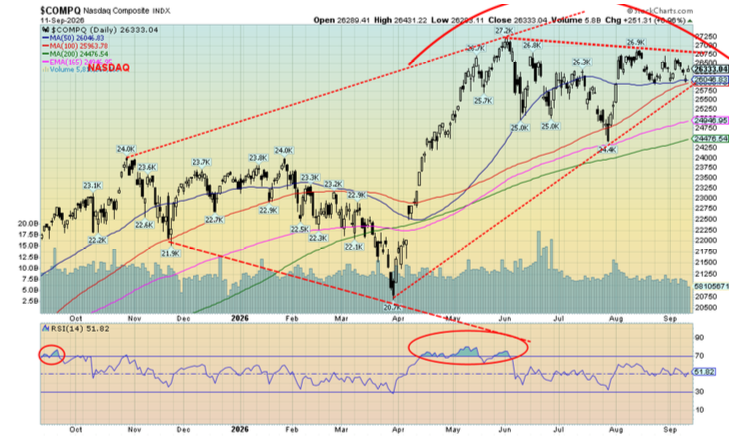
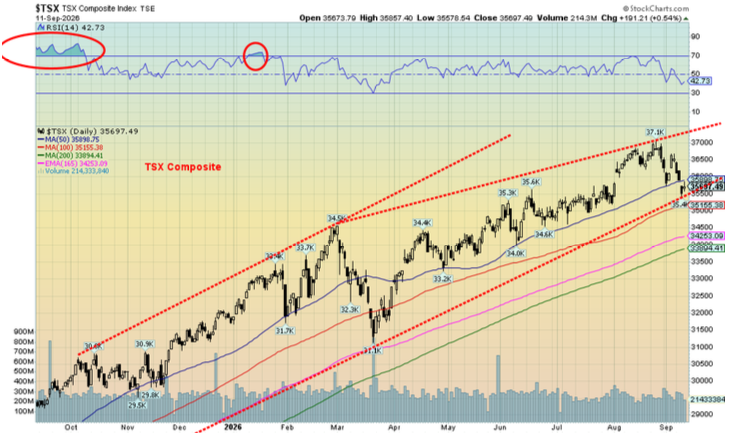
Are we topping for good now? It’s possible, but we still don’t have an official sell signal. Yes, the S&P 500 broke under what looks like an ascending wedge triangle this past week, but we didn’t tank as we should have. So, the market stays alive. The NASDAQ looks increasingly toppish while the TSX Composite also looks increasingly toppish. So far, despite the wars, the political divisions, and rising interest rates, the stock market is off its highs but has yet to break down. However, we’re getting closer even as we can’t rule out new highs yet.
This past week, the S&P 500 fell 0.8%, the Dow Jones Industrials (DJI) was off 1.6%, the Dow Jones Transportations (DJT) fell 1.8%, and the NASDAQ dropped 0.7%. The S&P 400 (Mid) dropped 1.9% and the S&P 600 (Small) was off 2.2%. The S&P 500 Equal Weight Index fell 1.9% and the NY FANG Index dropped 0.7%. Bitcoin fell 3.0%.
In Canada, the TSX Composite fell 2.2% while the TSX Venture Exchange (CDNX) dropped 3.9%. In the EU, the London FTSE was down 1.6%, the EuroNext fell 0.5%, the Paris CAC 40 was down 1.2%, and the German DAX fell 1.8%. In Asia, China’s Shanghai Index (SSEC) fell 1.1%, the Tokyo Nikkei Dow (TKN) dropped 1.6%, Hong Kong’s Hang Seng (HSI) fell 3.3%, while India’s Nifty Fifty fell 2.1%. The MSCI World ex USA Index ETF was down 1.6% after making new all-time highs. A reversal?
Individually, three of the MAG7 were up, three were down, and one, Google, was flat. Meta was up 5.1%, while Nvidia was down 5.2%. MAGS the MAG7 ETF was up 0.7%. The big winner for the techs was Advanced Micro (AMD), up 8.1%, while Baidu dropped 8.2%.
Source: www.stockcharts.com
In Canada, only one of the 14 sub-indices was up: Energy (TEN), gaining 0.9% to new all-time highs. Leading the downward party was Consumer Discretionary (TCD), down 4.9%.
The S&P 500 breaks down under 7,300 and especially under 7,100. Under 7,000 we enter correction territory and under 6,200 we’re looking at an official bear market. The NASDAQ also appears to be forming a wedge. The NASDAQ breaks under 25,750 but breaks more so under 24,400. The TSX is hanging above a breakdown under 35,500, but we wouldn’t consider the TSX really breaking down until under 34,000.
New highs all around would end any discussions about a breakdown. But we note that the negative divergences for the daily and weekly charts are growing, although we don’t yet see them in the monthlies. That the stock markets are holding together shows the strength in the market, especially given record earnings. Many have expected the market to tank, but so far, they’ve been disappointed. What will this week’s FOMC bring? Especially if the Fed hikes rates as the consensus seems to be.
Source: www.stockcharts.com
Bonds
Source: www.tradingeconomics.com, www.home.treasury.gov, www.bankofcanada.ca
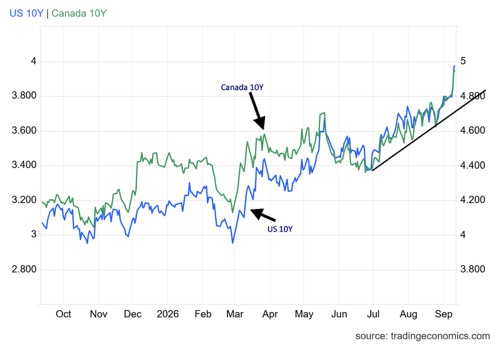
In looking at this chart, what can we say about bond yields? They are going up and appear to be poised to go even higher. Inflation remains firm, as noted by the release of the August CPI and PPI (the CPI follows). The market is also becoming increasingly concerned about the actions of Scott Bessent, the U.S. treasury secretary, and his intervention in the Japanese yen market, as well as his intervention in the treasury bond market with his attempts to buy back long-dated U.S. treasuries. He buys $2 billion one day, $4 billion the next, and $12 billion the day after that. But it’s a problem.
The war in the Middle East continues. Japan and China are dumping treasuries. Some recent figures suggest Japan unloaded some $95 billion in August. If that’s correct, it’s the biggest dump ever by Japan. With Japan, China, and sovereign wealth funds dumping treasuries, who’s buying? Well, other central banks and possibly even the Fed itself. Dumping U.S. treasuries is bearish for interest rates, but it’s a contest with the U.S.
Treasury that wants to buy. However, they offset each other – the market is nervous and rates go up, not down, as Bessent (and Trump) want.
This past week the U.S. 10-year Treasury rose from 4.79% to 4.98%. The 2-year went from 4.37% to 4.68% and the 30-year rose from 5.25% to 5.36%. We approach the danger zone for the 10-year at 5%. Canada wasn’t immune as its 10-year Government of Canada bond (CGB) rose from 3.78% to 3.94%. The ECB hiked interest rates by 25 bp this past week. Now the consensus is that the Fed will hike 25 bp this week. The surprise now would be to stand still.
All that is leaning into interest payments for all countries but specifically the U.S. and Japan. In the U.S., interest payments on the debt already exceed $1 trillion while in Japan they have now leaped over US$100 billion after converting the yen. Bond holders are getting nervous.
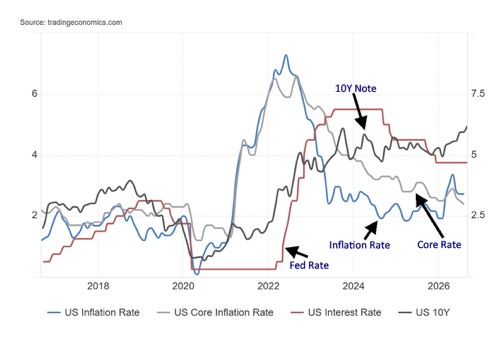
U.S. Inflation Rate, Core Rate, Fed Rate, 10-year note – 2016–2026
Source: www.tradingeconomics.com, www.bls.gov, www.federalreserve.gov
The August inflation rate came in as expected, up 3.4% year over year. The core rate eased slightly to 2.4% from 2.5%. A rise in gasoline prices was a driver. Apparently, inflation eased somewhat for shelter and food. That the rate didn’t change was calming to the markets that saw both stocks and gold rise, even as oil prices eased on Friday. Still, inflation remains sticky and will continue to leave the Fed in a quandary as to what they do this coming Wednesday at the FOMC meeting. Surprisingly, the consensus seems to be that the Fed will hike, raising the rate to 4% from 3.75%. It ought to make for an interesting week. The 10-year has been rising, as noted.
We do note that the ECB did raise rates this past week by 25 bp. They cited higher inflation and the ongoing war with Iran that is spiking oil prices. It was the second time this year they raised rates. Will that influence the Fed to follow?
Gold and silver
Source: www.stockcharts.com
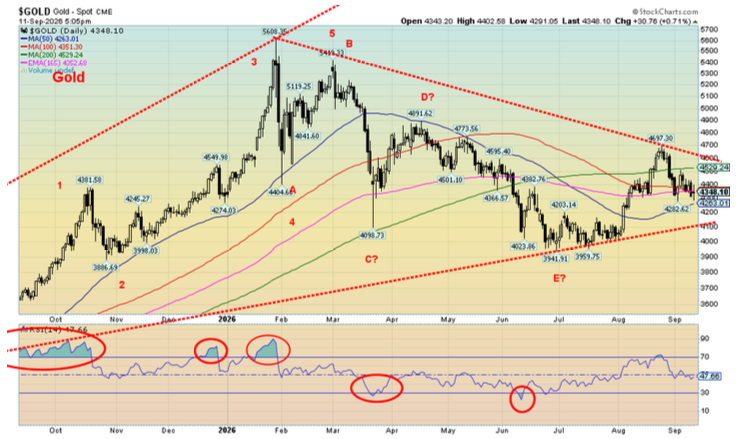
It’s probably discouraging as to why gold prices do not appear to be rising, even as the geopolitical picture worsens, inflation is still present, domestic politics are deeply divisive and debts and fiscal deficits are mind-boggling. Yet here we are at around $4,350, well off the January 2026 high of $5,608. A correction was overdue given that gold rose from that 2022 low gold rose almost 250%. The last leg from May 2025 saw gold rise 74%.
Now we are some 22.5% below that January 2026 high.
Fear of rising interest rates has hurt gold. Gold doesn’t pay interest. The U.S. 10-year Treasury note rose from 4.14% in January 2026 to 4.97% today. The benchmark 2-year Treasury note rose from 3.50% to 4.63%. U.S. inflation is at 3.40%. A stronger US$ Index through 2026 has also hurt gold prices. Investors get a real yield on notes and bonds vs. inflation. That the Fed might tighten by hiking interest rates also doesn’t help.
The result was that from January to July gold prices were weak. Despite the recent rebound, we have now pulled back from the recent high at $4,697. Gold appeared to be on the cusp of breaking out, but the gains have not held and we have pulled back. As long as we can stay above $4,200, we should be okay. Below $4,100 suggests we could see new lows below $3,940.
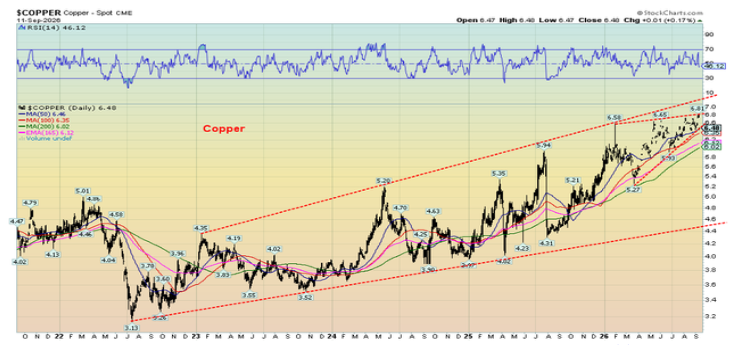
This past week gold fell 1.8%, silver dropped 2.7%, and platinum fell 1.5%. Of the industrial metals and near precious metals, palladium fell 6.3% while copper made new highs, then turned tail and closed down 1.7%. Copper fell because of threats by the Trump administration to put tariffs on copper. Copper prices are up 107% from a low in 2022. The huge needs for copper, coupled with underinvestment when prices were low, ensures copper prices should keep climbing. However, this is a setback. Trump tariffs that were threatened were pulled back so we await to see if copper prices rebound.
Copper is in a strong uptrend. There have been some sharp pullbacks along the way since 2022. Concerning is what appears as a wedge triangle forming. Wedge triangles are normally bearish. Breakdown occurs under $6.40. We do appear to be late in the triangle, so it is possible we will just waffle out. New highs would end any discussion of a breakdown.
Source: www.stockcharts.com
Source: www.stockcharts.com
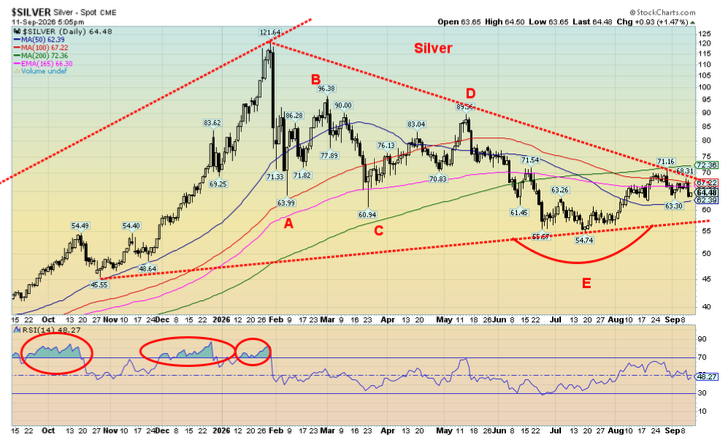
The silver chart continues to look bullish. We may have completed a five-wave decline from the January high in an ABCDE type of pattern. As with gold, we can’t tell whether the recent run-up is the start of new bull or a correction to the downtrend. Only moves above gold $5,200 and silver over $106 would suggest new highs ahead. We have some work to do. That copper has been a leader is positive as strong moves in copper often precede a strong move up in gold.
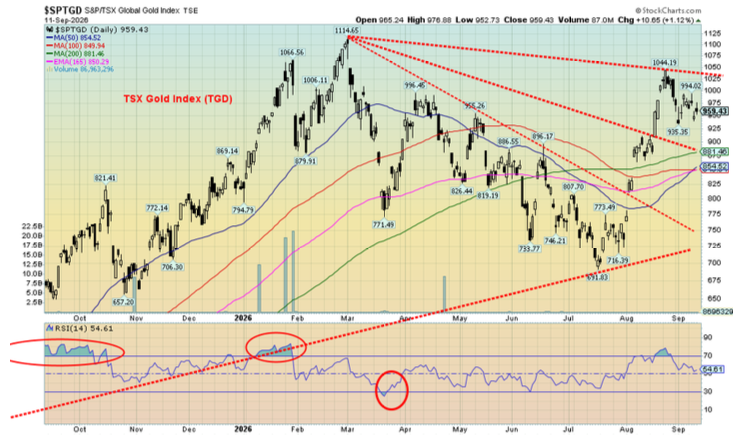
The gold stocks have continued to be good performers despite the recent pullback. They appear to be leading the way. This past week the Gold Bugs Index (HUI) was down 2.2% while the TSX Gold Index (TGD) was off 1.9%. Still, the two are up 16.0% and 17.3% respectively in 2026. That outpaced gold, up 0.8% and silver, down 9.5% so far this year.
The TGD has good support down to around 880. A breakout above what appears to be a fan pattern above 1044 would be positive and project much higher. We’d be concerned if we broke under 850. The juniors also suffered a bit of a pullback this past week as the TSX Venture Exchange (CDNX) fell 3.9%. Roughly half of the CDNX is made up of junior mining companies, mostly gold mining.
Overall, we remain positive and bullish for the precious metals sector. However, our next big move may not be seen until 2027. With the FOMC meeting this week on September 16, the expectation now is for a hike in interest rates. The surprise now would be that the Fed does nothing. That would be bullish for gold.
Source: www.stockcharts.com
Oil and gas
Source: www.stockcharts.com
Oil prices are on the move upward once again. That’s thanks to the Houthis, a group out of Northern Yemen that controls large parts of the country, including the capital Sanaa. They launched a regional war following the outbreak of the Israel-Gaza war and elevated it following the invasion of Iran by the U.S. and Israel. While attacking shipping through the Red Sea, they also largely control the Bab-el-Mandab Strait between Yemen and Djibouti that links the Red Sea with the Gulf of Aden. More recently they have seized control of the port city of Mocha on the Red Sea and Perim Island, a volcanic island in the Bab-el-Mandab Strait.
Their primary target has been Saudi Arabia, the world’s third largest oil producer and holding the world’s second largest reserves, behind Venezuela. The Houthis have targeted Saudi oil refineries and also the East-West Pipeline that carries crude oil from Saudi Arabia’s eastern oilfields to the Red Sea, thus not having to go through the Strait of Hormuz. As a result, the Saudis have at least temporarily shut down the East-West Pipeline that normally shipped 2-3 million barrels/day. The Bab-el-Mandab Strait is one of the world’s important maritime choke points. Other key choke points include the Strait of Hormuz, the Suez Canal, the Strait of Malacca, the Panama Canal, and the Turkish Straits (Bosphorus, Dardanelles). The Bab-el-Mandab Strait carries roughly 12% of global trade along with millions of barrels of oil daily. By extension it is also negatively impacting the Suez Canal, a vital route to connect Europe and Asia without having to go around the horn of Africa.
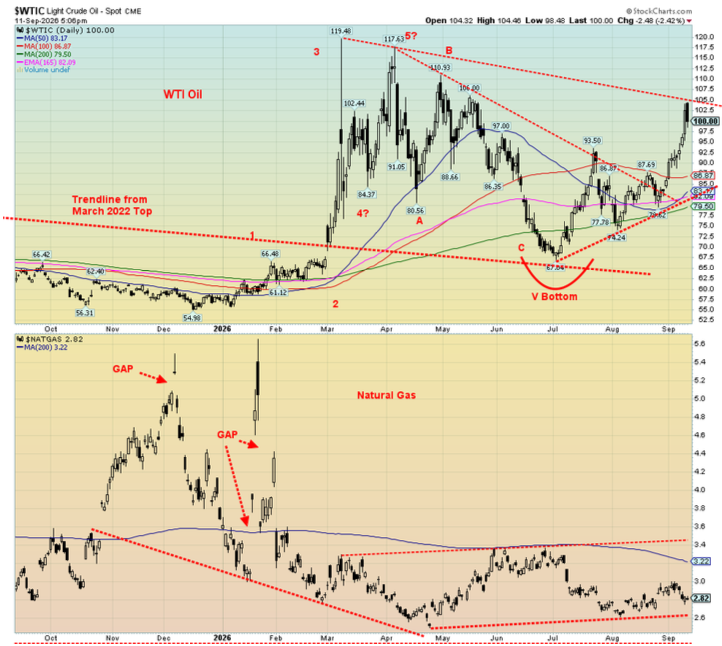
Many have tried to downplay the negative impact of the Houthis controlling the Bab-el-Mandab Strait. Also, OPEC is showing that demand should fall into 2027. That could help soften the price rise for oil. And rise it did this past week with WTI oil jumping over $100 up 10.2% on the week and Brent crude gaining 9.3% and over $105.
Not to be outdone was natural gas (NG) at the EU Dutch Hub that jumped 10% on the week to $80. The Henry Hub NG is North America is not as impacted by the goings-on in the Middle East, and it actually fell 4.1% this past week. The energy stocks responded with both indices reaching all-time highs. The ARCA Oil & Gas Index (XOI) was up 3% this past week while the TSX Energy Index (TEN) gained 0.9%. The EU Dutch Hub price is jumping because of concerns that the Ukraine’s attacks on Russian LNG facilities will impact supply. And as well the EU gets a significant amount of its NG from Qatar, which is negatively impacted by the closure of the Strait of Hormuz. Supplies could be tight going into the winter.
Breaking $100 for WTI was important as it signals we should now make an assault on the major breakout point above $105. Once over $105, our targets become $150/$160. We still have not made new highs for the move. That was seen shortly after the U.S./Israel invasion of Iran when WTI reached $119. Above $107 new highs are probable.
U.S. commercial stocks continue to drag along five-year lows and need replenishing. Gasoline stocks have improved. Saudi Arabia production has fallen to levels last seen in 1990, highlighting the pressure on oil prices. As well, the Saudis claim the drones that hit the East-West Pipeline came from Iraq. If that’s correct, the war may be expanding into another area. Iraq is caught between Iran, and the U.S. Iraq energy infrastructure has been attacked by Iran and now it is alleged that Iraq attacked the Saudis.
The war is expanding. A rise to new all-time highs over $147 would not be surprising. On an inflation-adjusted basis, oil prices would have to reach $225 to equal that 2008 high. Everyone might want to consider filling up now.
Copyright David Chapman 2026
GLOSSARY
Trends
Daily – Short-term trend (For swing traders)
Weekly – Intermediate-term trend (For long-term trend followers)
Monthly – Long-term secular trend (For long-term trend followers)
Up – The trend is up.
Down – The trend is down
Neutral – Indicators are mostly neutral. A trend change might be in the offing.
Weak – The trend is still up or down but it is weakening. It is also a sign that the trend might change.
Topping – Indicators are suggesting that while the trend remains up there are considerable signs that suggest that the market is topping.
Bottoming – Indicators are suggesting that while the trend is down there are considerable signs that suggest that the market is bottoming.
Disclaimer
David Chapman is not a registered advisory service and is not an exempt market dealer (EMD) nor a licensed financial advisor. He does not and cannot give individualised market advice. David Chapman has worked in the financial industry for over 40 years including large financial corporations, banks, and investment dealers. The information in this newsletter is intended only for informational and educational purposes. It should not be construed as an offer, a solicitation of an offer or sale of any security. Every effort is made to provide accurate and complete information. However, we cannot guarantee that there will be no errors. We make no claims, promises or guarantees about the accuracy, completeness, or adequacy of the contents of this commentary and expressly disclaim liability for errors and omissions in the contents of this commentary. David Chapman will always use his best efforts to ensure the accuracy and timeliness of all information. The reader assumes all risk when trading in securities and David Chapman advises consulting a licensed professional financial advisor or portfolio manager such as Enriched Investing Incorporated before proceeding with any trade or idea presented in this newsletter. David Chapman may own shares in companies mentioned in this newsletter. Before making an investment, prospective investors should review each security’s offering documents which summarize the objectives, fees, expenses and associated risks. Although Artificial Intelligence (AI) may be deployed from time to time, AI output is monitored and adjusted, if necessary, for accuracy. David Chapman shares his ideas and opinions for informational and educational purposes only and expects the reader to perform due diligence before considering a position in any security. That includes consulting with your own licensed professional financial advisor such as Enriched Investing Incorporated. Performance is not guaranteed, values change frequently, and past performance may not be repeated.
About the author


Website: https://www.enrichedinvesting.com
Disclaimer: David Chapman is not a registered advisory service and is not an exempt market dealer (EMD) nor a licensed financial advisor. We do not and cannot give individualised market advice. David Chapman has worked in the financial industry for over 40 years including large financial corporations, banks, and investment dealers. The information in this newsletter is intended only for informational and educational purposes. It should not be considered a solicitation of an offer or sale of any security. The reader assumes all risk when trading in securities and David Chapman advises consulting a licensed professional financial advisor before proceeding with any trade or idea presented in this newsletter. David Chapman may own shares in companies mentioned in this newsletter. We share our ideas and opinions for informational and educational purposes only and expect the reader to perform due diligence before considering a position in any security. That includes consulting with your own licensed professional financial advisor.