
U.S. job numbers surprised to the upside while Canadian job numbers fell. The job numbers are the subject of our chart of the week. Despite the surprise gain in the U.S., underlying developments suggest the situation is not as rosy as it appears.
We can't help avoiding talking about the debt. It's just too large. Yet to date, we have not experienced a financial crisis. That's not to say one might not happen, but with bond yields rising everywhere, a financial crisis might be closer than we think. President Trump continues to berate Fed Chairman Kevin Warsh to cut interest rates. He's even suggested the rather bizarre idea that if they do not cut interest rates, the U.S. will cut off all trade with nations where the U.S. is running a deficit. That includes China, Mexico, and Canada. Many others.
This past week, the stock market waffled, bond yields rose, gold wavered, and oil moved higher. Rising bond yields and rising oil prices are not a good sign. We believe that gold wavering is temporary, as a correction of the recent up move is underway. Nonetheless, gold continues to look poised for a move higher. This is likely to positively impact gold companies such as Kinross Gold Corporation that reported increased earnings and cash flow, pays a dividend, and is held in the Enriched Capital Conservative Growth Strategy.* Oh yes, and the wars continue with no signs of an end.
Monday is Labour Day, and markets are closed. But after Labour Day, activity in the stock market usually picks up. The Fed meets September 15-16 for its interest rate decision, and the FOMC is rather split between hawks and doves. Our expectation is that they will do nothing.
Enjoy the Labour Day holiday. Have a great week!
DC
* Reference to the Enriched Capital Conservative Growth Strategy and its investments, celebrating an
8.5 - year history of 208% growth (annual 14.16%) to July 31, strong alpha and top July ranking at www.emergingmanagers.ca, is added by Margaret Samuel, President, CEO and Portfolio Manager of Enriched Investing Incorporated, who can be reached at 416-203-3028 or msamuel@enrichedinvesting.com This information should not be construed as an offer, or a solicitation of an offer or sale of any security. Past performance does not guarantee future returns.
“We have to rethink our whole energy approach, which is hard to do because we're so dependent on oil, not just for fuel but also plastic. If plastic vanished, there would be total chaos. We have to think quite carefully about using oil and its derivatives, because it's not going to be around forever.”
—Margaret Atwood, Canadian novelist, poet, literary critic, inventor, author of The Handmaid’s Tale and many other books, some of which were made into films; b. 1939
“I think there are more politicians in favor of electric cars than against. There are still some that are against, and I think the reasoning for that varies depending on the person, but in some cases, they just don't believe in climate change - they think oil will last forever.”
—Elon Musk, South African/American businessman, public official, CEO and largest shareholder of Tesla and SpaceX, also X (formerly Twitter), wealthiest person in the world, estimated at $864 billion; b. 1971
“Delayed energy projects and regulatory hurdles to domestic oil production not only cost the United States economy billions of dollars and millions of jobs, but they also stand in the way of an elusive goal: true American energy security.”
—John Hoeven, American banker and politician, U.S. senator North Dakota,
Republican Party 2011–present, Governor North Dakota (2000–2010); b. 1957
We are seeing an increasing number of articles in the financial news of numerous publications warning about the rising dangers in the bond market. No wonder. Rising debt, tariff wars, oil wars, droughts, floods, and supply disruptions all contribute to not only rising debt, rising inflation and falling bond prices (rising yields as yields move inversely to prices). Have we passed the point of no return that could launch us into a financial crisis?
That’s a hard question to answer. It’s not as if we haven’t seen this picture before. Historically, bond yields have spiked during periods of war. Looking back over the past 200 years, we saw spikes during the War of 1812–14, the U.S. Civil War (1861), the post-World War I spike into 1920, and even a spike during the Great Depression into 1932. The biggest one of all actually got underway in 1941 during World War II and, over the years, bond yields didn’t stop rising until they peaked in 1981 following the inflationary/stagflationary 1970s. Since then, we witnessed bond mini panics of various degrees in 1987, 1994, 2000, 2007, and 2022. However, surprisingly, none of them were outright the cause of a financial crisis. However, we note recessions did follow the 1981 peak, the 2000 peak and the 2007 peak. Slowdowns were seen during the other periods.
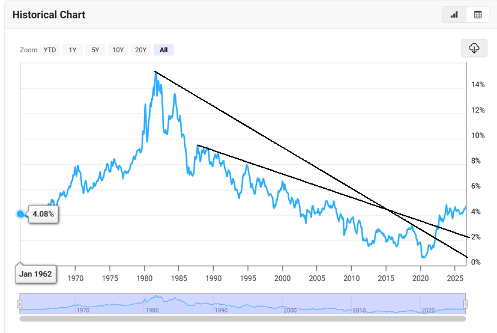
As our chart of the U.S. 10-year Treasury note from 1962 shows, we have firmly broken out to the upside, ending the long down trend of 1981–2020. In 2023, the 10-year yield peaked at around 4.92%. We bottomed out in 2020 near 0.70%. Currently, we are closing in on 4.80%, although that bounces around. Should we be concerned?
10-year U.S. Treasury Note Yield 1962–2026
Source: www.macrotrends.net
Risks are definitely increasing. But the rising bond yield does not necessarily suggest that a financial crisis could follow. Rising debt levels do pose a significant problem as interest payments on the debt rise, potentially to unsustainable levels. As we have noted, U.S. interest payments on its $40.1 trillion of government debt now exceed $1.1 trillion, representing almost 3.4% of GDP. That exceeds the previous peak set in 1991. Not even in wartime did it approach current levels. Not surprisingly, the U.S.’s interest payments as a percentage of GDP are the highest in the G7.
So, is this dangerous? Yes, it could be. But other things need to happen. Particularly if there is forced selling or funding problems. So far, while yields are rising, treasury auctions have not yet yielded a panic. The U.S. treasury market is the largest and most liquid in the world. Given that the U.S. dollar is the world’s reserve currency, central banks around the world hold U.S. treasuries as reserves. Today, roughly 57% of central bank reserves are held in U.S. treasuries. But if we include gold holdings, that number falls to 40% while gold represents some 25% of reserves. The rest is in euros, Japanese yen, Chinese renminbi, SDRs (special drawing rights), and IMF reserve positions, along with a smattering of other currencies such as the Canadian dollar. Gold has been a growing position for central banks, with many converting their U.S. treasury holdings to gold.
The worry position is in who holds U.S. treasuries: central banks, private banks, insurance companies, pension funds, ETFs, hedge funds, mutual funds, state and local governments, government trust funds, sovereign wealth funds, money-market funds, the Federal reserve, Family offices and individual households. Of that group, hedge funds could be a problem in a panic situation as they are usually highly leveraged, which would mean forced selling. But most would not be forced out of their positions. The worry comes as corporations and others also issue debt that is priced off U.S. treasuries (or in Canada’s case Canadian government bonds). The issue becomes credit worthiness.
The U.S. has faced downgrades. The U.S. is currently AA+ (S&P). Only a handful of countries maintain an AAA credit rating, including Denmark, Germany, Luxemburg, Norway, Lichenstein, Switzerland, Sweden, Singapore, Australia, and Canada. Countries like Cuba, Venezuela, Ukraine, Lebanon, and Belarus are essentially bankrupt. Many others are junk. (Anybody rated below BBB is considered junk.) Spreads are widening between U.S. treasuries and other credits, particularly CCC and lower.
The bottom line: there is no single interest-rate level that would automatically trigger a bond panic. Rising rates do not necessarily prevent refinancing, as long as borrowers can still access funding. The greater concern is a sovereign debt default. But by whom? Probably not a G7 country although a few of them are on shaky financial ground. Italy is the lowest-rated G7 member at BBB+.
China is rated A+, while Russia is unrated. Of the G7 countries, the most vulnerable to a crisis are France (A+), Italy (BBB+), Japan (A+) and the U.K. (AA). A crisis in any of those countries would have global ramifications. Could it happen? Yes. But will it? Otherwise, others we see mentioned include Egypt and Pakistan. Both Egypt and Pakistan carry a B credit rating which effectively means their debt is junk.
Could another financial crisis on the scale of the 2008 financial crisis spark a bigger collapse? A major shock could disrupt, causing a loss of confidence. Bond prices would fall, leveraged investors could be forced out, short-term funding could be unreliable, credit could seize up so that no one can borrow, and bank losses could pile up, sparking bank runs and bank failures. We saw all that during the 2008 financial crisis. But the Fed and other central banks have numerous tools they can use to stem a crisis. No, that won’t stop failures or prevent all investment losses, as we could also face a stock market collapse or a currency crisis, but it can be dealt with. However, the situation is getting considerably harder to deal with. For financial institutions, the biggest problem would be that their capital is wiped out. That’s a bigger issue than a shortage of cash, as cash shortages could be bridged by the central banks.
It may seem like a small thing, but a large share of the U.S. debt is intragovernmental with no direct impact on the supply of U.S. treasuries. That amount is roughly $8 trillion. The debt is held by internal trust funds and agencies such Social Security, Medicare trust funds, and federal employee retirement funds. Take that out and the debt to GDP falls to around 97%. Surprisingly, debt to GDP for households and corporations is below levels seen during the Great Recession.
One thing often talked about is revaluing gold to back the debt. A revaluation could help, but it won’t resolve everything. Currently, the U.S. holds its 261.5 million ounces of gold on its books at the ridiculously low price of $42.22/ounce or about $11 billion. But U.S. debt is $40.1 trillion. Even with gold at $20,000, it would only cover just over 5% of the U.S. debt. Revaluation could be helpful, but it wouldn’t necessarily solve everything. A gold standard has been tried numerous times since the last one ended in August 1971. Banks hated it as it was a constraint on their operations.
Notably, a revaluation of gold upward would result in a devaluation of the U.S. dollar. We saw that in 1934 when, at the height of the Great Depression, gold was revalued up to $35/ounce from $20.67/ounce. The U.S. dollar instantly fell. It was a 69.3% price increase for gold and a 40.9% devaluation of the U.S. dollar. The U.S.
dollar has been devaluing since the creation of the Federal Reserve in 1913. Back then, US$1,000 bought 48.4 ounces of gold. Today that same US$1,000 buys less than 0.25 ounce of gold.
We put together this table of economic indicators to show the current state of things. Our conclusion is growth is slowing, government debt to GDP is too high but has not yet sparked a crisis, consumer confidence is waning (some are negative but all that means is they expect their consumption to decline from the previous year), manufacturing PMI is above 50 (mostly), indicating we are not in a recession, inflation remains sticky, and unemployment may be rising a bit but is not yet at crisis levels.
Key Economic Indicators for G7 Countries plus China, Russia, India
|
G7 country |
GDP Q2 growth % |
GDP annual growth |
Government debt/GDP |
Consumer confidence |
Manufacturing PMI |
Inflation Y-O-Y |
Un- employ-ment rate |
10-year bond yield |
|
U.S. |
1.5% |
2.1% |
123% |
51.7% |
53.9 |
3.4% |
4.1% |
4.79% |
|
Japan |
0.3% |
0.7% |
249% |
35.5% |
54.9 |
1.9% |
2.4% |
3.00% |
|
Germany |
0.3% |
1.0% |
63.5% |
(26.6)% |
54.3 |
2.9% |
6.4% |
3.37% |
|
U.K. |
0.4% |
1.2% |
94.3% |
(14.0)% |
51.7 |
2.9% |
4.9% |
5.25% |
|
Italy |
0.2% |
1.0% |
137% |
94.5% |
49.6 |
3.3% |
5.8% |
4.20% |
|
France |
0% |
0.7% |
116% |
86.0% |
51.1 |
2.4% |
8.3% |
4.21% |
|
Canada |
0.8% |
1.1% |
114% * |
49.4% |
53.0 |
3.0% |
6.4% |
3.75% |
|
China |
0.9% |
4.3% |
99.2% |
89.9% |
51.5 |
0.5% |
5.2% |
1.68% |
|
Russia |
NA |
1.3% |
18.3% |
(13.0)% |
48.8 |
6.0% |
2.2% |
16.0% |
|
India |
1.9% |
7.8% |
81.9% |
88.3% |
52.9 |
4.5% |
5.1% |
6.96% |
Source: www.tradingeconomics.com
Note: bold indicates the highest
Note: Canada debt/GDP includes provinces
Note: each country calculates unemployment differently, so the rates are not easily comparable
Bond yields are rising. It’s a problem as borrowing becomes more expensive. It’s a major tightening of financial conditions. Debt is rising at an unsustainable pace. The U.S. dollar is falling doing the opposite to what one might think it should do when bond yields are rising. The Fed is caught between a rock and a hard place as to whether it should hike rates or stay the course. Even Tiff Macklem, the governor of the Bank of Canada, has expressed concern about inflation. They left rates unchanged at their interest rate meeting this past week, but Macklem hinted that might not be the case the next time.
The FOMC meets on September 15–16 and from what we can read the committee appears divided. The debt only becomes more dangerous if it triggers forced selling or funding problems, or if the bond vigilantes decide to take down the market. So far, that is not the case. Currently, the risk of a bond crisis is high but manageable. But for how long?
Chart of the week
U.S. job numbers
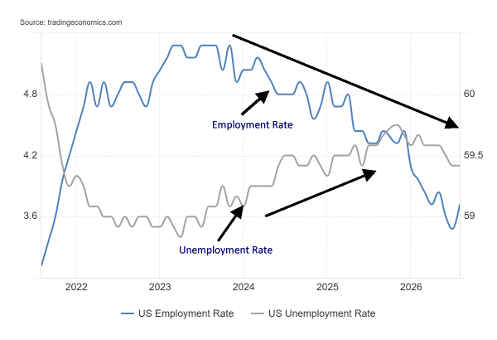
Employment Rate, Unemployment Rate 2021–2026
Source: www.tradingeconomics.com, www.bls.gov
Is the U.S. experiencing an employment boom? The August nonfarm payrolls surprised to the upside with a gain of 162,000, far more than the expected 56,000. They revised the July nonfarm from down 23,000 to up
21,000. The gain thus far in 2026 is 643,000. For comparison’s sake, the gain for the same period in 2025 was 161,000. It was the strongest job gains in five months. So is the labour market doing far better than expected?
Gains were primarily seen in hospitality and leisure, some in manufacturing, education, and health care with losses in information technology as AI companies shed jobs. The strong gain puts the Fed in a bind for its upcoming September 15–16 FOMC. The odds of a rate cut are fading while the odds of a rate hike are rising. That hasn’t stopped President Trump from demanding that Fed Chair Kevin Warsh cut interest rates. His demands are getting louder. President Trump has even gone as far as threatening that if the Fed doesn’t cut rates, he’ll cut off all trade with countries that the U.S. is running deficits with. That would include China, Mexico and Canada amongst many others. Course it makes no sense.
The civilian labour force jumped by 683,000, but it doesn’t hide the fact that since November 2025 the civilian labour force has fallen by 1,764,000. Deportations? The employment level rose by 569,000, but again it doesn’t hide the fact that the employment level has fallen 1,246,000 since December 2025. The unemployment level rose 175,000 but is down 750,000 since November 2025. Full-time employment rose 735,000 while part-time employment fell 223,000. Full-time employment is down 1,610,000 since January 2025 while part-time employment is down 911,000 since November 2025. So, is the glass half full, or half empty?
The not in labour force category rose 590,000. And it’s up an astounding 6,446,000 since a low in July 2024. The not in labour force category is made up of retirees, those with disabilities, full-time students, stay-at-home mothers, plus others. However, there is also the category of those considered not in the labour force, but who want a job now. That category fell 123,000 in August but is up 226,000 since a low in August 2024. The number of multiple job holders jumped 112,000 but is down 738,000 since November 2025.
The unemployment rate (U3) held steady at 4.1%. However, the U6 unemployment (total unemployed, plus all persons marginally attached to the labour force, plus total employed part-time for economic reasons, as a percent of the civilian labour force, plus all persons marginally attached to the labour force) fell from 7.9% to 7.7%. The employment population ratio rose 0.2% while the labour force participation rate also rose 0.2% to 61.6%. That suggests a higher percentage of the population is working. Makes sense since the civilian labour has fallen. The number unemployed 27 weeks or longer rose 144,000 while the average weeks unemployed jumped to 26.3 from 24.9 and the median number of weeks unemployed rose to 11.3 weeks from 9.5 weeks. The total population level, from which the labour force is drawn, rose by a small 133,000.
The larger than expected gain puts the Fed in a dilemma as to a rate hike. A rate cut seems to be off the table, regardless of the president’s rants. Following the report, both the stock market and gold fell on the fear of higher rates, while the US$ Index rose and 2-year note yields rose in anticipation of a rate hike.
The labour market is hanging in despite the Iran war, trade wars, and an increasingly AI-driven economy. As well, there is the question of how deportations are impacting the job market. Are they reflected in these numbers? The release from the Bureau of Labour Statistics (BLS) does not answer those questions. Are they even able to?
Canada job numbers
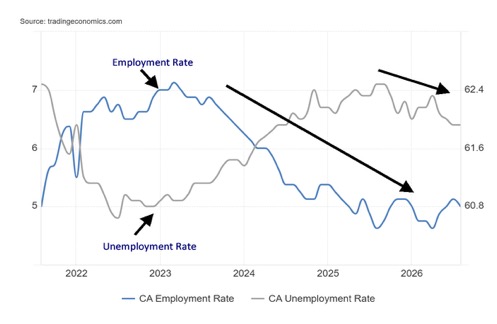
Canada Employment Rate, Unemployment Rate 2021–2026
Source: www.tradingeconomics.com, www.statcan.gc.ca
Following a strong gain in jobs in July, Canada went in the opposite direction in August. It’s a sign of the times with the trade wars in behind. Canada lost 41,700 jobs in August following the big gain in July of 75,100. The market had expected a 15,000 increase. In many ways it wasn’t a surprise, given the background of the trade wars that impact Quebec and Ontario the most. Quebec lost 19,000 jobs while Ontario lost 18,000 jobs. Given the attempts to trim the government workforce, the public sector lost 20,000 jobs in August and has lost 78,000 in 2026. Private sector employment has jumped 156,000 in 2026 while self-employment rose 80,000.
The employment rate slipped to 60.8% from 60.9% while the unemployment rate was unchanged at 6.4%. The labour force participation rate slipped to 65% from 65.1%. The R8 unemployment, the highest reported by Statistics Canada, rose to 9.4% from 9.3%. The number of unemployed people was 1,459,500 vs. 1,454,700 in July. Full-time employment fell 35,900, offsetting the 38,600 gains in July. Part-time employment fell 5,800 in August following a gain of 36,600 in July.
Despite the fall in the number of jobs, the unemployment rate was steady. Job losses should have been expected due to the ongoing trade war with the U.S. The participation rate slipped slightly. Net, Canada is up 76,700 jobs in 2026. The employment rate has generally fallen, but then so has the unemployment rate. Market reaction was muted.
Markets and Trends
|
|
|
|
% Gains (Losses) Trends |
|
||||
|
|
Close Dec 31/25 |
Close Sep 4/26 |
Week |
YTD |
Daily (Short Term) |
Weekly (Intermediate) |
Monthly (Long Term) |
|
|
|
|
|
|
|
|
|
||
|
S&P 500 |
6,845.50 |
7,718.60 |
0.1% |
12.8% |
up |
up |
up |
|
|
Dow Jones Industrials |
48,063.29 |
53,414.25 |
(0.3)% |
11.1% |
up (weak) |
up |
up |
|
|
Dow Jones Transport |
17,357.19 |
21,011.73 |
(1.7)% |
21.1% |
down |
up |
up |
|
|
NASDAQ |
23,241.99 |
26,506.99 |
0.4% |
14.1% |
up |
up |
up |
|
|
S&P/TSX Composite |
31,712.76 |
36,513.80 |
(0.1)% |
15.1% |
up |
up |
up |
|
|
S&P/TSX Venture (CDNX) |
987.74 |
965.40 |
(2.4)% |
(2.3)% |
up (weak) |
neutral |
up |
|
|
S&P 600 (small) |
1,467.76 |
1,765.09 |
(0.1)% |
20.3% |
down |
up |
up |
|
|
ACWX MSCI World x US |
67.18 |
78.50 (new highs) * |
1.1% |
16.9% |
up |
up |
up |
|
|
Bitcoin |
87,576.98 |
79,786.48 |
2.9% |
(8.9)% |
up |
neutral |
neutral |
|
|
|
|
|
|
|
|
|
|
|
|
Gold Mining Stock Indices |
|
|
|
|
|
|
|
|
|
Gold Bugs Index (HUI) |
701.49 |
832.15 |
(0.9)% |
18.7% |
up |
up |
up |
|
|
TSX Gold Index (TGD) |
817.76 |
977.76 |
(1.1)% |
19.6% |
up |
up |
up |
|
|
|
|
|
|
|
|
|
|
|
|
Bonds% |
|
|
|
|
|
|
|
|
|
U.S. 10-Year Treasury Bond yield |
4.17% |
4.79% |
1.3% |
14.9% |
|
|
|
|
|
3.3Cdn. 10-Year Bond CGB yield |
3.44% |
3.78% |
1.3% |
9.9% |
|
|
|
|
|
Recession Watch Spreads |
|
|
|
|
|
|
|
|
|
U.S. 2-year 10-year Treasury spread |
0.69% |
0.41% |
13.9% |
(40.6)% |
|
|
|
|
|
Cdn 2-year 10-year CGB spread |
0.85% |
0.68% |
(5.6)% |
(20.0)% |
|
|
|
|
|
|
|
|
|
|
|
|
|
|
|
Currencies |
|
|
|
|
|
|
|
|
|
US$ Index |
98.26 |
99.16 |
(0.5)% |
0.9% |
down |
neutral |
neutral |
|
|
Canadian $ |
72.87 |
72.28 |
0.5% |
(0.8)% |
up |
up |
down (weak) |
|
|
Euro |
117.48 |
116.12 |
0.2% |
(1.2)% |
up |
neutral |
up |
|
|
Swiss Franc |
126.21 |
123.46 |
(0.1)% |
(2.2)% |
neutral |
down |
up |
|
|
British Pound |
134.78 |
135.15 |
(0.2)% |
0.3% |
neutral |
up |
up |
|
|
Japanese Yen |
63.83 |
64.00 |
2.5% |
0.3% |
up |
up (weak) |
down |
|
|
|
|
|
|
|
|
|
|
|
|
Precious Metals |
|
|
|
|
|
|
|
|
|
Gold |
4,311.97 |
4,429.13 |
(0.7)% |
2.7% |
up |
neutral |
up |
|
|
Silver |
71.16 |
66.15 |
(0.4)% |
(7.0)% |
up |
down (weak) |
up |
|
|
Platinum |
2,046.90 |
1,827.50 |
(0.3)% |
(10.7)% |
up |
down (weak) |
up |
|
|
|
|
|
|
|
|
|
|
|
|
Base Metals |
|
|
|
|
|
|
|
|
|
Palladium |
1,619.50 |
1,403.50 |
(1.3)% |
(13.3)% |
up |
down (weak) |
up (weak) |
|
|
Copper |
5.64 |
6.58 |
0.6% |
16.7% |
up |
up |
up |
|
|
|
|
|
|
|
|
|
|
|
|
Energy |
|
|
|
|
|
|
|
|
|
WTI Oil |
57.44 |
91.12 |
9.2% |
58.6% |
up |
up (weak) |
up |
|
|
Nat Gas |
3.71 |
2.94 |
2.4% |
(20.8)% |
up (weak) |
down (weak) |
down (weak) |
|
Source: www.stockcharts.com
* New All-Time Highs
Note: for an explanation of the trends, refer to the glossary at the end of this article.
New highs/lows refer to new 52-week highs/lows and, in some cases, all-time highs.
Stocks
Source: www.stockcharts.com
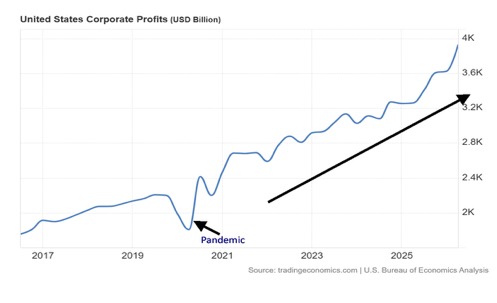
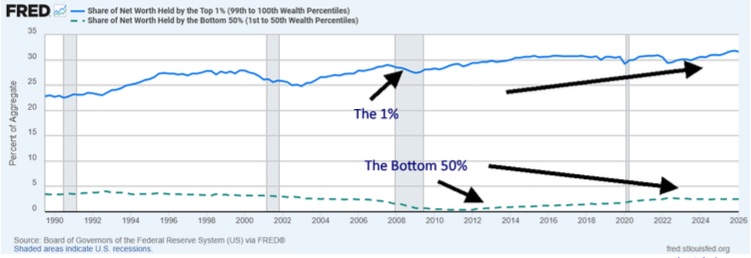
Corporate profits are soaring. The 1% and even down to the 20% just keep on buying, holding the economy up. As a result, the S&P 500 is a mere 1.3% from its all-time high. The rich get richer, while the rest – meh. The demands of the AI stocks continue to grow, even as data centres are meeting increasing resistance. But the MAG7 and the rest that have kept the S&P 500 in the stratosphere are faltering. Other events are playing a role, such as the U.S./Iran war (over there), Russia/Ukraine war (over there), an impotent congress, and a 1% that increasingly are holding a larger share of the wealth.
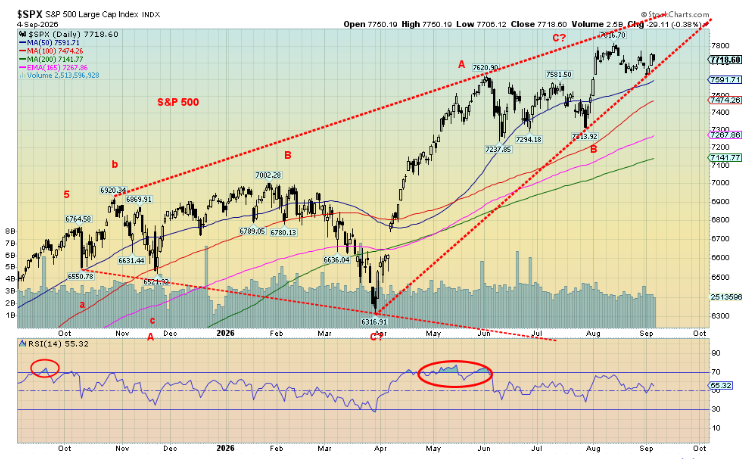
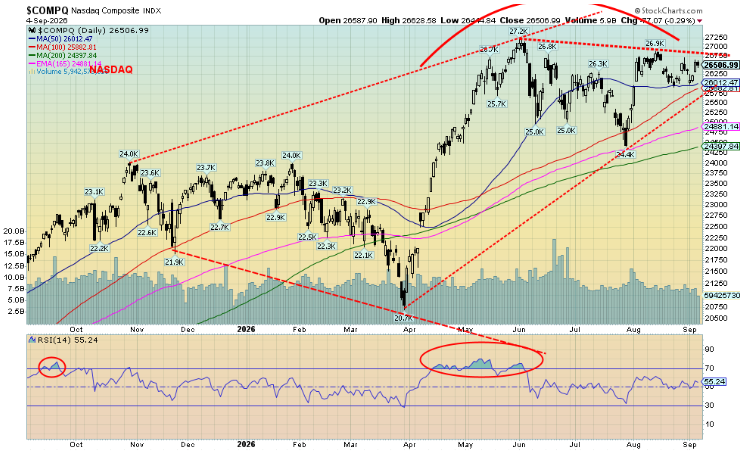
But is the stock market faltering? Possibly. But in reality, it’s still up there. This past week the S&P 500 was up 0.1%, the Dow Jones Industrials (DJI) was off 0.3%, the Dow Jones Transportations (DJT) was down again by 1.7%, while the NASDAQ was up a small 0.4%. None of them made all-time highs. But divergences have emerged, which is usually a signal that we could be topping. The question is: if we fall, how far and how hard? September/October are not known to be friendly months for stocks. By many measurements we are overvalued, but so far they have ignored the signs. As well, we have noted that some 40% of the S&P 500 is made up of the MAG7 plus a few other stocks.
So, just how well has the MAG7 been doing? They are faltering. This past week MAGS, the MAG7 ETF, was up 0.5% with four of the MAG7 up and three down. Meta gained 6.7% and Nvidia was up 5.9% to lead the way. Amazon fell 3%. Overall, they are all looking suspect, but nobody has busted yet. Micron gained 9% this past week and if there was a big loser it was Netflix, off 4.3%. As noted, the NASDAQ was only up small, and the NY FANG Index was off 0.4%. Bitcoin continues its recent rebound up 2.9%.
Elsewhere, the S&P 400 (Mid) was up 0.2% while the S&P 600 (small) was down 0.1%. In Canada, the TSX Composite was off 0.1% while the TSX Venture Exchange (CDNX) lost 2.4%. In the EU, the London FTSE was flat, the Paris CAC 40 fell 1.5%, the German DAX dropped 2.0%, and the EuroNext fell 0.9%. In Asia, China’s Shanghai Index (SSEC) was off 0.6%, the Tokyo Nikkei Dow (TKN) dropped 2.1%, Hong Kong’s Hang Seng (HSI) gained 0.2% while India’s Nifty Fifty fell 1.2%. No big movements anywhere, but all continue to look shaky.
U.S. Corporate Profits 2016–2026 (billions)
Source: www.tradingeconomics.com, www.bea.gov
Share of Net Worth Held by the 1% and the Bottom 50% 1990–2026 (%)
Source: www.stlouisfed.org
Source: www.stockcharts.com
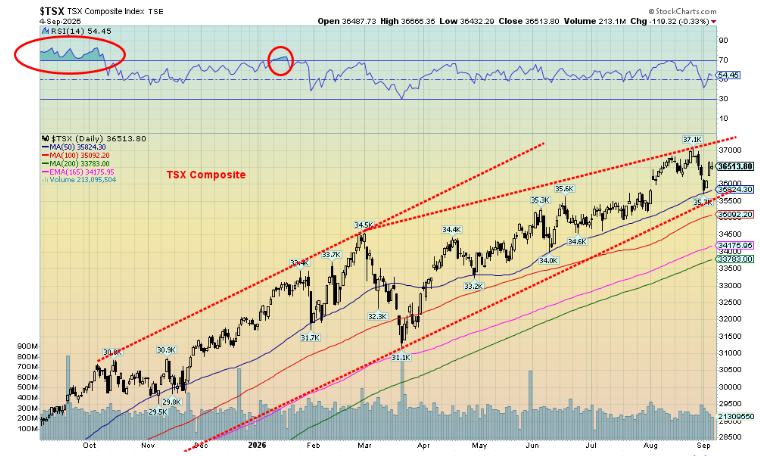
The S&P 500 breaks under 7,600, the NASDAQ under 25,700, and the TSX under 35,500. New highs keep the party going. The NASDAQ appears to be making a classic topping pattern. Foreign indices, particularly in the EU, look vulnerable.
Source: www.stockcharts.com
For the TSX, six of the 14 sub-indices were up on the week. Key was Energy (TEN) making new highs plus good performances from Consumer Discretionary (TCD), up 1.6%, and Consumer Staples (TCS), up 1.3%. If there was a loser on the week it was Information Technology (TTK), down 2.5%. Otherwise, there were not any big movements one way or another with the TSX stocks this past week.
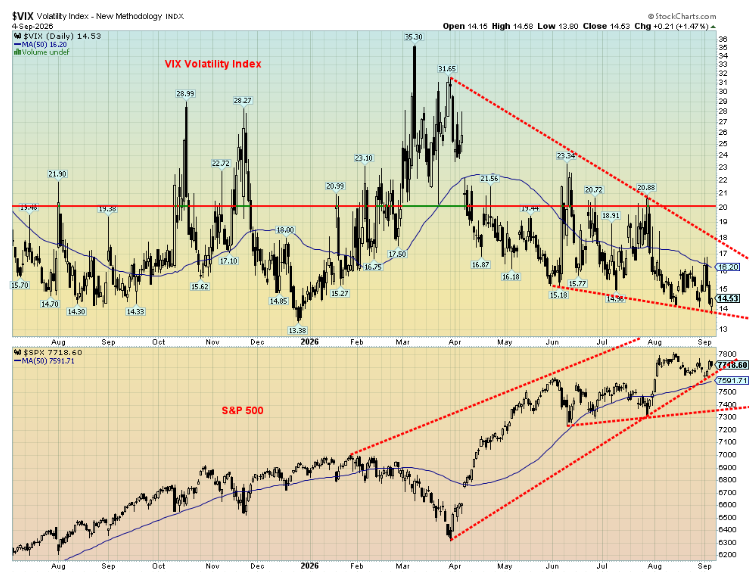
The VIX Volatility Index is registering 14.53 close this past week after hitting a low of 13.80. The VIX moves inversely to the S&P 500. The VIX is in complacency territory. That’s a warning but not necessarily a death knell for the stock market. The CNN Fear and Greed Index is registering fear, even as the S&P 500 is not far from its all-time high. So, which is it? Complacency or fear?
Many continue to forecast a collapse in the stock market; however, so far, we see no sign. That doesn’t mean it won’t happen, just that it hasn’t happened yet. Continue to watch the break points for signs of trouble. Under S&P 500 7,200, a bigger breakdown could occur.
Source: www.stockcharts.com
Bonds
Source: www.tradingeconomics.com, www.home.treasury.gov, www.bankofcanada.ca
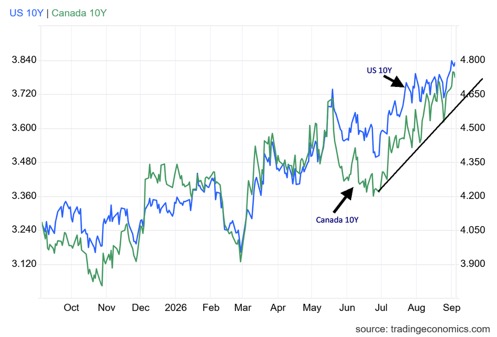
Interest rates are on another upward march once again. The stronger job numbers, huge growing demand, particularly from AI companies, massive debt, and requirements of the U.S. Treasury to fund operations are pushing interest rates to new heights. It is unsustainable and Treasury Secretary Scott Bessent’s Operation Twist is not helping – it reeks of manipulation, which should make the market nervous. He brings down interest rates, only to see them pop higher once again. Quite simply, the U.S.’s $40 trillion in debt can never be paid back, only rolled over.
And it is not as if they are cutting back on spending as the U.S. budget deficit has reached an astronomical 6.5% of GDP. It shows no signs of abating. All countries face the same problem, but the U.S. is the worst. They seem to believe that because the U.S. dollar is the world’s reserve currency they will always get funded. But the U.S. dollar is falling as investors become increasingly concerned about the massive U.S. debt.
And it’s not just the federal government debt. Add in state debt, corporate debt, financial debt, and household debt and you discover that the U.S. holds one-third of the world’s debt. That’s right. $1 of every $3 of global debt is held by the U.S. So far, being the world’s reserve currency helps the U.S., along with commodities and others being priced and settled in U.S. dollars. But that is slowly changing, particularly as the world becomes increasingly wary of the U.S. with its massive debt, its wars, its deteriorating domestic politics, its embargoes, blockades, sanctions, and seizing of assets if they cross the U.S. government. The world looks for a workaround, building new systems to counter the U.S.
All of this puts downward pressure on the U.S. dollar and upward pressure on interest rates as investors demand a higher premium to purchase U.S. securities. It also doesn’t help that the president puts pressure on the Fed to do his bidding and lower the Fed rate. Or that the secretary of the treasury continues his Operation Twist program to try and push down long rates. So far, none of it is working. There are bouts of improvement and then bonds and the U.S. dollar renew their downward move (price for bonds that moves inversely to yields).
And in what has to be a bizarre declaration, President Trump has announced that if Fed Chair Kevin Warsh doesn’t accede to his demands to lower interest rates, he’s going to end all trade with nations that have a trade surplus with the U.S. That includes China, Mexico, and Canada, along with a host of other countries. If instituted, it would be an instant financial disaster. Currently, the U.S. has trade deficits with these countries, but in turn they purchase U.S. securities to fund its massive debt. However, it would be good for gold.
This past week, the U.S. 10-year Treasury note rose to 4.79% from 4.73%. The 30-year bond was up to 5.25% from 5.21% while the 2-year Treasury note rose on growing expectations that the Fed will hike rates at the September 15–16 FOMC. The 2-year rose to 4.37% after hitting 4.41% earlier. Canada also saw its 10-year Government of Canada bond (CGB) rise to 3.78% from 3.73%. Upward interest rate pressures are also being seen in the U.K. (gilts), Germany (bunds), France (oats), and Japan (JGBs).
There is too much debt, and rising interest rates are the direct result of too much debt. The result is a financial crisis could be looming.
Gold and silver
Source: www.stockcharts.com
Gold prices were not happy this past week as the larger than expected job numbers took a bite out of gold. But, make no mistake, gold prices and by extension silver prices and the gold stocks are headed higher. Rising bond yields do not appear to be the bugaboo they used to be.
Since the end of the gold standard in August 1971, gold has been through three significant bull markets: 1971–1980 that saw gold rise 1,850%; 2001–2011 where gold was up 632%; and since 2018 to the present where gold has gone up 240%, although it was higher at the peak in January 2026. Usually, when we see bond yields rise, gold falls. But since 2022 that equation has flipped. First, Western governments seized $630 billion worth of Russian assets. As a result, gold buying by some major central banks, emerging market central banks, and sovereign funds accelerated. They rose from 5–7% of reserves to 11% today. For some it is even higher.
The U.S. has the world’s highest reserves of gold at 8,133 metric tonnes, representing some 71%–81% of its reserves. However, the U.S. only values its gold holdings at $42.22/ounce. China has been increasing its holdings of gold reserves while shedding its holdings of U.S. treasuries. But gold reserves only represent some 7–8% of its total reserves. China last holds 2,346 metric tonnes of gold. The world’s largest reserves of gold are in Russia and Australia, both estimated to hold roughly 12,000 metric tonnes. But total reserves are limited and the world is estimated to only have about 15–20 years of proven, economically recoverable reserves.
Source: www.stockcharts.com
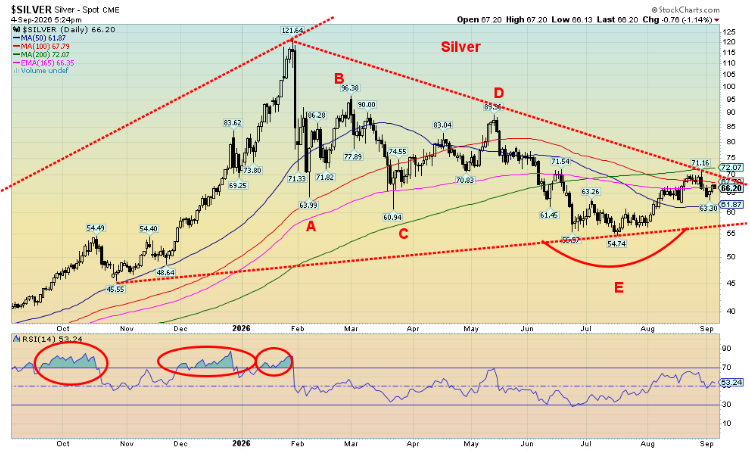
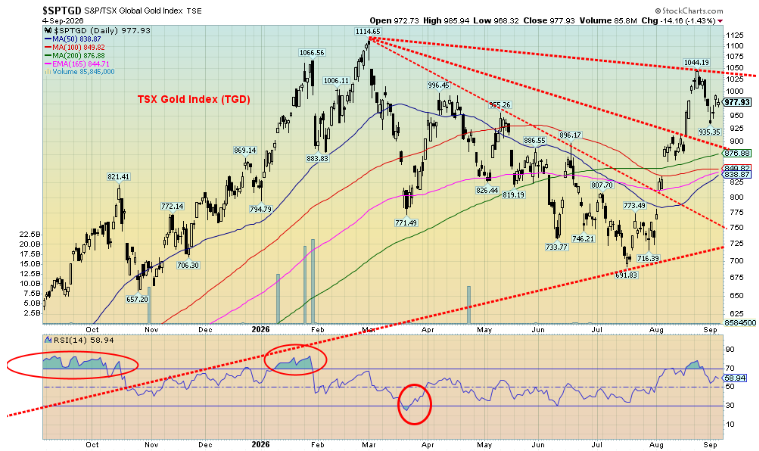
This past week, gold fell 0.7%, silver was off 0.4%, and platinum dropped 0.3%. Palladium wavered, down 1.3%, but copper continued to climb, up 0.6%. Copper remains the leader and is pointed higher. The gold stocks wavered but were not crushed as the Gold Bugs Index (HUI) was off 0.9% and the TSX Gold Index (TGD) fell 1.1%. We continue to need silver and the gold stocks to lead the upward parade.
Gold broke over $4,500 resistance but so far has failed to build on it. Now we need to break above $4,700 to suggest higher. Above $5,200 new highs are possible. For silver, we stalled near the 200-day MA, so we now need a firm break above $72 to suggest higher. Above $106 new highs are possible. Similarly, for the TGD, as both the HUI and the TGD have outperformed so far, we need to break above 1,050. The TGD has already taken out 1,015 where new highs are suggested. The TGD is forming what looks like a fan pattern. Once above that third fan, we should start to move higher.
For gold, we need to see it hold above $4,200, silver above $62, and the TGD above 875. The outlook for gold and silver and the gold stocks remains bullish. Helping is the continued faltering of the U.S. dollar. The US$ Index fell this week, despite the stronger job numbers. USDX was down 0.5%. A big winner was the Japanese yen, up 2.5% as intervention once again from the BOJ was seen. However, we don’t have any evidence they were drawing on their Fed facility whereby they can borrow U.S. dollars against collateral of U.S. treasuries and then use those funds to purchase yen. Rising interest rates in Japan are putting considerable pressure on the BOJ and potentially forcing the unwinding of the massive yen carry trade.
The reality is, there is too much debt in the world. Its growth is unsustainable and potentially a real threat for a financial crisis of major proportions that could force the Fed and the other central banks into their biggest save of the financial system ever, paling what they did in 2008 and 2020. Can they do it? That’s questionable. Hence, own gold, which is indestructible, irreplaceable, and has no liability. Here in North America funds and individuals are holding only about 3% gold in their positions. The percentage is higher for the EU and Asia.
Source: www.stockcharts.com
Oil and gas
Source: www.stockcharts.com
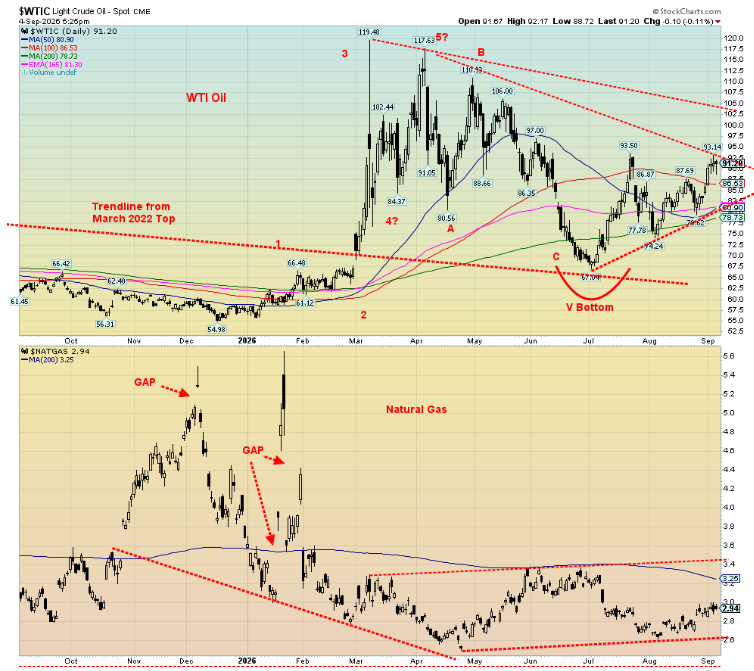
Once again, oil prices are on the rise, thanks to the resumption of hostilities between the U.S. and Iran. Or is that the case, as Trump and Vance declare it’s not a war, but they won’t say when it will end. They also say the U.S. is in charge of the Strait of Hormuz, despite evidence to the contrary. Few if any ships are getting through and ships have been fired on from Iran.
Diesel prices are also soaring as are other refined products and that too puts upward pressure on oil prices. The conflict between Ukraine and Russia also continues and both sides are upping the ante. That is also having a negative impact on oil prices as Ukraine hits Russian oil refineries. Russia is hitting ships that carry grain from Ukraine, which will result in higher food prices. Fertilizers are also being blocked behind the Strait of Hormuz, also contributing to higher food prices.
Grant you, this could change tomorrow if Trump suddenly announces that peace is at hand as he has done before. Higher oil prices are not popular (obviously), so Trump will TACO again, as they say. On the week, WTI oil rose 9.2% to $91 while Brent crude jumped 8.5% to nearly $96. Natural gas (NG) wasn’t spared as in the EU NG at the Dutch Hub jumped 9.7%. NG at the Henry Hub was up only 2.4%. The energy stocks loved it as the ARCA Oil & Gas Index (XOI) rose 3.3% while the TSX Energy Index (TEN) was up 1.6%, both to new all-time highs.
Trump is trapped in the Iran war with no way out unless he’s willing to admit defeat, which is highly unlikely. But he will most likely continue to vacillate between “peace is at hand” and “we will obliterate them.” Troops on the ground? Unlikely, but always possible. Given the huge size of Iran, a very mountainous country with also a significant desert, trying to conquer Iran is a difficult, maybe impossible task. We’ve even seen suggestions of nuking the Pickaxe Mountain, allegedly containing Iran’s nuclear program.
Still, oil prices have not yet entered the danger zone. We got up through $90 for WTI but have yet to build on that. We need to break above $105 to suggest a potential move to $150/$160. NG also remains somewhat dormant and needs to break above $3.40 to suggest considerably higher prices. The U.S. strategic reserves continue to trend near 5-year lows and need replenishing. They seem to believe that they can get Venezuelan oil, but that is not a given. The U.S.’s ongoing trade war with Canada could still see taxes put on Canada’s oil that is shipped to the U.S., even as that is a contentious subject in Canada.
Both the oil and NG charts remain positive, suggesting higher prices. Oil is good as long as it stays above $90 while NG has support down to $2.60. But prices will vacillate as long as the TACO man is in charge. If we break out above $105, look out above.
Copyright David Chapman 2026
GLOSSARY
Trends
Daily – Short-term trend (For swing traders)
Weekly – Intermediate-term trend (For long-term trend followers)
Monthly – Long-term secular trend (For long-term trend followers)
Up – The trend is up.
Down – The trend is down
Neutral – Indicators are mostly neutral. A trend change might be in the offing.
Weak – The trend is still up or down but it is weakening. It is also a sign that the trend might change.
Topping – Indicators are suggesting that while the trend remains up there are considerable signs that suggest that the market is topping.
Bottoming – Indicators are suggesting that while the trend is down there are considerable signs that suggest that the market is bottoming.
Disclaimer
David Chapman is not a registered advisory service and is not an exempt market dealer (EMD) nor a licensed financial advisor. He does not and cannot give individualised market advice. David Chapman has worked in the financial industry for over 40 years including large financial corporations, banks, and investment dealers. The information in this newsletter is intended only for informational and educational purposes. It should not be construed as an offer, a solicitation of an offer or sale of any security. Every effort is made to provide accurate and complete information. However, we cannot guarantee that there will be no errors. We make no claims, promises or guarantees about the accuracy, completeness, or adequacy of the contents of this commentary and expressly disclaim liability for errors and omissions in the contents of this commentary. David Chapman will always use his best efforts to ensure the accuracy and timeliness of all information. The reader assumes all risk when trading in securities and David Chapman advises consulting a licensed professional financial advisor or portfolio manager such as Enriched Investing Incorporated before proceeding with any trade or idea presented in this newsletter. David Chapman may own shares in companies mentioned in this newsletter. Before making an investment, prospective investors should review each security’s offering documents which summarize the objectives, fees, expenses and associated risks. Although Artificial Intelligence (AI) may be deployed from time to time, AI output is monitored and adjusted, if necessary, for accuracy. David Chapman shares his ideas and opinions for informational and educational purposes only and expects the reader to perform due diligence before considering a position in any security. That includes consulting with your own licensed professional financial advisor such as Enriched Investing Incorporated. Performance is not guaranteed, values change frequently, and past performance may not be repeated.
About the author


Website: https://www.enrichedinvesting.com
Disclaimer: David Chapman is not a registered advisory service and is not an exempt market dealer (EMD) nor a licensed financial advisor. We do not and cannot give individualised market advice. David Chapman has worked in the financial industry for over 40 years including large financial corporations, banks, and investment dealers. The information in this newsletter is intended only for informational and educational purposes. It should not be considered a solicitation of an offer or sale of any security. The reader assumes all risk when trading in securities and David Chapman advises consulting a licensed professional financial advisor before proceeding with any trade or idea presented in this newsletter. David Chapman may own shares in companies mentioned in this newsletter. We share our ideas and opinions for informational and educational purposes only and expect the reader to perform due diligence before considering a position in any security. That includes consulting with your own licensed professional financial advisor.