
We're up in Ottawa, so this is a shortened report without the opener and chart of the week. This coming week we have a medical appointment that will take up at least a day. Although it is not a serious one. We'll play it by ear regarding whether we issue a full report.
The U.S. September jobs report was weaker than expected. Bond yields fell, gold rose, stocks rose, and the US$ Index rose. But something funny happened on the way to the Fed. Bond yields reversed and closed higher for the week. Gold reversed and closed lower for the week. Stocks were mixed but the NASDAQ made fresh all time highs, though barely. No one else joined him.
The stock market continues to top. Few stocks make new highs. Many make new lows. Gold looks like it will have another thrust to the downside but it could set up a buying opportunity. This would benefit companies such as Torex Gold Resources Inc. that reported increased revenue, expanded net income, and greater free cash flow, pays a dividend, and is held in the Enriched Capital Conservative Growth Strategy.* Bond yields look higher, and the U.S. bond market looks very shaky. Bond auctions are shaky. Odds ease about an October Fed rate hike. Given that the U.S. bond market is the largest most liquid market in the world this is not a good development. Real rates are rising. The question is when the economy will tip over not if it will turn over.
Yields are rising despite the weak job numbers and slightly weaker PCE inflation numbers. GDP remains good, which means the AI stocks are reporting good profits. However, AI companies are piling on debt, which could become a problem.
The world continues to deteriorate. Russia/Ukraine war is threatening to expand and engulf the EU and NATO. The Mid-East war is threatening to expand. Diesel prices are a problem given their heavy usage in industry. They want to release dwindling strategic reserves to ease prices. U.S. suggested export controls. All are temporary fixes for long-term pain.
Don't be fooled by the weakness in oil prices this past week. Don't be fooled by a temporary drop in the gold market. The stock market is topping, it just hasn't broken. The US$ Index is rising but it has reachedoverbought levels. A fall going forward is more likely than a further rise. Risk is rising everywhere.
Another month until the U.S. midterms, where the Republicans appear to be losing "bigly". But will they? There is considerable evidence suggesting the Republicans are trying to fix the mid-terms. Canada is facing separatism. Uncertain and deteriorating politics is ultimately not good for markets.
Lovely weather up here in Ottawa. Fall is in the air. Have a great week. Always a bright side somewhere.
DC
* Reference to the Enriched Capital Conservative Growth Strategy and its investments, celebrating an
8.6 - year history of 193% growth (annual 13.33%) to August 31, strong alpha and second August ranking at www.emergingmanagers.ca, is added by Margaret Samuel, President, CEO and Portfolio Manager of Enriched Investing Incorporated, who can be reached at 416-203-3028 or msamuel@enrichedinvesting.com This information should not be construed as an offer, or a solicitation of an offer or sale of any security. Past performance does not guarantee future returns.
“The idea that we're going to replace oil and natural gas with solar and wind, and nothing else, is a hallucinatory delusion.”
—Michael Schellenberger, political and ecomodernist activist and writer, founder of the ecomodernist think tank Breakthrough Institute, author of Apocalypse Never (2020); b. 1971
“Too often, governments are quick to use excessive force and even pervert the course of justice to keep oil and gas flowing, forests logged, wild rivers dammed and minerals extracted. As the Global Witness study reveals, citizens are often killed, too - especially if they're poor and indigenous.”
—David Suzuki, Canadian academic, science broadcaster, and environmental activist, professor of genetics, University of British Columbia (1963–2001), author and founder of the David Suziki Foundation 1990, host of CBC’s Nature of Things, Companion of the Order of Canada; b. 1936
"The energy industry is the industry that powers every other industry... to the extent energy is cheap, plentiful, and reliable, human beings thrive; to the extent energy is unaffordable, scarce, or unreliable, human beings suffer."
—David Koch, American businessman, philanthropist, limited government advocate and chemical engineer, joined Koch Industries 1970, libertarian and Republican; 1940–2019
U.S. jobs report
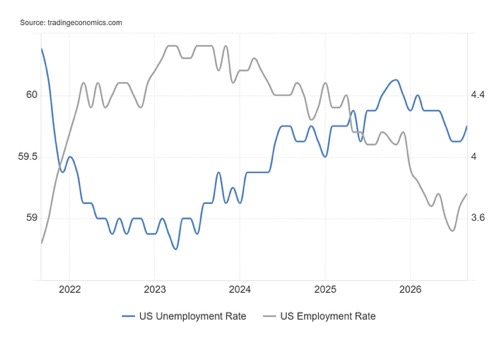
The U.S. job numbers for September came in softer than what was expected. Instead of 90,000 new jobs, they got only 29,000 jobs. What’s worse, the previous two months were downward revised by 60,000 jobs. The labour force grew also grew, causing the unemployment rate (U3) to jump to 4.2% from 4.1%. If there was any good news, it was that the U6 unemployment rate, which includes marginally attached workers and part-timers who may be employed but want full-time work, fell to 7.6% from 7.7%. As we’ve seen before, gains were in health care and social services although government employment fell. The 12-month average is now 41,000/month.
U.S. bond yields fell on the news while stocks rallied, given that many now expected that the Fed will do nothing at the next meeting. Gold rose small. Inflation is up in the air, although the latest PCE prices came in at 3.4% which was largely as expected. The Q2 GDP growth (final) was 2.2%, which was above the expected 1.5% but below the previously reported 2.5%. Private investment and government spending plus higher personal consumption expenditure drove the rise, even as the consumer continues to experience problems and consumer sentiment is falling.
Source: www.tradingeconomics.com, www.bls.gov
Markets and Trends
|
|
|
|
% Gains (Losses) Trends |
|
||||
|
|
Close Dec 31/25 |
Close Oct 2/26 |
Week |
YTD |
Daily (Short Term) |
Weekly (Intermediate) |
Monthly (Long Term) |
|
|
|
|
|
|
|
|
|
||
|
S&P 500 |
6,845.50 |
7,722.72 |
(0.3)% |
12.8% |
down |
up |
up |
|
|
Dow Jones Industrials |
48,063.29 |
51,176.96 |
(1.3)% |
6.5% |
down |
up (weak) |
up |
|
|
Dow Jones Transport |
17,357.19 |
20,009.75 |
2.2% |
15.9% |
down |
down (weak) |
up |
|
|
NASDAQ |
23,241.99 |
27,190.86 (new highs) * |
0.5% |
17.0% |
up |
up |
up |
|
|
S&P/TSX Composite |
31,712.76 |
35,502.65 |
(0.8)% |
12.0% |
down |
up |
up |
|
|
S&P/TSX Venture (CDNX) |
987.74 |
880.57 |
(4.4)% |
(10.9)% |
down |
down |
up |
|
|
S&P 600 (small) |
1,467.76 |
1,686.75 |
0.2% |
14.9% |
down |
neutral |
up |
|
|
ACWX MSCI World x US |
67.18 |
76.01 |
(1.1)% |
13.1% |
down |
up |
up |
|
|
Bitcoin |
87,576.98 |
84,388.56 |
0.6% |
(3.6)% |
up |
up |
up (weak) |
|
|
|
|
|
|
|
|
|
|
|
|
Gold Mining Stock Indices |
|
|
|
|
|
|
|
|
|
Gold Bugs Index (HUI) |
701.49 |
736.25 |
(6.3)% |
5.0% |
down |
neutral |
up |
|
|
TSX Gold Index (TGD) |
817.76 |
886.38 |
(5.3)% |
8.4% |
down |
neutral |
up |
|
|
|
|
|
|
|
|
|
|
|
|
Bonds% |
|
|
|
|
|
|
|
|
|
U.S. 10-Year Treasury Bond yield |
4.17% |
5.28% |
2.1% |
26.6% |
|
|
|
|
|
3.3Cdn. 10-Year Bond CGB yield |
3.44% |
3.95% |
0.5% |
14.8% |
|
|
|
|
|
Recession Watch Spreads |
|
|
|
|
|
|
|
|
|
U.S. 2-year 10-year Treasury spread |
0.69% |
0.44% |
46.7% |
(36.2)% |
|
|
|
|
|
Cdn 2-year 10-year CGB spread |
0.85% |
0.67% |
13.6% |
(21.2)% |
|
|
|
|
|
|
|
|
|
|
|
|
|
|
|
Currencies |
|
|
|
|
|
|
|
|
|
US$ Index |
98.26 |
101.93 (new highs) |
0.9% |
3.7% |
up |
up |
neutral |
|
|
Canadian $ |
72.87 |
70.18 |
(0.8)% |
(3.7)% |
down |
down |
down |
|
|
Euro |
117.48 |
112.54 |
(1.2)% |
(4.2)% |
down |
down |
neutral |
|
|
Swiss Franc |
126.21 |
120.68 |
flat |
(4.4)% |
down |
down |
neutral |
|
|
British Pound |
134.78 |
132.42 |
flat |
(1.7)% |
down |
down |
up (weak) |
|
|
Japanese Yen |
63.83 |
63.35 |
(0.4)% |
(0.8)% |
neutral |
neutral |
down |
|
|
|
|
|
|
|
|
|
|
|
|
Precious Metals |
|
|
|
|
|
|
|
|
|
Gold |
4,311.97 |
4,141.90 |
(3.3)% |
(3.9)% |
down |
down |
up |
|
|
Silver |
71.16 |
60.39 |
(5.9)% |
(15.1)% |
down |
down |
up |
|
|
Platinum |
2,046.90 |
1,706.60 |
(4.0)% |
(16.6)% |
down |
down |
up |
|
|
|
|
|
|
|
|
|
|
|
|
Base Metals |
|
|
|
|
|
|
|
|
|
Palladium |
1,619.50 |
1,172.50 |
(8.2)% |
(27.6)% |
down |
down |
up (weak) |
|
|
Copper |
5.64 |
6.52 |
(2.7)% |
15.6% |
down |
up |
up |
|
|
|
|
|
|
|
|
|
|
|
|
Energy |
|
|
|
|
|
|
|
|
|
WTI Oil |
57.44 |
9.18 |
(1.4)% |
58.7% |
neutral |
up (weak) |
up |
|
|
Nat Gas |
3.71 |
3.048.7 |
(4.7)% |
(18.7)% |
up (weak) |
neutral |
neutral |
|
Source: www.stockcharts.com
* New All-Time Highs
Note: for an explanation of the trends, refer to the glossary at the end of this article.
New highs/lows refer to new 52-week highs/lows and, in some cases, all-time highs.
Stocks
Source: www.stockcharts.com
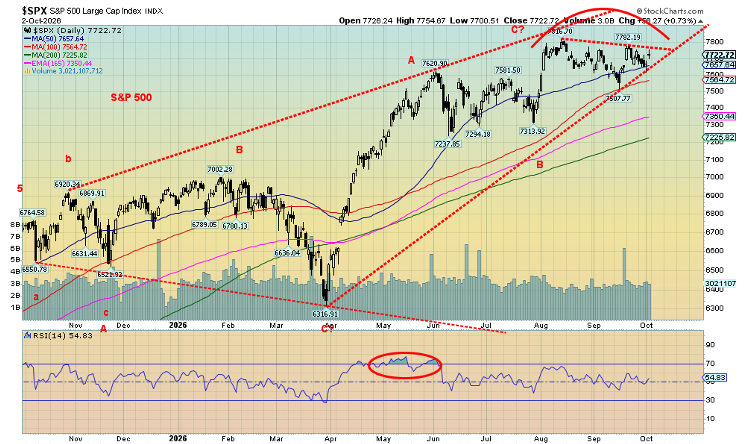
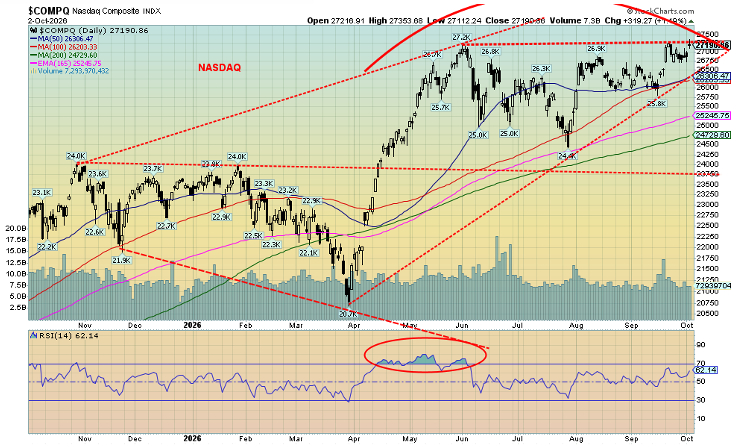
The stock market continues in its topping. The weaker than expected job numbers helped push stock markets higher. The NASDAQ made all-time highs again (barely). Nobody else joined them. Surprisingly, while a few of the AI/MAG7 stocks made all-time highs (Microsoft, Nvidia, AMD, and CrowdStrike), the NY FANG Index and MAGS did not. More divergences. International markets remain weak, notably the EU markets and even Asian markets. But the U.S. markets have not yet broken down. As long as they hold up, the trend remains up. The weakest index has been the Dow Jones Transportations (DJT), down 19% from its all-time highs made in April 2026. That’s hovering just above an official bear market.
On the week, the S&P 500 fell 0.3%, the Dow Jones Industrials (DJI) was off 1.3%, the DJT was up 2.2%, and the NASDAQ gained 0.5%. The S&P 400 (Mid) rose 0.5%, while the S&P 600 (Small) was up 0.2%. The NY FANG Index fell 0.6%, despite the new all-time highs of the NASDAQ, and the S&P 500 Equal Weight Index fell 0.7%. The weak S&P 500 Equal Weight Index underscores the weakness in the broader market vs. the strengths of the AI/high-tech stocks. The average S&P 500 stock is already in a bear market, down 20%. The number of S&P 500 stocks making new 52-week highs is outnumbered by the number of S&P 500 stocks making new lows. Indicators are pointing to lower, not higher prices.
In Canada, the TSX fell 0.8% while the TSX Venture Exchange (CDNX) continued its woes, down 4.4%. In the EU, the London FTSE fell 2.2%, the EuroNext was down 1.1%, the Paris CAC 40 was off 2.2%, and the German DAX was down 0.7%. In Asia, China’s Shanghai Index (SSEC) fell 1.2%, the Tokyo Nikkei Dow (TKN) was up 2.9%, while Hong Kong’s Hang Seng (HSI) fell 2.2%. India’s Nifty Fifty was down 3.1%. No joy anywhere (mostly).
Source: www.stockcharts.com
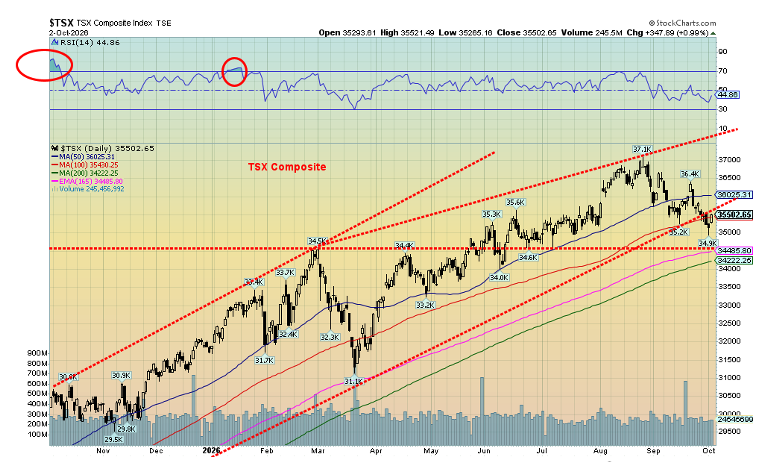
The S&P 500 breaks out above 7,800 but breaks down under 7,600. The NASDAQ’s new highs are feeble and are not being confirmed by the indicators. The TSX breaks out above 37,300 but may have already started to break down. Under 34,800, the TSX begins a potentially bigger breakdown. This past week, nine of the 14 sub-indices were down on the week, led by the Materials (Gold (TGD)), Metals (TGM), and Materials (TMT)). Information Technology (TTK) was the strongest but it remains well under all-time highs. Telecommunications (TTS) has been the weakest sector while Energy (TEN) has been the strongest in 2026.
Yes, we remain in an uptrend. But the market is weakening. Until we break to the downside, we can’t rule out a run to new highs. But it’s October, the month of crashes. But it is also the month of lows.
Source: www.stockcharts.com
Bonds
Source: www.tradingeconomics.com, www.home.treasury.gov, www.bankofcanada.ca
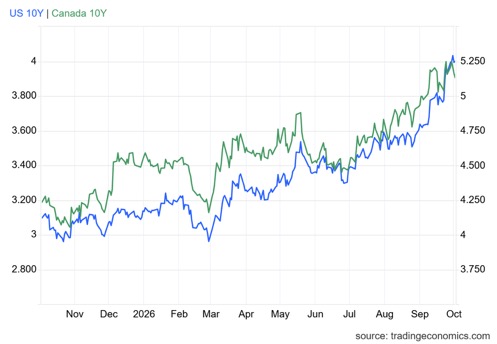
The U.S. 10-year Treasury note hit a high of 5.34% earlier in the week on stronger than expected GDP growth, then fell to around 5.17% following the release of the weaker than expected September job numbers. It didn’t last long as the 10-year was last at 5.28%, up roughly 10 bp on the week. The weakness in the bond market continues. It included a poor reception for U.S. securities at the latest bond auctions. The Canada 10-year Government of Canada bond (CGB) was last at 3.95%, up 2 bp from the previous week. The Canada bond did hit a high of 4% earlier.
The weak job numbers did lower expectations for an October rate hike (October 27–28). But the rebound after the job numbers, followed immediately by a resurgence of higher bond yields, suggests to us that there was a serious seller in the background looking to unload U.S. treasury securities. Who was it? Japan? China? Hedge funds? Until the release of the August holdings of U.S. securities by foreign holders, we can only surmise. But the reality was a move that tells us there is a serious problem in the U.S. treasury market.
At the other end, gold rallied strongly following the release of the job numbers. It didn’t last long as bond prices fell (yields, which move inversely to prices, rose). Gold then reversed and finished the day in the red. More about gold next.
Gold and silver
Source: www.stockcharts.com
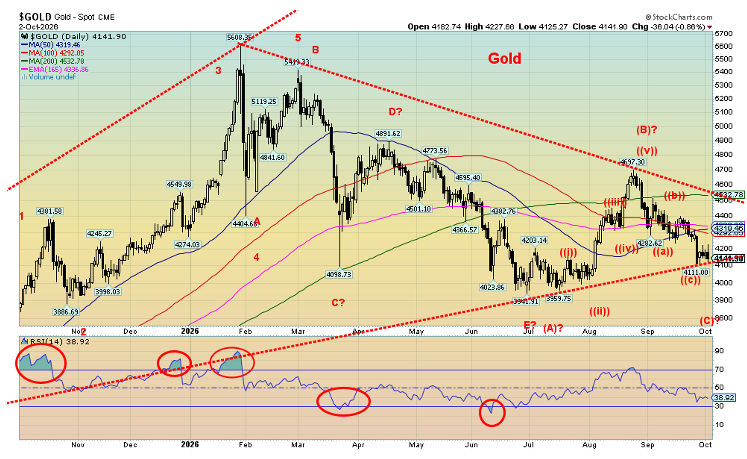
Gold and silver remain on their heels. As we noted under bonds, gold prices jumped following the release of the weaker than expected September job numbers. The rally didn’t last long. After rising $50 or so following the job numbers on Friday, gold closed down $36. That’s not a good sign. Gold is responding negatively to rising bond yields. And it may get worse as bond yields are on a continued trajectory to the upside. Will it spark a deeper gold sell-off? Quite possibly. It can’t be ruled out.
We always thought that the bear that followed the big gold run-up that topped in January 2026 would test lows. So far, so good. We are on the cusp of it, signaling to us that new lows are probable. On Friday, we closed at $4,145. Under $4,100, new lows below $3,942 are probable. Should this be a surprise? We know we are in a period that is not friendly to gold. It can last into December. The final low could come anytime from now until mid-December. Is it a panic? Probably not. It will be buying opportunity.
There were opportunities for gold to close higher this past week, with weaker than expected PCE prices and weaker than expected job numbers. Music for gold – not! Gold closed the week down 3.3%, silver was down 5.9%, and platinum was down 4.0%. Even the near precious metals didn’t respond as palladium fell 8.2% and copper fell 2.7%. Yes, copper fell, even as copper remains in a strong uptrend. The gold stocks fell too with the Gold Bugs Index (HUI) down 6.3% and the TSX Gold Index (TGD) down 5.3%. Downtrends dominate for daily and even some weekly.
Source: www.stockcharts.com
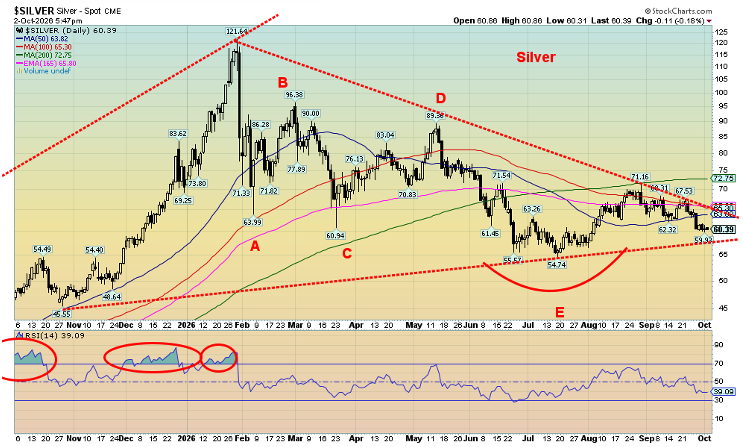
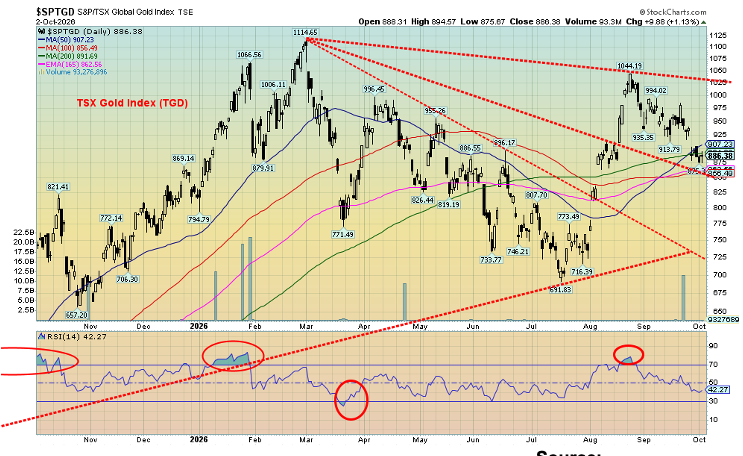
The result of all this is we’ll have to ride out what appears to be another thrust to the downside. How low could we go? Our worst-case scenario is down to $3,500. A swing down target is $3,200; however, we’d be quite surprised if we went that low. Silver? It breaks under $58. Under that level also signals new lows below $54.74. Major support is at $50. We’d be surprised if we fell that low. Ideally, either gold or silver makes new lows but the other one doesn’t. That divergence would signal a potential bottom. Also potentially positive is that the HUI and TGD are nowhere near their earlier lows. The odds of new lows for the HUI and the TGD are low. That’s another potential positive divergence.
The RSI for both gold and silver is under 40 but remains for the moment above 30 oversold levels. A decline under 30 would be welcome. It could even be expected. To be encouraging, the breakout levels are $4,500 gold and $65 silver. To be really sure, we’d prefer to see gold above $4,600 and silver above $73. For the TGD, a breakout is above 1,025, and for the HUI above 860 and initially above 800.
Despite the pain of the year-long correction for gold, silver, and the gold stocks, we remain positive. There is just too much debt and the U.S. is in a pickle with weakening bond auctions. Their deficits are too big. Wars continue. The geopolitics is fractured. In the U.S. politics is seriously fractured as we see continued attempts to fix the upcoming mid-terms in favour of the Republicans.
The U.S. is not the only one as Japan and the EU have significant debt problems as well. It’s one thing if Sudan goes under, but it’s another if France goes under. To gold that’s music. Gold is currency. And, oh yes, a strengthening US$ Index is not helping either. Higher interest rates are pulling the US$ Index higher. Indeed, we can’t help but notice that the US$ Index’s RSI is now well above 70 and the currencies (Cdn$, euro, etc.) have RSIs under 30 (oversold). Does that mean we are about to turn? No as overbought and oversold are just a state but it doesn’t pinpoint a top or a bottom.
Source: www.stockcharts.com
It has been a frustrating year for gold bugs. They’ve been here before, notably during 2011–2015. So far, the current decline is a picnic compared to 2011–2015.
Oil and gas
Source: www.stockcharts.com
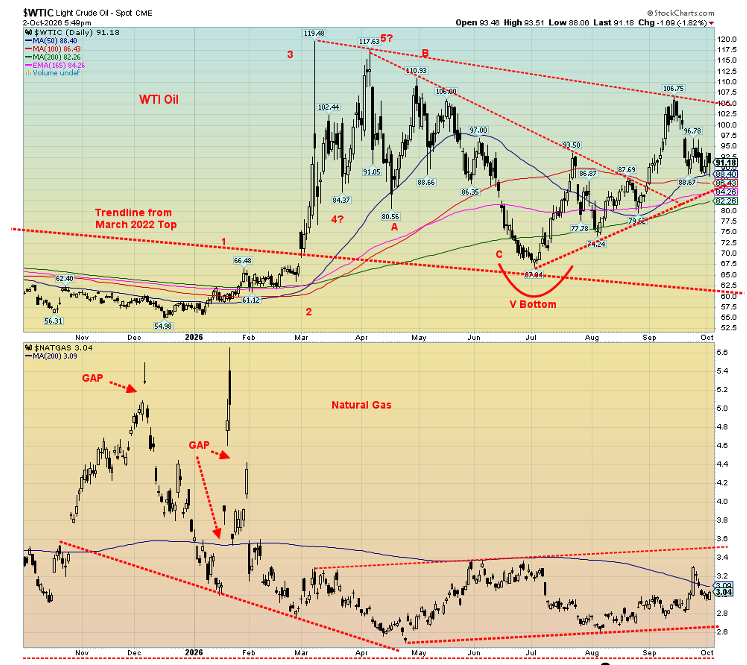
It has been a week of volatile trading in the oil market. Threats of diesel export control (as follows), release of strategic reserves, ongoing turmoil in the Strait of Hormuz and in the Russia/Ukraine conflict, and China reasserting its export ban for diesel have continued to contribute to volatile trading. Ignore the fact that oil (WTI, Brent) prices fell again this past week. The reality on the ground is actually worse.
This past week WTI oil fell 1.4%, while Brent crude was down 1.7% but still held above $102. Natural gas (NG) at the Henry Hub fell 4.7% but NG at the EU Dutch Hub rose 8.43%. That’s your clue. As well, energy stocks rose with the ARCA Oil & Gas Index (XOI) up 2.8% and the TSX Energy Index (TEN) up 2.5%. Are energy stocks leading?
WTI breaks down under $82 but above $105 we could start to soar. NG has support down to $2.60 but leaps above $3.50. NG is basing. WTI is forming what appears to be a bull triangle. The energy stocks remain in a bull uptrend but short of recent all-time highs. We’re following the energy stocks.
Source: www.stlouisfed.org
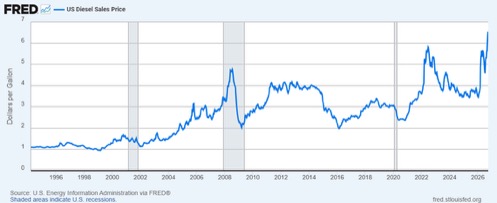
Diesel prices are jumping. Now a new threat is coming in the form of the Trump administration threatening to restrict the export of diesel from the U.S. The trouble is the U.S. is one of the largest suppliers of diesel to the world. Canada, Mexico, the EU, and others depend on export of diesel from the U.S. If this were to happen, then there could be a mad scramble to find diesel, pushing up global prices everywhere. Yes, the U.S. might benefit in the short term. But for the long term?
Diesel runs the global economy. Groceries, transportation, heavy machinery, trucks, tractors, and more depend on diesel. Why is diesel squeezed? Refining capacity has been squeezed, thanks to the war in Iran and in Russia/Ukraine. Bombings of refineries in the Middle East by Iran, the Houthis, and Shia militias in Iraq is one example. The other is Ukrainian bombing of refineries in Russia, which is forcing the Russians to hoard and limit supplies. Russia, like the U.S., is a major exporter, or at least it was.
While Canada and Mexico are vulnerable to the threat, the worst-off might be Europe, who is already being squeezed on natural gas. EU reserves are low. Winter is coming. Asia is less vulnerable, thanks to production in China, South Korea, and elsewhere. Strangely enough, G7 countries including Britain, Japan, Germany, Canada, and the U.S agreed to release 100 million barrels of diesel and crude from strategic reserves over the next four months. That’s odd, considering their reserves are already quite low.
Export controls are beneficial for the U.S. for short-term gain but potentially long-term pain. Releasing reserves is also short-term gain for long-term pain. Reserves are already low. They need to be replenished. Threats continue against Saudi Arabia’s pipelines and refineries, and against Russia’s refineries. All threaten higher oil prices and higher diesel prices.
Copyright David Chapman 2026
GLOSSARY
Trends
Daily – Short-term trend (For swing traders)
Weekly – Intermediate-term trend (For long-term trend followers)
Monthly – Long-term secular trend (For long-term trend followers)
Up – The trend is up.
Down – The trend is down
Neutral – Indicators are mostly neutral. A trend change might be in the offing.
Weak – The trend is still up or down but it is weakening. It is also a sign that the trend might change.
Topping – Indicators are suggesting that while the trend remains up there are considerable signs that suggest that the market is topping.
Bottoming – Indicators are suggesting that while the trend is down there are considerable signs that suggest that the market is bottoming.
Disclaimer
David Chapman is not a registered advisory service and is not an exempt market dealer (EMD) nor a licensed financial advisor. He does not and cannot give individualised market advice. David Chapman has worked in the financial industry for over 40 years including large financial corporations, banks, and investment dealers. The information in this newsletter is intended only for informational and educational purposes. It should not be construed as an offer, a solicitation of an offer or sale of any security. Every effort is made to provide accurate and complete information. However, we cannot guarantee that there will be no errors. We make no claims, promises or guarantees about the accuracy, completeness, or adequacy of the contents of this commentary and expressly disclaim liability for errors and omissions in the contents of this commentary. David Chapman will always use his best efforts to ensure the accuracy and timeliness of all information. The reader assumes all risk when trading in securities and David Chapman advises consulting a licensed professional financial advisor or portfolio manager such as Enriched Investing Incorporated before proceeding with any trade or idea presented in this newsletter. David Chapman may own shares in companies mentioned in this newsletter. Before making an investment, prospective investors should review each security’s offering documents which summarize the objectives, fees, expenses and associated risks. Although Artificial Intelligence (AI) may be deployed from time to time, AI output is monitored and adjusted, if necessary, for accuracy. David Chapman shares his ideas and opinions for informational and educational purposes only and expects the reader to perform due diligence before considering a position in any security. That includes consulting with your own licensed professional financial advisor such as Enriched Investing Incorporated. Performance is not guaranteed, values change frequently, and past performance may not be repeated.
About the author


Website: https://www.enrichedinvesting.com
Disclaimer: David Chapman is not a registered advisory service and is not an exempt market dealer (EMD) nor a licensed financial advisor. We do not and cannot give individualised market advice. David Chapman has worked in the financial industry for over 40 years including large financial corporations, banks, and investment dealers. The information in this newsletter is intended only for informational and educational purposes. It should not be considered a solicitation of an offer or sale of any security. The reader assumes all risk when trading in securities and David Chapman advises consulting a licensed professional financial advisor before proceeding with any trade or idea presented in this newsletter. David Chapman may own shares in companies mentioned in this newsletter. We share our ideas and opinions for informational and educational purposes only and expect the reader to perform due diligence before considering a position in any security. That includes consulting with your own licensed professional financial advisor.