
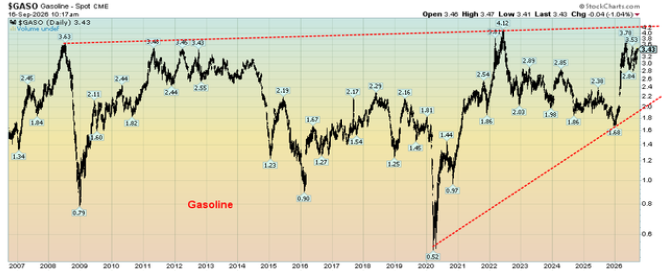
With everyone focused on oil prices, we are overlooking all the products that come from oil. Oil must be refined into products like diesel, gasoline, and more. Refineries have become a target for Iran, the Houthis, and Ukraine. As a result, diesel prices are at record highs, as is heating oil while jet fuel and gasoline are approaching those levels. We have a look.
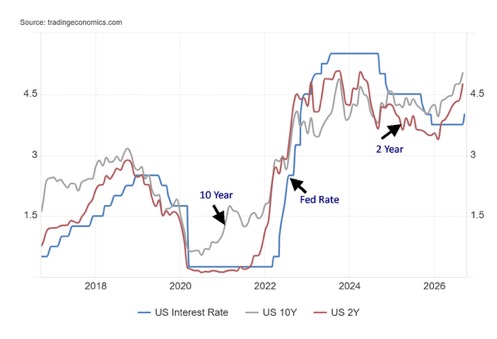
As widely expected, and much to President Trump's chagrin, the Fed unanimously hiked rates this past week. As a result, bond yields jumped higher to the highest level seen since 2007. The cost of numerous products, including mortgages, are headed higher. Canada was one of the few recently that did not hike. The BOJ followed with their own hike, pushing Japanese rates to the highest level in over 30 years. The rate hikes are the subject of our chart of the week.
Rising costs for fuel and rising costs for money are beginning to have a knock-on effect on the stock market. No, the stock market hasn't collapsed but this past week saw the Dow Jones Industrials (DJI), the S&P 400 (Mid), and S&P 600 (Small) give us sell signals. Can the S&P 500 and NASDAQ be far behind?
Gold is still wavering, but despite the higher interest rates and high oil prices gold and silver managed to make gains this past week. Gold stocks were slightly down. Gold still looks like it is coiling for an upside breakout.
Despite the recent rise in oil prices, oil actually faltered this past week. WTI oil hit a resistance zone but only backed off slightly. Regardless, oil prices continue to look higher as the wars rage on with little sign they will end soon. For example, Cenovus Energy Inc., reported increased cash from operating activities, greater excess free funds flow and higher net earnings; it pays a dividend and is held in the Enriched Capital Conservative Growth Strategy.*
That the western economies haven't fallen into recession yet only indicates that there is still a lot of money being spent. But the cracks are there. With interest rates rising, it's a matter of when, not if, the stock market cracks. With rising prices, it's a matter of when, not if, the economy will finally falter. Parts of the economy already feel like it's in a recession. But the well-off aren't feeling it - yet. The AI bubble is wavering, but it hasn't burst.
Fall is in the air. Nicer weather. Have a great week.
DC
* Reference to the Enriched Capital Conservative Growth Strategy and its investments, celebrating an
8.6 - year history of 193% growth (annual 13.33%) to August 31, strong alpha and second August ranking at www.emergingmanagers.ca, is added by Margaret Samuel, President, CEO and Portfolio Manager of Enriched Investing Incorporated, who can be reached at 416-203-3028 or msamuel@enrichedinvesting.com This information should not be construed as an offer, or a solicitation of an offer or sale of any security. Past performance does not guarantee future returns.
“We'll ultimately get out [of Iran], unless we decide to stay and keep the oil like Venezuela.”
—Donald Trump, American politician, businessman, media personality, 45th and 47th president of the United States of America, member Republican party, media host of The Apprentice, has been found liable for sexual abuse, defamation, business fraud, 34 felony counts, has been impeached twice, accused of trying to overturn the results of the 2020 election, resulting in the January 6, 2021 attack on the U.S. Capitol; b: 1946
“It is clear our nation is reliant upon big foreign oil. More and more of our imports come from overseas.”
—George W. Bush, American politician, businessman, 43rd president of the U.S. (2001–2009), member Republican party, Governor of Texas (1995–2000), son of George H.W. Bush, 41st president of the U.S. (1988-1992), born into the prominent Bush family, co-owner of Texas Rangers baseball team, president during the 9/11 attacks (September 11, 2001) and invasion of Iraq (2003), president during the financial crisis and Great Recession (2007–2009); b. 1946
“We simply have to transition from an economy based almost exclusively on oil and coal and natural gas to one that's far more diversified, that uses solar energy, and wind energy, and the power of the tides..."
—William (Bill) Jefferson Clinton, American politician and lawyer, 42nd president of the U.S. (1993–2000), member Democratic party, attorney general Arkansas (1977–1979), Governor Arkansas (1979–1981), (1983–1992), signed the North American Free Trade Treaty with Canada and Mexico; b. 1946
As we watch the price of oil rise, thanks to the ongoing wars between U.S./Iran and Russia/Ukraine, we are reminded that it is not always about oil. Oil is the base, but it’s in the refined products where we really feel the impact of the ongoing wars. The real crisis is not just in rising oil prices but also the refined energy products such as diesel, jet fuel, gasoline, heating oil, and others where we really feel it. Wars have a price and the current ones are no different.
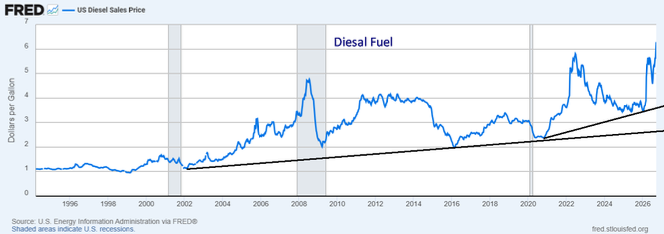
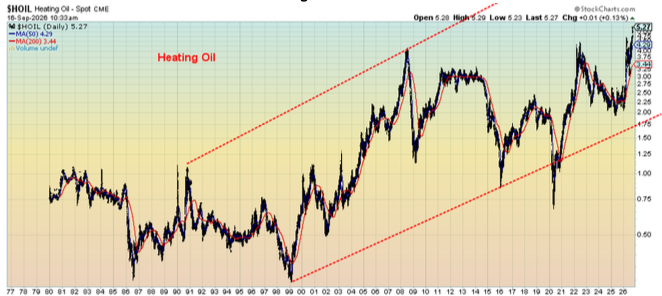
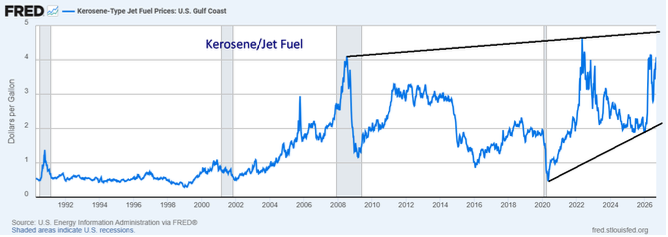
Our series of charts that follow show some of the major refined products such as diesel, kerosene/jet fuel, gasoline, and heating oil. All are in bull markets with no sign of a top, although some are approaching overhead resistance.
Both light and heavy crude oil are refined into products. Refineries are built for both heavy and light crude, but no heavy oil refinery can suddenly replace a light crude refinery or vice versa. They are just too big and are built for specific operations. The cost of re-tooling would be expensive and take time. Hardwares don’t match. Yet refineries have become a target both in the Russia/Ukraine war and in the U.S./Iran war. The Houthis of Yemen have targeted Saudi refineries. While crude oil is available, the attack on refineries is sparking a lack of capacity to refine the oil into the fuels that drive the global economy. That pushes the price of everything up.
Diesel Fuel 1995–2026 ($/gallon)
Source: www.stlouisfed.org
It is estimated that some 5 million barrels/day of refining capacity has already been taken off the market. As noted, the main areas have been the attacks, particularly on Russia by Ukraine and on the Saudis by the Houthis. Iran has also targeted refineries in adjacent Middle Eastern countries. Iraq militias aligned with Iran have attacked Saudi refineries. Russia has attacked gas stations in Ukraine. Russia has restricted exports. Others follow. As a result, exports have collapsed. For example, diesel fuel exports have, according to figures, fallen to barely one-quarter of pre-war levels. Diesel fuel has hit record prices as a result. The real problem is a refining bottleneck, not necessarily the shortage of crude oil. With diesel prices hitting an all-time high, could even the U.S. put on export restrictions? It’s possible.
Gasoline 2006–2026
Source: www.stockcharts.com
All this suggests that with winter approaching, there could be problems, particularly for the EU. Demand for diesel, for example, peaks in Q4 for both heating and industrial transport. Inventories are already depleted. Surplus supplies are being run down. Everybody is competing for a shrinking pool. The U.S. is the world’s largest supplier of refined products, but this concentration alone creates other problems. Could there be a major supply shock? Heating oil is already at record highs. Jet fuel is approaching record highs.
Heating Oil 1980–2026
Source: www.stockcharts.com
Kerosene/Jet Fuel 1990–2026 ($/gallon)
Source: www.stlouisfed.org
While the focus is on the price of crude – WTI for North American crude, Brent for global crude – perhaps the real focus should be on the refinery products. Crude oil is the base. But it’s the refined products that run the global economy. The wars show no signs of ending anytime soon. Things are heating up further between the Houthis and Saudi Arabia and other players are getting involved. There are potential threats to the expansion of the Russia/Ukraine war. There are no easy solutions to any of these conflicts and the odds of a peace deal in any of the conflicts continues to be slim. That means the pressure on oil and even natural gas along with the refined products will continue. Shortages and rationing could occur.
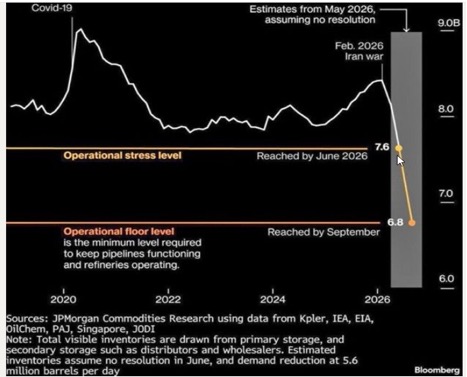
As if the potential for shortages of refined products is not enough the world is also facing plunging inventories of oil. This has a knock off on the refineries as well. Falling inventories can oddly keep the price of refined products down. We’ve noted the low inventory levels of the U.S. The EU inventories are also low. Where are they not low? China.
Source: www.bloomberg.com, www.jpmorgan.com
Chart of the week
U.S. Fed Rate, 10 Year, 2 Year 2016–2026
Source: www.tradingeconomics.com, www.federalreserve.com
They did it. For the first time since 2023, the Fed’s FOMC unanimously hiked the key Fed rate by 25 bp to 4.00%. They were immediately attacked by President Trump who demanded a drop in the key rate to 1%. Key bond yields followed the Fed hike higher as the U.S. 2-year Treasury note was at 4.72%, the 10-year Treasury note at 5.00%, and the 30-year bond yield at 5.35% following the announcement.
Trump’s demand to lower the Fed rate to 1% also included the note that the U.S. has the best credit rating. (At AA+ they don’t, as several countries including Canada hold an AAA credit rating). Fed Chair Kevin Warsh noted that the economy is strong, employment is full, but inflation remains a problem. Monetary conditions are not yet restrictive. But future hikes will not be pre-committed. Fed followers are predicting one more rate hike this year. The market didn’t like it as the Dow Jones Industrials (DJI) fell 600 points and gold gave up its gains following the announcement.
Granted, given the current volatile markets, the next day the stock market and gold rallied back while bond yields eased. Oil prices also fell but that was largely because Saudi Arabia announced they could fix their pipeline faster. They also re-routed some oil through Oman.
Then we saw the latest foreign bond holdings and were somewhat surprised to discover that total holdings fell $50.4 billion in July, the latest release. Yes, fell. They did not go up, despite total U.S. debt rising $309 billion during the month. Japan sold $12.8 billion, China was down $15.4 billion. For China, it’s their lowest holdings since 2008. Picking up some slack was the U.K., up $58.4 billion and more than offsetting Japan and China. Nonetheless, overall, it is not the direction they want to go. Selling off U.S. treasuries puts more pressure on the Fed or others to pick up the slack to continue funding the $1.8 trillion budget deficit. That’s 5.5% of U.S. GDP. With rising interest rates, the interest paid on the debt is only going one way – up.
Rising interest rates feed back into the economy, affecting mortgage rates, credit card rates, lines of credit, car loans, student loans, etc. And lest we forget, state, corporate and municipal borrowing. Savers might benefit, but they are dependent on deposit-taking institutions raising savings rates. The housing market remains moribund with low pending home sales. Rising mortgage rates are not helping.
The Fed can only control the short end of the market. The bond market controls the long end. Despite some short-term gyrations of lower yields, the trend is up. Foreign holders as net sellers is not positive. Others, including hedge funds, are also sellers. They are all demanding a higher yield from the U.S. as the U.S. increasingly is becoming a higher risk. The Fed is hinting that more rate hikes could be on the agenda if inflation doesn’t ease. None of this is positive and puts us on notice that a recession is most likely getting nearer.
Chart of the Week bonus
Japan BOJ Rate, 10-Year Bond 2016–2026
Source: www.tradingeconomics.com, www.boj.or.jp
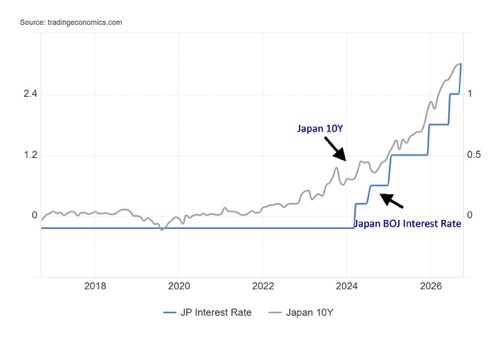
The Fed wasn’t the only one raising key central bank rates this past week. The Bank of Japan (BOJ) also hiked its key interest rate by 25 bp to 1.25%, the highest seen in 31 years. Unlike the BOJ and the Fed, the Bank of England (BOE) left rates unchanged although they left it open as to whether they might hike later. Earlier, the European Central Bank (ECB) hiked. Unlike the FOMC, Japan’s equivalent was not unanimous. The hike was to combat rising prices caused by the wars in the Middle East and Russia/Ukraine. The Japan 10-year is now at 2.99%, again the highest level seen since 1995.
What was unexpected was that the Japanese yen, instead of strengthening, weakened. That’s not the direction either the BOJ or the U.S. Treasury wants to see. More intervention on the part of both may be in the offing.
Markets and Trends
|
|
|
|
% Gains (Losses) Trends |
|
||||
|
|
Close Dec 31/25 |
Close Sep 18/26 |
Week |
YTD |
Daily (Short Term) |
Weekly (Intermediate) |
Monthly (Long Term) |
|
|
|
|
|
|
|
|
|
||
|
S&P 500 |
6,845.50 |
7,650.50 |
(0.1)% |
11.8% |
neutral |
up |
up |
|
|
Dow Jones Industrials |
48,063.29 |
51,682.64 |
(1.7)% |
7.5% |
down |
up |
up |
|
|
Dow Jones Transport |
17,357.19 |
20,079.10 |
(2.7)% |
15.7% |
down |
neutral |
up |
|
|
NASDAQ |
23,241.99 |
26,522.54 |
0.7% |
14.1% |
up (weak) |
up |
up |
|
|
S&P/TSX Composite |
31,712.76 |
35,806.65 |
0.3% |
12.9% |
down |
up |
up |
|
|
S&P/TSX Venture (CDNX) |
987.74 |
923.07 |
(0.5)% |
(6.6)% |
down (weak) |
down |
up |
|
|
S&P 600 (small) |
1,467.76 |
1,690.89 |
(2.0)% |
15.2% |
down |
up (weak) |
up |
|
|
ACWX MSCI World x US |
67.18 |
76.28 |
(1.3)% |
13.6% |
down (weak) |
up |
up |
|
|
Bitcoin |
87,576.98 |
81,167.57 |
4.8% |
(7.3)% |
up |
up (weak) |
neutral |
|
|
|
|
|
|
|
|
|
|
|
|
Gold Mining Stock Indices |
|
|
|
|
|
|
|
|
|
Gold Bugs Index (HUI) |
701.49 |
805.36 |
(1.0)% |
14.8% |
up (weak) |
up (weak) |
up |
|
|
TSX Gold Index (TGD) |
817.76 |
954.05 |
(0.6)% |
16.7% |
up (weak) |
up |
up |
|
|
|
|
|
|
|
|
|
|
|
|
Bonds% |
|
|
|
|
|
|
|
|
|
U.S. 10-Year Treasury Bond yield |
4.17% |
5.00% |
0.4% |
19.9% |
|
|
|
|
|
3.3Cdn. 10-Year Bond CGB yield |
3.44% |
3.88% |
(1.5)% |
12.8% |
|
|
|
|
|
Recession Watch Spreads |
|
|
|
|
|
|
|
|
|
U.S. 2-year 10-year Treasury spread |
0.69% |
0.24% |
(29.4)% |
(65.2)% |
|
|
|
|
|
Cdn 2-year 10-year CGB spread |
0.85% |
0.56%% |
(3.5)% |
(34.1)% |
|
|
|
|
|
|
|
|
|
|
|
|
|
|
|
Currencies |
|
|
|
|
|
|
|
|
|
US$ Index |
98.26 |
100.19 |
1.1% |
2.0% |
up |
up |
neutral |
|
|
Canadian $ |
72.87 |
71.48 |
(0.9)% |
(1.9)% |
down |
down |
down (weak) |
|
|
Euro |
117.48 |
114.90 |
(0.9)% |
(2.2)% |
down |
down |
up |
|
|
Swiss Franc |
126.21 |
121.71 |
(0.6)% |
(3.6)% |
down |
down |
up (weak) |
|
|
British Pound |
134.78 |
133.97 |
(1.0)% |
(0.6)% |
down |
down (weak) |
up |
|
|
Japanese Yen |
63.83 |
63.79 |
(2.0)% |
(0.1)% |
up (weak) |
up (weak) |
down |
|
|
|
|
|
|
|
|
|
|
|
|
Precious Metals |
|
|
|
|
|
|
|
|
|
Gold |
4,311.97 |
4,382.78 |
0.8% |
1.6% |
neutral |
down (weak) |
up |
|
|
Silver |
71.16 |
66.44 |
3.2% |
(6.6)% |
up (weak) |
down |
up |
|
|
Platinum |
2,046.90 |
1,807.90 |
0.4% |
(11.7)% |
up (weak) |
down (weak) |
up |
|
|
|
|
|
|
|
|
|
|
|
|
Base Metals |
|
|
|
|
|
|
|
|
|
Palladium |
1,619.50 |
1,318.00 |
0.2% |
(18.6)% |
down (weak) |
down |
up (weak) |
|
|
Copper |
5.64 |
6.64 |
2.6% |
17.7% |
up (weak) |
up |
up |
|
|
|
|
|
|
|
|
|
|
|
|
Energy |
|
|
|
|
|
|
|
|
|
WTI Oil |
57.44 |
99.46 |
(1.0)% |
73.2% |
up |
up |
up |
|
|
Nat Gas |
3.71 |
2.90 |
2.8% |
(21.8)% |
up (weak) |
down (weak) |
neutral |
|
Source: www.stockcharts.com
* New All-Time Highs
Note: for an explanation of the trends, refer to the glossary at the end of this article.
New highs/lows refer to new 52-week highs/lows and, in some cases, all-time highs.
Stocks
Source: www.stockcharts.com
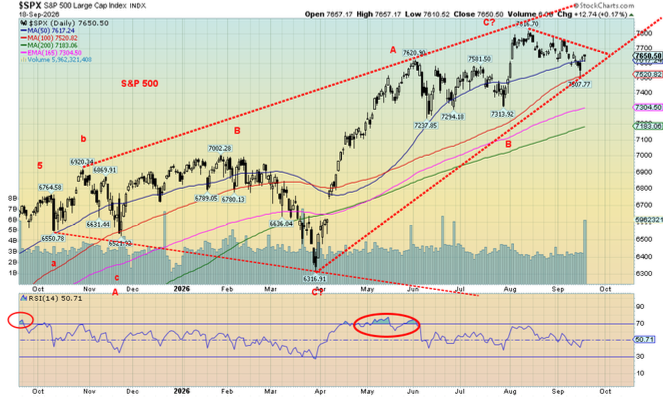
Is the stock market topping? Or does it have even more upside? We lean with the former. The Buffett Indicator is at record highs, valuations are stretched, interest rates are rising, which is normally bad for the stock market, and AI fatigue is setting in. But still the market continues to be resilient. Revenues and profits remain buoyant. It was thought that the market was broadening out, but we note that both the S&P 400 (Mid) and the S&P 600 (Small) are now looking increasingly shaky.
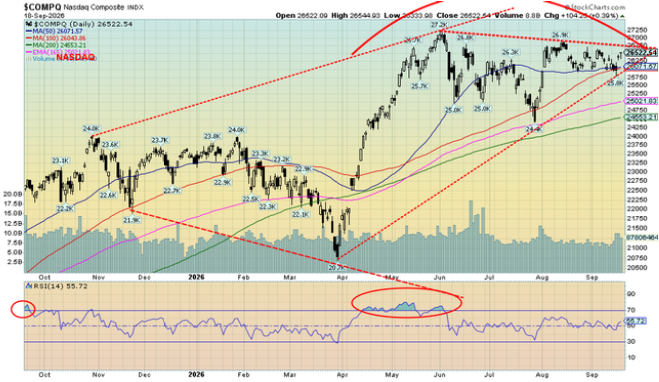
This past week the S&P 500 was off a small 0.1%. The Dow Jones Industrials (DJI) didn’t fare as well, falling 1.7%, and the Dow Jones Transportations (DJT) dropped 2.7%. But the NASDAQ hung in up 0.7%. The NY FANG Index that holds the AI stocks rose 1.0% but the S&P 500 Equal Weight Index fell 1.3%, suggesting that it was the AI and tech stocks that held the market up this past week, even as the broader market fell. If there was a surprise on the week it was Bitcoin that jumped 4.8%, closing over $80,000. The S&P 400 (Mid) fell 1.7% while the S&P 600 (Small) dropped 2.0%.
In Canada, the TSX was up a small 0.3% but the TSX Venture Exchange (CDNX) fell again, down 0.5%. In the EU, the London FTSE was up 0.1%, the EuroNext fell 1.1%, the Paris CAC 40 fell 1.4%, while the German DAX dropped 1.0%. In Asia, China’s Shanghai Index (SSEC) was up 0.6%, the Tokyo Nikkei Dow (TKN) gained 1.6%,
Hong Kong’s Hang Seng (HSI) fell 0.2%, while India’s Nifty Fifty also dropped 0.2%. All in all, it was neither a good week nor a bad week for foreign stock markets. The MSCI World ex USA Index fell 1.3%.
Source: www.stockcharts.com
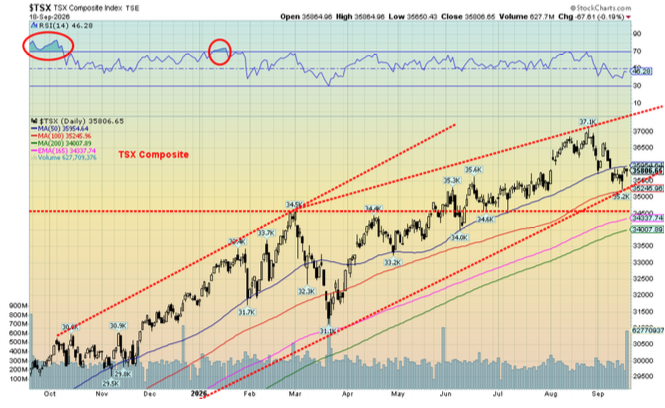
For here as well, it was neither a good week nor a bad week for the stock markets, but the trends are starting to shift to down. The short-term trends of the DJI, DJT, TSX, CDNX, SML, and Mid have all shifted to down, while the weekly trends are weakening but remain up for now. The S&P 500 short-term trend has turned neutral. The leader appears to be the DJI, which has already broken an important support level at 51,500, although it hasn’t fully closed under the level yet. The DJI hit a low of 51,200 but closed above 51,600. Nonetheless, the DJI appears to be leading. We put less stead in the DJT that appears poised to break under its 200-day MA. The DJT is being weighed down by rising fuel prices.
Of the MAG7, four were up this past week and three down. But none made a big move in any direction. The biggest winner on the week was CrowdStrike, up 15% to new all-time highs. The biggest loser was Netflix, down 7.3%. In Canada, six of the sub-indices were up and eight down. Nobody stood out either way. The key subindices Financials (TFS) and Energy (TEN) were up, thus helping the TSX to a small gain.
The stock market continues to roll over but it hasn’t broken. The S&P 500 breaks under 7,500 and especially under 7,300. The NASDAQ breaks under 27,000 but really has to break under 24,000 to get something going to the downside. The risks are out there. The stock market increasingly looks shaky, but it hasn’t broken. Oddly the NASDAQ appears to be potentially forming a head and shoulders bottom. We didn’t label it, but we admit it has the look. Could it be? Only a breakout above 27,000 would end thoughts of a downside break.
We continue in a weak seasonal period that lasts into October, the month of crashes. Negative signs are there but no serious breakdown. The upside looks limited.
Source: www.stockcharts.com
Bonds
Source: www.tradingeconomics.com, www.home.treasury.gov, www.bankofcanada.ca
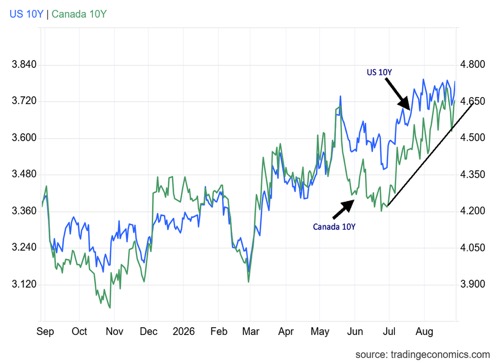
The Fed hiked rates, despite the objections of President Trump, and signaled the potential for more rate hikes. Inflation remains sticky. The U.S. economy hasn’t fallen apart. Foreign buyers are wary and are not buying like they used to. The budget deficits keep growing and the U.S.’s need for funds is voracious. The cost of everything is going to go higher. Longer-dated bond yields have hit the highest level since 2007 and look poised to go even higher. Yet, the market hasn’t panicked yet.
The U.S. 10-year Treasury note closed at 5% this past week, up from 4.98% the previous week. The 30-year Treasury bond was at 5.33%, which is actually down from the previous week’s 5.35%. The 2-year Treasury note was at 4.75%, up from 4.63% as the market is expecting more rate hikes ahead.
All this points to higher rates ahead. Well, maybe not Canada. The Government of Canada bond (CGB) actually fell back to 3.88% this past week, down from 3.94%. Canada held its key bank rate unchanged at its recent interest rate decision. The U.S. hiked rates, and so did Japan and the ECB, although not the BOE. How long can Canada hold out?
Gold and silver
Source: www.stockcharts.com
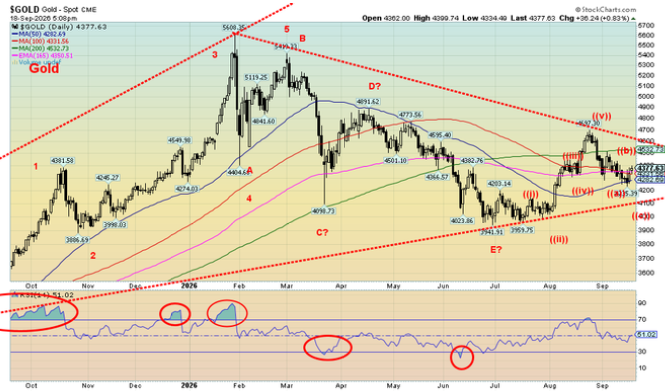
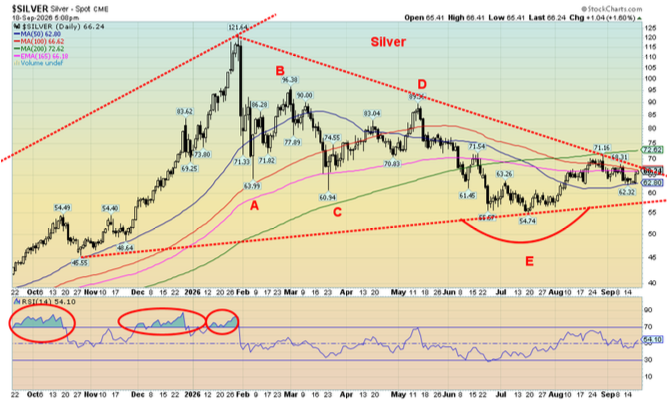
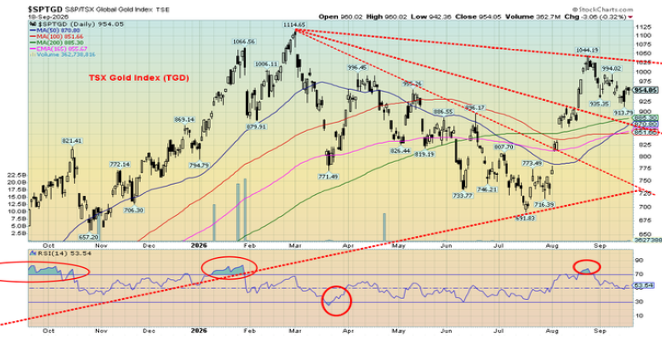
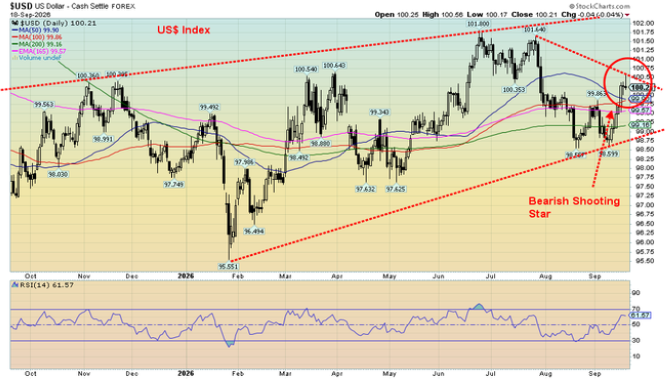
That the Fed raised rates this past week and the 10-year soared to 5.00%, yet gold held up and did not break below $4,200 could be perceived as bullish. Oil prices eased so that helped, but normally rising interest rates are bad for gold. Gold was up 0.8% this past week while silver did even better, up 3.2%. That didn’t save the gold stocks as the Gold Bugs Index (HUI) was down 1.0% and the TSX Gold Index (TGD) was off 0.6%. Both were trying to recover by the week’s end. Not helping gold was a stronger US$ Index; however, even that eased by week’s end as Friday brought a reversal day for the US$ Index and gains for the currencies – Cdn$, euro, Swiss franc, and pound sterling.
The US$ Index gained 1.1% this past week but that was after it reversed on Friday, leaving a bearish shooting star pattern (Japanese candle stick pattern) on the chart. Downside follow-through this coming week is essential if the bearish sign is to be realized. The currencies were bullish on Friday, although the Japanese yen ended the week as the weakest. That wasn’t supposed to be the case after the BOJ hiked interest rates this past week.
Elsewhere, platinum was up 0.4%, palladium gained a small 0.2%, while copper rebounded, up 2.6%. We expect copper to make new all-time highs again soon. The chart remains strongly bullish.
Source: www.stockcharts.com
Both gold and silver continue to form what looks like bottom patterns. They need to break out to confirm. Gold breaks out above $4,600 while silver breaks out above $67, although we’d like to see it get through $73. Gold potentially makes new highs above $5,200 while silver needs to break above $106. Important holds have gold at $4,200 and especially staying above $4,100. For silver, remaining above $62 is positive but if we break under $60 then all bets are off.
The TGD continues to form what looks like a fan pattern. We need to break above 1,030 to suggest higher. Above 1,060 suggests new highs. What’s key is to hold above 900. Under 870 spells trouble.
The precious metals are in a mixed period right now. We could rally or we could just stagnate. Lows are often seen in December; however, November would be just as good. The positive period doesn’t normally get underway until December. Recall that we made our high for the year in January 2026, although we’ve seen these highs hold on to February or even early March.
Gold was resilient in the face of Fed hikes and rising interest rates. The debt is not going to go down, the budget deficits are getting bigger, geopolitics remain in conflict, and a contentious U.S. election is coming up. Gold’s downside is limited, but its upside remains positive.
Source: www.stockcharts.com
Source: www.stockcharts.com
Oil and gas
Source: www.stockcharts.com
Panic one week led to a calmer assessment the next week. The panic was that Saudi Arabia’s supply was being blocked at the East-West Pipeline to the Red Sea from bombings by both the Houthis of Yemen and Iraqi militias loyal to Iran. Oil prices jumped. This past week, Saudi pivoted to the Persian Gulf in order to at least satisfy Asian buyers. European buyers? Not so much as the EU could be facing a cut-off from Saudi Arabia. In any case, it didn’t say how they propose on getting through the Strait of Hormuz.
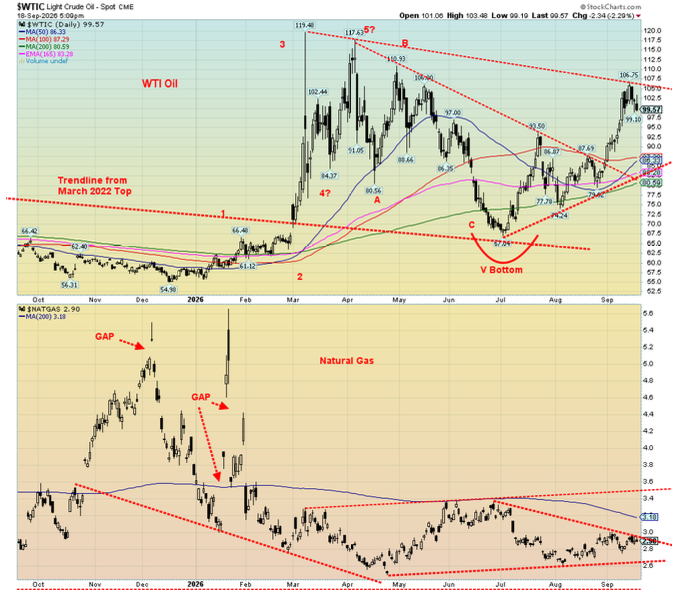
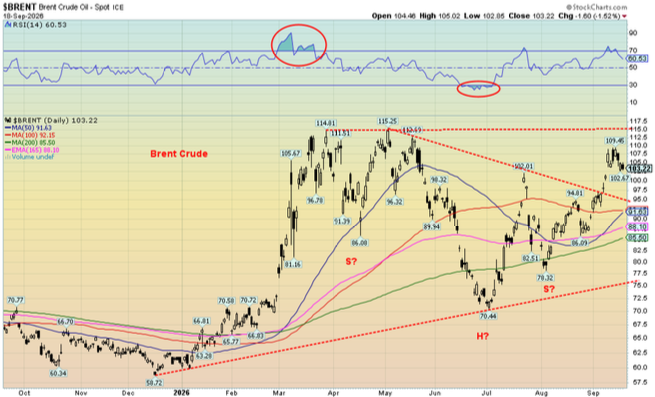
We suppose how to get through the Strait of Hormuz comes later. But it worked and both WTI oil and Brent crude eased this past week. WTI fell 1.0% while Brent was off 1.6%. For whatever reason, natural gas (NG) at the EU Dutch Hub eased as well, off 1.5%. However, at the Henry Hub in North America NG was up 2.8%. The energy stocks were more or less flat, but the ARCA Oil & Gas Index (XOI) did make slightly new all-time highs, up 0.6%, and the TSX Energy Index (TEN) gained 0.4%. All in all, a quiet week.
We were looking for $105 for WTI as resistance. WTI hit a high of $106.75, but it couldn’t hold and closed down at $99.57, suggesting that the $105 level is resistance. Nonetheless, it emphasizes that now WTI must break above $107 and hold above there to suggest higher prices. Once through, potential targets could be as high as $160. However, further resistance can be seen at $120. As to Brent, it has made what looks like an awkward head and shoulders bottom pattern. It’s awkward because the right shoulder went lower than the left shoulder, which is not a classic head and shoulders pattern. Nonetheless, we’ll go out on a limb and suggest that the target could be up to $142. A firm break above $115 resistance could suggest a move as high as $160.
Source: www.stockcharts.com
No matter how we look at it, the patterns for oil remain bullish. We just have to break above resistance zones. With the situation in the Middle East firmly on a war footing, the trend can only be one way and that is up. Ditto for the Russia/Ukraine conflict that continues to suggest it could expand to include NATO countries given accusations that Russia is shooting drones over NATO countries. If NATO were to get involved in the war, then we’d be in WW3.
NG also looks bullish as it continues to make what appears as a bottoming pattern. First, we need to establish above $3, but the real breakout occurs over $3.50. EU NG is in a solid uptrend with no sign of a top. Positive seasonals begin to take over in December and last until at least June.
We also note that U.S. commercial oil reserves remain down around five-year lows. They need replenishing. Meanwhile, China has managed to replenish its reserves and is in a much better position to withstand Middle East and Russia/Ukraine shocks. Some claim that now China has become an energy powerhouse. China is the world’s fifth largest producer and holds the 13th largest reserves. As to NG, China is the world’s fourth largest producer and holds the eighth largest reserves. China also gets a lot of oil from Russia that comes through overland pipelines. China also gets oil from sanctioned countries like Venezuela, but it comes in unmarked tankers. China also has large refining capabilities. With large built-up reserves, China could be considered the world’s largest global energy powerhouse.
Setting aside China, it’s the rest of the world that needs to be concerned about supply. And that alone should help keep oil prices elevated.
Copyright David Chapman 2026
GLOSSARY
Trends
Daily – Short-term trend (For swing traders)
Weekly – Intermediate-term trend (For long-term trend followers)
Monthly – Long-term secular trend (For long-term trend followers)
Up – The trend is up.
Down – The trend is down
Neutral – Indicators are mostly neutral. A trend change might be in the offing.
Weak – The trend is still up or down but it is weakening. It is also a sign that the trend might change.
Topping – Indicators are suggesting that while the trend remains up there are considerable signs that suggest that the market is topping.
Bottoming – Indicators are suggesting that while the trend is down there are considerable signs that suggest that the market is bottoming.
Disclaimer
David Chapman is not a registered advisory service and is not an exempt market dealer (EMD) nor a licensed financial advisor. He does not and cannot give individualised market advice. David Chapman has worked in the financial industry for over 40 years including large financial corporations, banks, and investment dealers. The information in this newsletter is intended only for informational and educational purposes. It should not be construed as an offer, a solicitation of an offer or sale of any security. Every effort is made to provide accurate and complete information. However, we cannot guarantee that there will be no errors. We make no claims, promises or guarantees about the accuracy, completeness, or adequacy of the contents of this commentary and expressly disclaim liability for errors and omissions in the contents of this commentary. David Chapman will always use his best efforts to ensure the accuracy and timeliness of all information. The reader assumes all risk when trading in securities and David Chapman advises consulting a licensed professional financial advisor or portfolio manager such as Enriched Investing Incorporated before proceeding with any trade or idea presented in this newsletter. David Chapman may own shares in companies mentioned in this newsletter. Before making an investment, prospective investors should review each security’s offering documents which summarize the objectives, fees, expenses and associated risks. Although Artificial Intelligence (AI) may be deployed from time to time, AI output is monitored and adjusted, if necessary, for accuracy. David Chapman shares his ideas and opinions for informational and educational purposes only and expects the reader to perform due diligence before considering a position in any security. That includes consulting with your own licensed professional financial advisor such as Enriched Investing Incorporated. Performance is not guaranteed, values change frequently, and past performance may not be repeated.
About the author


Website: https://www.enrichedinvesting.com
Disclaimer: David Chapman is not a registered advisory service and is not an exempt market dealer (EMD) nor a licensed financial advisor. We do not and cannot give individualised market advice. David Chapman has worked in the financial industry for over 40 years including large financial corporations, banks, and investment dealers. The information in this newsletter is intended only for informational and educational purposes. It should not be considered a solicitation of an offer or sale of any security. The reader assumes all risk when trading in securities and David Chapman advises consulting a licensed professional financial advisor before proceeding with any trade or idea presented in this newsletter. David Chapman may own shares in companies mentioned in this newsletter. We share our ideas and opinions for informational and educational purposes only and expect the reader to perform due diligence before considering a position in any security. That includes consulting with your own licensed professional financial advisor.