
Inflation remains a problem following the release of the July PCE numbers. Is the U.S. economy slowing following the release of Q2 GDP numbers which fell from the previous reading? Stagflation? It's not being said but it is a real possibility. Fed Chair Kevin Warsh mused about inflation at the Jackson Hole symposium. But he didn't come right out and say what he'd do about it. However, the market responded by raising the odds of a rate hike at the September 15-16 FOMC. Stock markets wobbled, the US$ Index jumped higher, interest rates rose, especially in the 2-year and gold was "smacked".
Canada also reported its Q2 GDP, which was stronger than many expected. Is the Canadian economy improving despite the background of the U.S./Canada trade war? Resultant inflationary pressures are likely to benefit retail companies such as George Weston Limited with preserved margins and close CPI tracking, which reported increased revenue and higher Adjusted EBITDA margin, pays a dividend and is held in the Enriched Capital Conservative Growth Strategy.* The announcement of more tariffs triggered a tit-for-tat response from the Canadian government. Auto and auto parts companies were hit hard, falling on the news. Auto manufacturing and auto parts manufacturing could be especially victimized by the trade war. Martin Rea, a Canadian auto parts company, fell. We use Martin Rea as a poster child for Canada's auto industry; it is featured in our chart of the week.
The crisis in the Mid-East continues with the U.S. announcing new sanctions on Iran and threatening any country that dares to trade with Iran. That's not going over very well.
For the week the stock market wobbled, interest rates fell then rose again, the US$ Index jumped while currencies fell, and gold was "whacked". But given the U.S. has $40 trillion in debt and there is $353 trillion of debt globally; we and others believe the potential for a debt crisis is real and the risk is rising. Holding gold is a counterbalance. The pullback for gold is temporary.
A thought for the victims of the disaster in Nepal. Some 3-dozen Canadians and upwards of 100 Americans are believed missing and could be amongst the victims. Hundreds, maybe more are missing.
The weather is cooling. A slight hint of autumn in the air? Have a great week.
DC
* Reference to the Enriched Capital Conservative Growth Strategy and its investments, celebrating an
8.5 - year history of 208% growth (annual 14.16%) strong alpha and top July ranking at www.emergingmanagers.ca, is added by Margaret Samuel, President, CEO and Portfolio Manager of Enriched Investing Incorporated, who can be reached at 416-203-3028 or msamuel@enrichedinvesting.com This information should not be construed as an offer, or a solicitation of an offer or sale of any security. Past performance does not guarantee future returns.
“Even in the 1950s, President Eisenhower was concerned about what he called a campaign of hatred of the U.S. in the Arab world, because of the perception on the Arab street that it supported harsh and oppressive regimes to take their oil.”
—Noam Chomsky, American intellectual, philosopher, political activist, linguist, social critic, referred to as “the father of modern linguistics,” critic of U.S. foreign policy, author of Requiem for the American Dream (2017) and others; b. 1928
“The fossil fuel industry commands outsize sway over U.S. politics, markets, and democracy. I knew these companies were formidable, but when I served on the National Commission on the BP Deepwater Horizon Oil Spill and Offshore Drilling, I got a close-up view of how the industry disregards government safeguards.”
—Frances Beinecke, American environmental activist, president Natural Resources Defense Council (2006–2015); b. 1949
“Supply chains cannot tolerate even 24 hours of disruption. So if you lose your place in the supply chain because of wild behavior you could lose a lot. It would be like pouring cement down one of your oil wells.”
—Thomas Friedman, American political commentator, author, three-time Pulitzer Prize winner, columnist for The New York Times, author From Beirut to Jerusalem (1989) and others; b. 1953
Stagnation/stagflation?
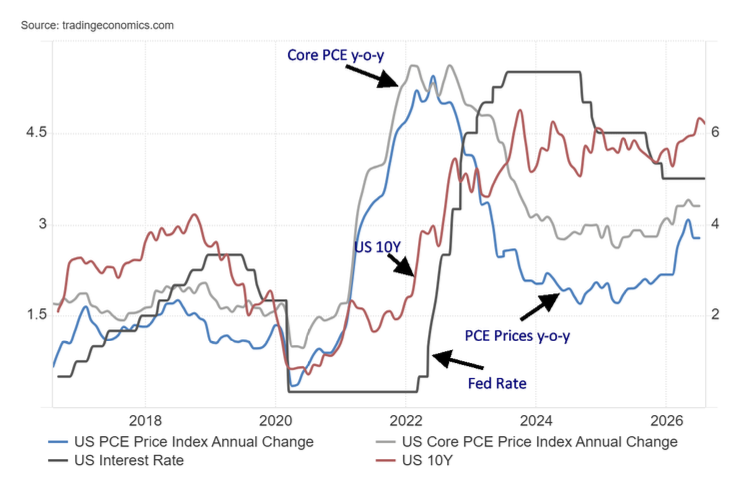
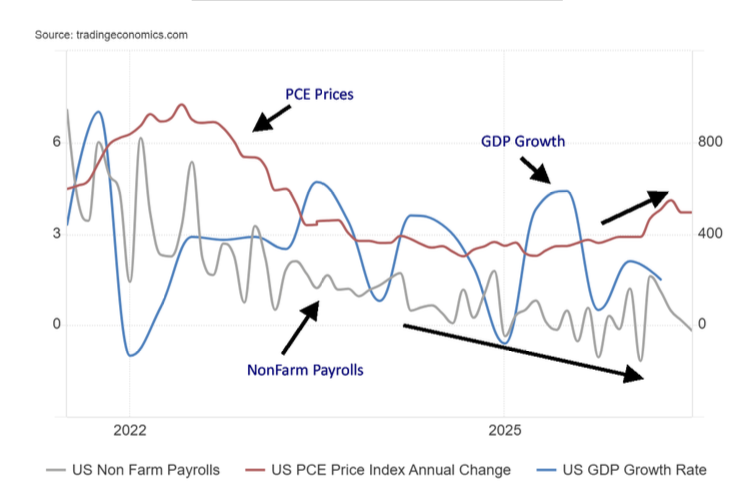
The Federal Reserve is in a bind. (See also our comments on Warsh at Jackson Hole). The release of the July Personal Consumption Expenditures (PCE) prices came in at 3.7% year over year. The expectation was that it would fall to 3.6%. The core PCE came in at 3.3%, which was at least on expectations. Then came the second read for Q2 GDP. The previous read was a gain of 2.1%. The latest? It fell to 1.5%. The good news was that it was as expected. The July non-farm payrolls came in with job losses of 23,000. They revised the two previous months down by 103,000. Still, the U.S. has created 426,000 jobs to date in 2026 or roughly 60,800/month. The trouble is that the pace is below previous levels. The good news is that it is roughly in line with what is needed, given slower population growth and an aging population retiring. The labour force has fallen, thanks to deportations. But then the jobs they held are now open.
With PCE prices almost double the Fed’s target of 2% and signs that the economy is slowing down, it suggests we could be entering a period of stagflation: i.e., slow growth with continued higher inflation. Wages need to keep up. Average hourly earnings were last reported as up 3.2% for July 2026. That’s below the rate of inflation that stands at 3.4% last.
The core inflation rate is confusing as it excludes food and energy, two essentials. Against this backdrop, the U.S. government continues to borrow. It has annual deficits of between $1.6 trillion and $2 trillion, some 6.5% of GDP – the highest amongst the G7 countries.
PCE Prices, Core PCE, U.S. 10-year, Fed Rate 2016–2026
Source: www.tradingeconomics.com, www.bea.gov, www.federalreserve.gov
The U.S. needs to raise money. Lots of it. Maturities plus new spending. But not helping is that foreigners are not buying or even selling U.S. debt. Confidence in U.S. debt is waning. The U.S. dollar is falling. It’s debasement of the currency. Not helping as well are the ongoing demands from the AI companies. It’s leading to crowding out. Into the fray comes Scott Bessent and the U.S. Treasury. They are doing a version of Operation Twist by buying long-dated maturities and selling short-dated maturities. That initially helped long rates to fall, but then they rose again. The U.S. pays out over $1.1 trillion in interest payments on its $40 trillion in debt, now the third-highest expenditure behind Social Security and Medicare/Medicaid.
A problem. Operations being carried out by the U.S. Treasury are usually under the purview of the Federal Reserve. That keeps President Trump happy as he wants lower rates. But it is meddling in the market. Manipulation. Suppression of rates. And that is not going to make bond buyers happy. Will they revolt? Or will Trump actually unleash the military on bond vigilantes as he declared? To help buy back the long-dated treasuries, Bessent is tapping into The Treasury General Account (TGA) held at the Federal Reserve. Think of it like a chequing account for the U.S. Treasury. If they do that instead of issuing short-term debt, then the fund will quickly be depleted or at least seriously dented. Then what? The fund is estimated to be roughly $900–$950 billion. It doesn’t matter as, while the 30-year initially fell from 5.27% to 5.16%, it is creeping back up. It’s all being met with skepticism.
GDP Growth, NonFarm Payrolls, PCE Prices 2021–2026
Source: www.tradingeconomics.com, www.bea.gov, www.bls.gov
We have sticky inflation. A slowing economy. And, oh yes, trade wars, especially the recent unleashing of a trade war with Canada. That’s probably going to negatively impact inflation because of higher prices and slow the economy further with job losses on both sides of the border. All this equals stagflation.
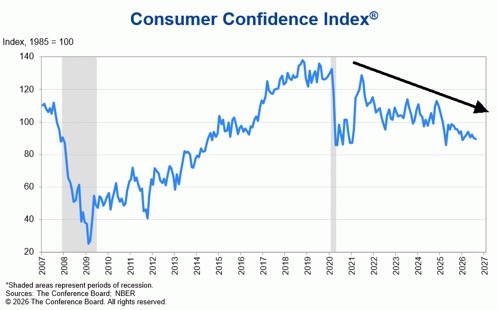
Is it any surprise that we are seeing consumer confidence falling? The latest release from the Conference Board showed that consumer confidence for August fell to 89.4 from 90.2 in July. The expectations index also fell while inflation expectations rose. Falling confidence in the economy, rising inflation.
Is this a 1970s stagflation redux? Maybe. Although it will be different. Recall, the 1970s were not good for stocks but they were excellent for gold, oil, and other commodities. It was also not a good period for the U.S.
dollar as it fell steadily throughout the decade. It’s not as if the U.S. were the only one in this pickle. High unsustainable debts, slowing economies, and aging populations are all characteristics of the major powers – U.S., Canada, the EU, and Japan. A crisis is coming. We don’t know when or what might cause it, but a financial crisis is almost assured. It is noteworthy that the American consumer doesn’t appear to be paying attention.
Source: www.conference-board.org
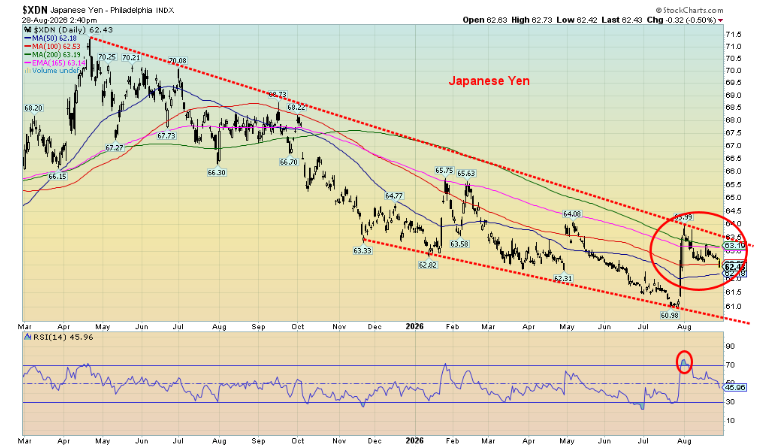
Lest we forget, the Japanese yen ¥ is once again falling. That’s after numerous interventions by both the BOJ (Bank of Japan) and the U.S. Treasury. Note: not the Fed. The BOJ is using a facility set up with the Fed whereby they borrow US$ to sell for yen while putting up collateral in the form of U.S. treasuries. The U.S.’s intervention involves selling euros for yen. The yen responded with a quick pop, but now it appears to be petering out. It ran smack into resistance of that downtrend line from highs seen in April 2025. That the yen is falling again tells us that further intervention will be necessary. It was the first joint U.S./Japan intervention since 1998.
There is a big problem in Japan as we have noted before. Too much debt, too-slow growth, an aging population, and it imports practically all its energy requirements. As if the U.S. Treasury doesn’t have enough problems at home, they must get involved in trying to save the yen as well. So far, it doesn’t appear to be working. And that is a problem. No, Japan is not yet in a financial crisis, but it is headed that way. As if there aren’t enough problems. And we didn’t even mention the EU.
Source: www.stockcharts.com
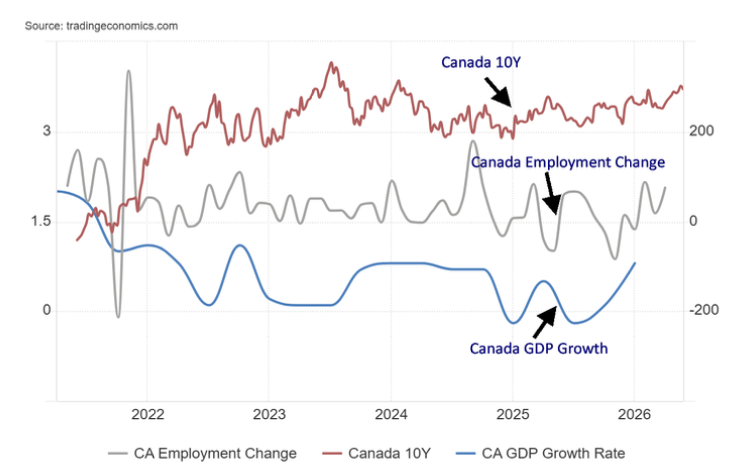
Canada growth rate
Canada GDP Growth Rate, Employment Change, 10Y Bond 2021–2026
Source: www.tradingeconomics.com, www.statcan.gc.ca
Canada’s economy unexpectedly grew at a 3.3% annualized rate in Q2 2026. It’s the fastest pace since Q3 2024. The rate for Q2 was 0.8%. However, if we combine Q1 growth Canada is still headed for growth but it drops to 1.8% annualized. Exports led the way, but household spending and capital investment helped. Combined with the unexpected jump in employment for July, the Canadian economy is doing much better than many expected.
Yes, inflation is a problem at 3%, but that remains below the U.S. rate at 3.4%. Canada’s 10-year Government of Canada bond (CGB) also trades some 1% below the U.S. rate. Canada’s employment picture is also better. As well, Canada’s Bank of Canada (BofC) rate is 1.5% lower than that of the U.S. and Canada’s debt to GDP is much lower than the U.S. at around 40% vs. 123%. Note: that’s just federal debt. The figure widely quoted includes provincial debt which is more significant than the U.S.’s state debt.
Granted, all this comes before the latest salvo in the Canada/U.S. trade war. It is still too early to tell whether the current trend can continue or will Canada (and the U.S.) suffer a significant setback. But it is encouraging.
Jackson Hole – Warsh speaks
He came to Jackson Hole, Wyoming. He spoke. Yes, Fed Chair Kevin Warsh gave his speech at Jackson Hole. As might have been expected, there was little clarity in the speech. He acknowledged that inflation remains sticky and above the Fed target of 2%. He said the Fed has “work to do” to get inflation down to the 2% target. Does that mean he’ll hike rates? Maybe or maybe not. The market seemed to interpret it as if he will raise rates. If he doesn’t want to face the ire of President Trump as his predecessor did, raising rates is maybe not the wisest idea. But the market doesn’t care. The 10-year U.S. Treasury note ticked higher to 4.70% before falling back. Warsh noted that PCE prices and the CPI are marginally better but nowhere near where they want them.
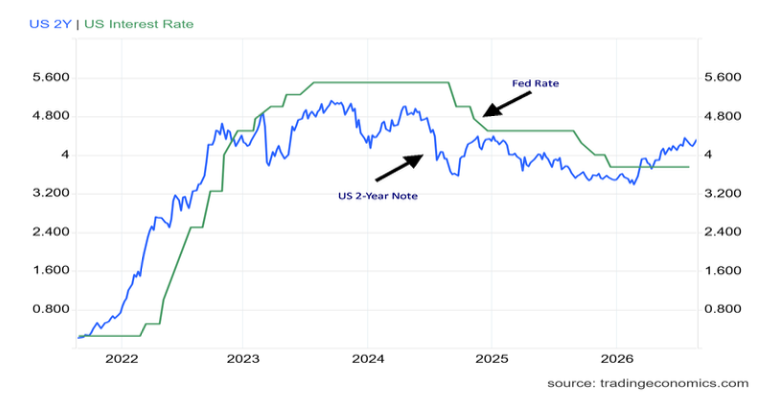
Nonetheless, markets priced in a 50% chance of a September rate hike (Fed meeting September 15–16). The 2-year Treasury note jumped 7 bp to 4.30%. As we have often said, Warsh is caught between a rock and hard place. The trade wars may add to his woes. Forward guidance is a thing of the past. Markets responded negatively as gold and stocks were hit, particularly gold. The US$ Index jumped.
U.S. 2-year Treasury note, Fed rate 2021–2026
Source: www.tradingeconomics.com, www.federalreserve.gov
Meeting of the Central Bankers at Jackson Hole, Wyoming August 2026

Source: www.reuters.com – Tiff Macklem, Governor Bank of Canada, Kevin Warsh, Chairman Federal reserve, Andrew Bailey, Governor Bank of England – at Jackson Hole
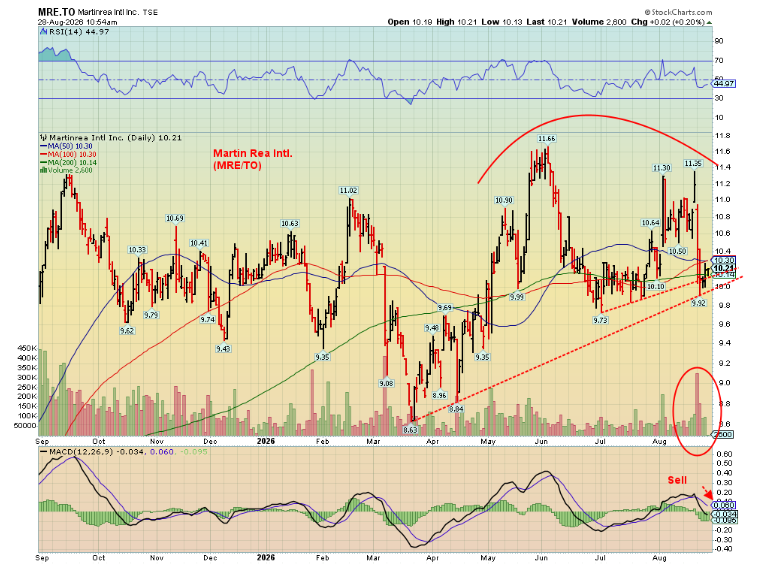
Chart of the week
Source: www.stockcharts.com
We are using Martin Rea (MRE/TSX) as the poster child for the automotive industry, which has come under attack from Trump’s tariffs. Martin Rea is an auto parts supplier. They are not even the largest with a market cap of roughly $750 million. Much larger are Magna International (MG/TSX) with a market cap of $24.4 billion and Linamar (LNR/TSX) with a market cap of $5.7 billion. Other auto parts suppliers include Exco Technologies (XTC/TSX) and Westport Fuels Systems (WPRT/TSX). Martin Rea is a part of the TSX Small Cap Index whereas MG and LNR are a part of the TSX Consumer Discretionary Index (TCS). In the scheme of things, they seem small but are nonetheless important in the auto parts industry, which will be negatively impacted by the tariffs. There is no known ETF for auto and auto parts companies in Canada.
Trump's proposed and active tariffs heavily target Canadian-made cars, trucks, imported steel, aluminum, and upcoming auto parts, threatening to upend the tightly integrated North American automotive supply chain. It impacts automobiles, parts, steel and metal and manufacturing, and assembly. It disrupts the integrated cross-border supply chain that includes Mexico. Companies impacted include Ford Motor (F), General Motors (GM), Stellantis, and even Honda and Toyota, given that roughly 10% of their vehicles are exported to the U.S.
To different extents, the charts for each of these companies are similar to MRE, even as MRE appears to be the worst. MRE is breaking down from what appears to be a double top. Once under $9.90, targets could be down around $8. It’s not as if MRE has been a big winner, returning 1.2% over the past year and actually negative 0.3% since 1998. MRE does have a dividend with roughly a 2.0% yield.
Nonetheless, MRE is an important parts supplier, exporting to the U.S. Supply chains center around parts, plants, and production. Companies operate on tight margins. If parts and prices go up, it’s added to the vehicle, or they decide it’s not worth producing any longer. Putting tariffs on parts in a North American integrated system is just mutual destruction. It impacts all the companies that operate in that sector. Martin Rea is just the poster child.
Markets and Trends
|
|
|
|
% Gains (Losses) Trends |
|
||||
|
|
Close Dec 31/25 |
Close Aug 28/26 |
Week |
YTD |
Daily (Short Term) |
Weekly (Intermediate) |
Monthly (Long Term) |
|
|
|
|
|
|
|
|
|
||
|
S&P 500 |
6,845.50 |
7,711.76 |
0.5% |
12.7% |
up |
up |
up |
|
|
Dow Jones Industrials |
48,063.29 |
53,559.99 |
0.5% |
11.4% |
up |
up |
up |
|
|
Dow Jones Transport |
17,357.19 |
21,378.75 |
(0.9)% |
23.2% |
down |
up |
up |
|
|
NASDAQ |
23,241.99 |
26,402.22 |
0.9% |
13.6% |
up |
up |
up |
|
|
S&P/TSX Composite |
31,712.76 |
36,553.92 |
(0.2)% |
15.3% |
up |
up |
up |
|
|
S&P/TSX Venture (CDNX) |
987.74 |
989.16 |
0.1% |
0.1% |
up |
neutral |
up |
|
|
S&P 600 (small) |
1,467.76 |
1,767.57 |
(1.2)% |
20.4% |
neutral |
up |
up |
|
|
ACWX MSCI World x US |
67.18 |
77.62 (new highs) * |
(0.4)% |
15.5% |
up |
up |
up |
|
|
Bitcoin |
87,576.98 |
77,549.59 |
0.7% |
(11.5)% |
up |
neutral |
neutral |
|
|
|
|
|
|
|
|
|
|
|
|
Gold Mining Stock Indices |
|
|
|
|
|
|
|
|
|
Gold Bugs Index (HUI) |
701.49 |
839.51 |
(2.8)% |
19.7% |
up |
up |
up |
|
|
TSX Gold Index (TGD) |
817.76 |
988.58 |
(2.2)% |
20.9% |
up |
up |
up |
|
|
|
|
|
|
|
|
|
|
|
|
Bonds% |
|
|
|
|
|
|
|
|
|
U.S. 10-Year Treasury Bond yield |
4.17% |
4.72% |
(0.4)% |
13.2% |
|
|
|
|
|
3.3Cdn. 10-Year Bond CGB yield |
3.44% |
3.73% |
(0.8)% |
8.4% |
|
|
|
|
|
Recession Watch Spreads |
|
|
|
|
|
|
|
|
|
U.S. 2-year 10-year Treasury spread |
0.69% |
0.37% |
(26.0)% |
(46.4)% |
|
|
|
|
|
Cdn 2-year 10-year CGB spread |
0.85% |
0.72% |
flat |
(15.3)% |
|
|
|
|
|
|
|
|
|
|
|
|
|
|
|
Currencies |
|
|
|
|
|
|
|
|
|
US$ Index |
98.26 |
99.66 |
0.8% |
1.4% |
down |
neutral |
neutral |
|
|
Canadian $ |
72.87 |
71.91 |
(1.0)% |
(1.3)% |
up |
up |
down (weak) |
|
|
Euro |
117.48 |
115.86 |
(0.8)% |
(1.4)% |
up |
neutral |
up |
|
|
Swiss Franc |
126.21 |
123.56 |
(1.0)% |
(2.1)% |
up |
down |
up |
|
|
British Pound |
134.78 |
135.38 |
(0.8)% |
0.5% |
up |
up |
up |
|
|
Japanese Yen |
63.83 |
62.47 |
(0.7)% |
(2.1)% |
up (weak) |
down (weak) |
down |
|
|
|
|
|
|
|
|
|
|
|
|
Precious Metals |
|
|
|
|
|
|
|
|
|
Gold |
4,311.97 |
4,460.24 |
(3.4)% |
3.4% |
up |
neutral |
up |
|
|
Silver |
71.16 |
66.38 |
(4.3)% |
(6.7)% |
up |
down (weak) |
up |
|
|
Platinum |
2,046.90 |
1,832.10 |
(3.3)% |
(10.5)% |
up |
down (weak) |
up |
|
|
|
|
|
|
|
|
|
|
|
|
Base Metals |
|
|
|
|
|
|
|
|
|
Palladium |
1,619.50 |
1,422.00 |
5.3% |
(12.2)% |
up |
down (weak) |
up (weak) |
|
|
Copper |
5.64 |
6.54 |
(0.5)% |
16.0% |
up |
up |
up |
|
|
|
|
|
|
|
|
|
|
|
|
Energy |
|
|
|
|
|
|
|
|
|
WTI Oil |
57.44 |
83.42 |
(3.7)% |
45.2% |
up (weak) |
neutral |
up |
|
|
Nat Gas |
3.71 |
2.87 |
4.4% |
(22.6)% |
neutral |
down |
down (weak) |
|
Source: www.stockcharts.com
* New All-Time Highs
Note: for an explanation of the trends, see the glossary at the end of this article.
New highs/lows refer to new 52-week highs/lows and, in some cases, all-time highs.
Stocks
Source: www.stockcharts.com
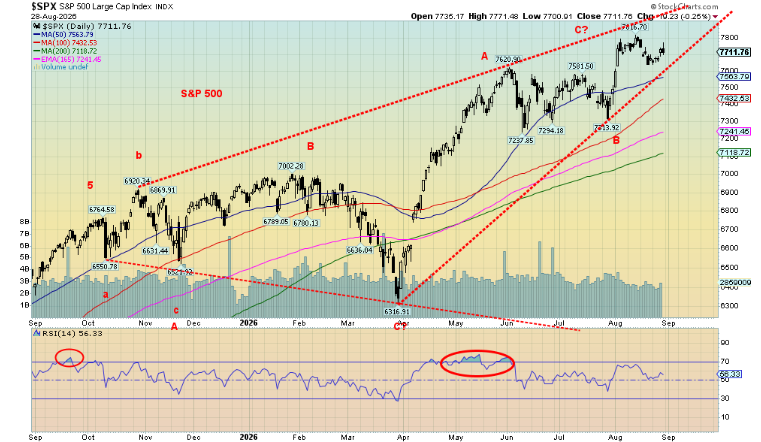
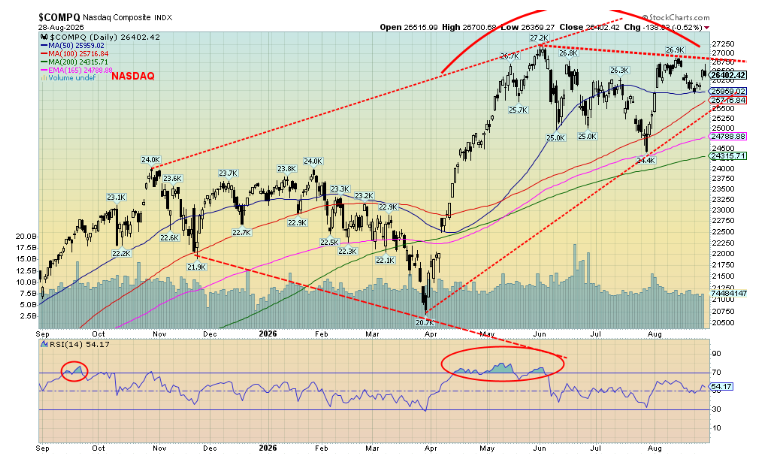
Stocks were mostly mixed this past week. Earlier gains were mostly wiped out by Friday, following Warsh’s Jackson Hole speech, which suggested a hike in interest rates was possible. On the week, the S&P 500 finished up 0.5% as did the Dow Jones Industrials (DJI), while the Dow Jones Transportations (DJT) fell 0.9%. The NASDAQ did jump 0.9% as many of the MAG7 were up, with Nvidia reporting blowout revenues.
Others didn’t fare as well. The S&P 400 (Mid) fell 1.3% while the S&P 600 (Small) dropped 1.2%. The S&P 500 Equal Weight Index fell 0.5% but the NY FANG Index made all-time highs, up 2.5%. Six of the seven MAG7 were up on the week, led by Microsoft, gaining 6.2%. Tesla was the only loser, down 3.9%. The big winner was CrowdStrike, up 13.6% and making all-time highs. Bitcoin gained 0.7%.
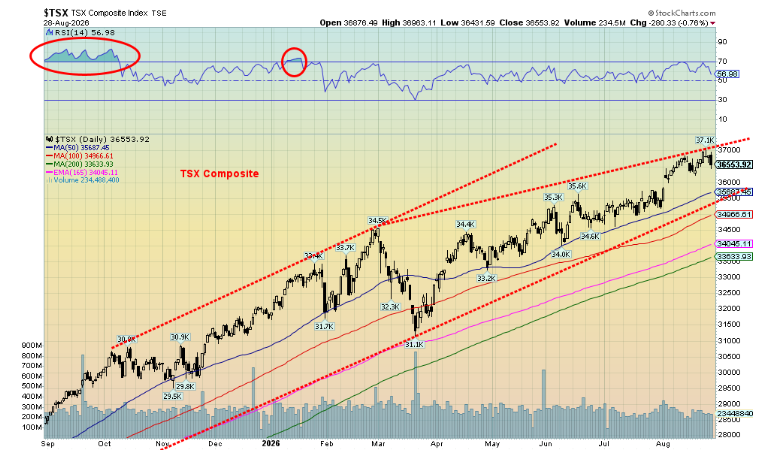
In Canada, the TSX Composite faded, down 0.2%, while the TSX Venture Exchange (CDNX) eked out a 0.1% gain. Of the 14 TSX subindices, only two were up but those two were the top-weighted Financials (TFS), up 1.5%, and Information Technology (TTK), up 2.8%. Leading the way down was Energy (TEN), off 2.9%, while Golds (TGD) dropped 2.1%. The two high-weighted TFS and TTK helped keep the TSX from falling further.
In the EU, the London FTSE was up 0.1%, the EuroNext fell 0.6%, the Paris CAC 40 was off 1.0%, but the German DAX made all-time highs, up 1.7%. In Asia, China’s Shanghai Index (SSEC) was up 1.2%, the Tokyo Nikkei Dow (TKN) gained 0.6%, but Hong Kong’s Hang Seng (HSI) fell 1.6%. India’s Nifty Fifty was down 0.3%. The MSCI World ex USA Index made all-time highs but closed down 0.4%.
Source: www.stockcharts.com
The S&P 500 looks increasingly vulnerable, but there are no sell signals yet. A drop under 7,600 suggests lower, but a drop under 7,300 suggests a top is in. Under 7,200 a top is confirmed. Notably, while the S&P 500 and the DJI earlier jumped to new highs, the NASDAQ did not, a divergence. The NASDAQ is vulnerable under 26,000 but we can’t confirm a top until under 24,400. New highs would, of course, eliminate any thoughts of a drop. But we noted September is the weakest month and divergences and dying momentum all suggest a decline is more likely than new highs. We just can’t rule that out until we get confirmations of a top.
The S&P 500 still looks like it’s forming an ascending wedge triangle, which is bearish. The NASDAQ as well, but it is not as clear. The triangle on the S&P 500 breaks under 7,550. For the NASDAQ, the break comes under 25,500. The TSX is less clear, but a break under 36,000 could confirm a top. Under 35,000 a top is confirmed. It’s too early to suggest how far we might drop until we get confirmation of a top. The ascending wedge triangle on the S&P 500 suggests a decline to at least 7,100. But if that breaks, the March lows near 6,300 could beckon.
Source: www.stockcharts.com
Many declare we are in a bubble. We don’t argue with that, but we need to see some breakdowns and confirmations before suggesting maybe the bubble has burst. So far, we are just not seeing that. As a result, new highs are always possible.
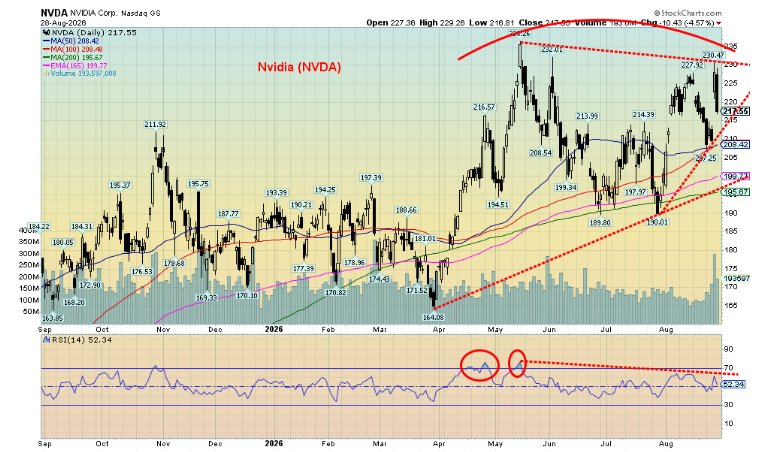
We are showing a chart of Nvidia next that looks quite negative. It failed at the earlier May high and then dropped sharply on Friday, despite the blowout revenues. That’s not a good sign. Numerous negative divergences are being seen. And Nvidia has the led the way up with its hype. This looks like classic topping action. A break of $185 says it’s over. Nvidia represents some 8% of the S&P 500 while the 10 largest AI stocks, which includes the MAG7, represent nearly 40% of the S&P 500. If they fall, then the entire market falls.
Source: www.stockcharts.com
Bonds
Source: www.tradingeconomics.com, www.home.treasury.gov, www.bankofcanada.ca
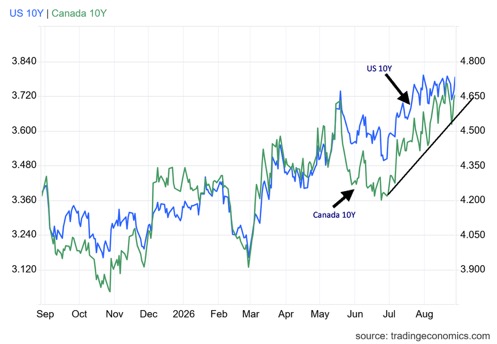
It was a choppy week for bond yields. The U.S. Treasury’s buyback program programme pushed yields lower. Kevin Warsh’s comments at Jackson Hole pushed them back up again. The U.S. Treasury is going to double its buybacks. As noted, it is even going to tap into the Treasury General Account (TGA), using its funds to buy back long bonds. The TGA has an estimated $950 billion. But what happens when it’s gone? It is estimated that there are outstanding $5.5 trillion of U.S. 20-year and 30-year bonds.
The 30-year U.S. Treasury bond fell to 5.15% initially but closed the week at 5.21%. The 10-year U.S. Treasury note fell initially to 4.64% but closed at 4.72%. That was only 2 bp down on the week. The Canadian 10-year Government of Canada bond (CGB) fell to 3.73%, down 3 bp on the week. More significant was the fall in the U.S. 2–10 spread to 36 bp, down from 50 bp because of the sharp jump in the U.S. 2-year Treasury note, up 7 bp on the week. Canada’s 2–10 spread was flat on the week, leaving it at 72 bp.
Bond yields were mostly influenced by the musings of Fed Chair Kevin Warsh’s statements at the Jackson Hole Symposium. The odds of a rate hike at the September 15–16 FOMC jumped to 50%. Will it happen? We doubt it, but the market seems to believe it is a possibility.
Gold and silver
Source: www.stockcharts.com
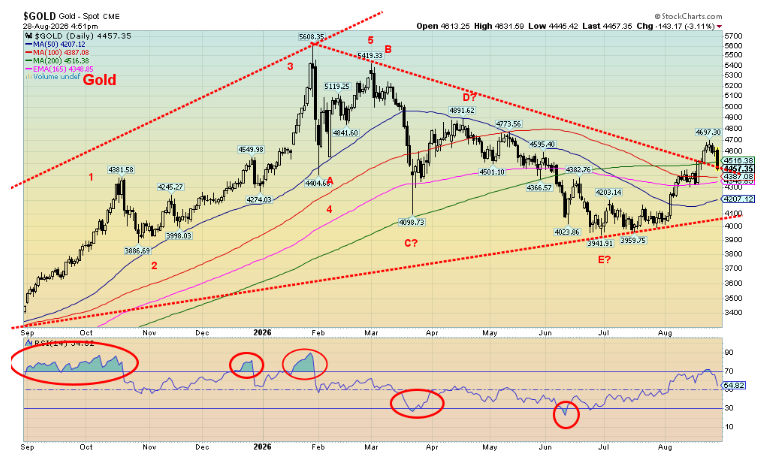
Ouch! Kevin Warsh’s musings at the Jackson Hole symposium left the impression that the Fed might hike interest rates. That he didn’t actually say that is irrelevant. The market perceived it as a possibility. As a result, gold tanked, stocks waffled downward, bond yields rose, and the US$ Index jumped higher. But a reminder that with $40 trillion in debt and interest payments on the debt eating up an increasing amount of the U.S. budget, gold still has only one way to go and that is up.
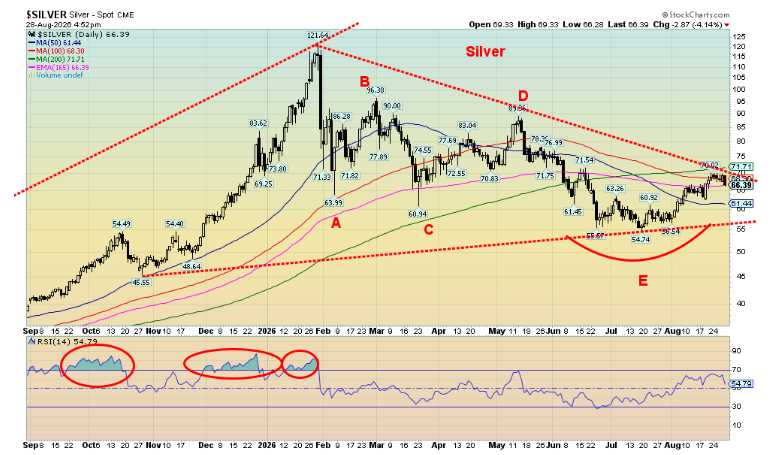
We can’t say that the end of the week drop for gold is over. We are now testing the breakout near $4,500. A break under $4,300 is of more concern. A break under $4,100 suggests new lows under $3,900. That goes for silver too, which so far is the only one that didn’t break out of its downtrend. A break under $58.35 suggests new lows below $54.74. Under $62.50 suggests lower. Obviously, the argument of further declines or new lows is over with new highs above $4,700 gold and $71 silver.
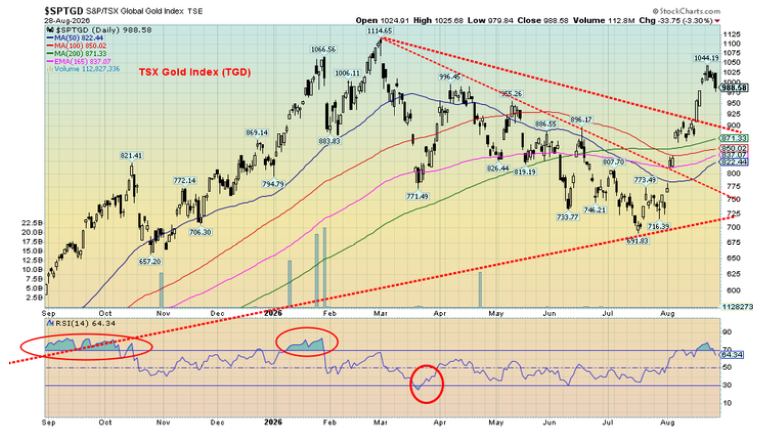
The gold stocks continue to hang tough. This past week gold fell 3.4%, silver dropped 4.3%, but the Gold Bugs Index (HUI) fell only 2.8% and the TSX Gold Index (TGD) dropped 2.2%. This outperformance by the gold stock indices suggests to us that this decline for gold and silver should be only temporary. We’d be more concerned if the gold stock indices fell more percentagewise than gold and silver, as that would suggest the gold stocks are leading. Gold stocks leading is what we normally see. That they didn’t lead we view as a positive. Both the HUI and the TGD have surpassed, albeit by not much, levels that could suggest new highs ahead. This could be merely a bump in the road.
Elsewhere, platinum joined the down move, off 3.3%, but palladium jumped, up 5.3%. Copper fell 0.5%, just off new all-time highs. Gold stocks have enjoyed a very strong month with the HUI up 35.9% so far and the TGD up 34.3%. At the recent highs the HUI was up 53.6% in August, the TGD up 50.9%. A record month for both indices. Gold stocks have been leading, which is what we’d expect. If they were not, we’d be concerned about the rally. The drop thus far is a setback, a correction after a strong move. Signs continue to be positive in the junior mining market as well. The TSX Venture Exchange has gained 17.8% in August and was up 20.5% at the recent highs. A reminder the CDNX is only about 50% mining stocks and not all of that are gold mining stocks. Many are metal stocks. Nonetheless, it’s all positive. The junior gold mining developers don’t usually start to move higher until after Labour Day.
Source: www.stockcharts.com
The currencies were universally down this past week, given the jump in the US$ Index that was up 0.8%. The euro fell 0.8%, the Swiss franc 1%, the pound sterling was down 0.8%, and the Japanese yen off 0.7%. A falling Japanese yen is not good as both the BOJ and the U.S. Treasury want it higher. Another intervention coming?
Source: www.stockcharts.com
Gold has entered a positive seasonal period. History suggests a high sometime in September or October, then another correction into December before a stronger seasonal period gets underway in January. One can’t quite take it to the bank. Only new highs will confirm we are indeed in a new up phase. Otherwise, all we can say about the current action is that it is a correction to the January/July down move. Once it tops, another down move might be expected to test the lows.
That said, our expectations are for higher gold prices. There is simply too much debt, not just in the U.S. but everywhere. Gold is the safe haven. It’s tangible. It’s indestructible. It has no liability. Bitcoin has also jumped higher, along with gold gaining 35% in August. But Bitcoin is not tangible. It can be destroyed, and as to liability, just ask those who lost their Bitcoin to hackers. For gold bugs, there is no comparison. Gold is real. Bitcoin is illusion. Gold can’t be destroyed. Bitcoin can be hacked. It relies on codes on a computer and relies on computers and internet to move it. But yes, Bitcoin is limited as only 21 million coins exist and they are not expanding supply. Gold is still being found, but it is limited. All the gold that ever existed is still here, even if it fell to the bottom of the ocean.
Oil and gas
Source: www.stockcharts.com
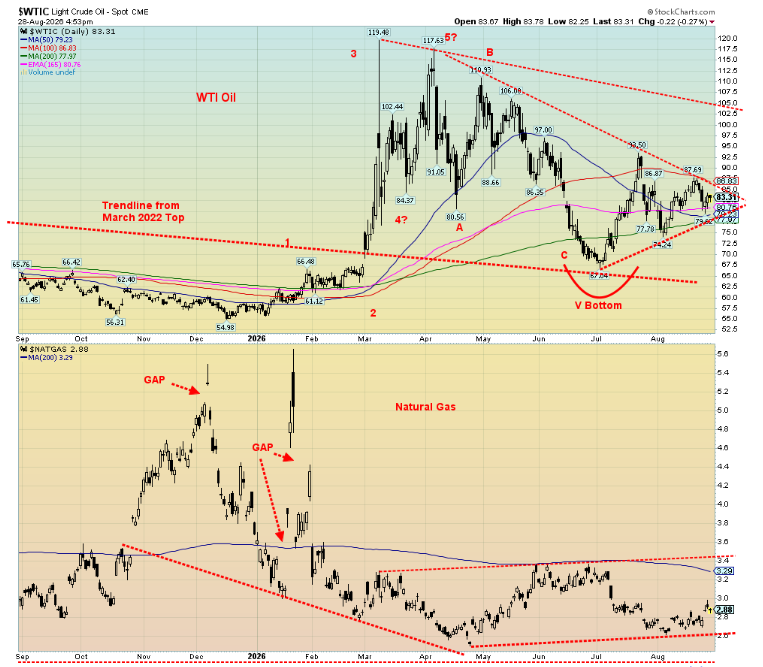
The memo of understanding (MOU) is collapsing. The U.S. is to put more sanctions on Iran and threatens sanctions against any country daring to trade with Iran. Iran and Oman are negotiating for a temporary shipping corridor through the Strait of Hormuz. But the strait remains effectively blocked. The U.S. is still blocking Iranian ports. But oil prices barely move. Okay, they dipped a bit this past week as uncertainty prevailed. WTI oil fell 3.7%. Brent crude lost 6.1%. But EU natural gas (NG) at the Dutch Hub barely moved up 0.2%. Even the North American Henry Hub rose, up 4.4%.
Iran and Oman are also seeking control and revenue sharing to all ships through the Strait of Hormuz. Iran also wants the U.S. to end sanctions, end its blockade, and pay compensation before they open the Strait of Hormuz. The odds of that happening are zero. Iran threatens to bomb more U.S.-based facilities in the Mid-East, if they implement the latest sanctions against Iran and others if they cooperate with Iran. Many, particularly China, said they won’t play along with the U.S.
Where does this leave us? Well, Brent is still near $90. WTI is near $85. Our chart formation continues to suggest that when the breakout comes it should be to the upside, not downside. A firm breakout over $90 would start to confirm that. Over $105 we are on our way higher. Could we break down instead? Yes, but we’d say the odds are low and the chart formation, a consolidation following an up move suggests an upside breakout, not a downside break.
Energy stocks were off slightly this past week with the ARCA Oil & Gas Index (XOI) down 1.9% and the TSX Energy Index (TEN) off 2.9%. Both were slipping from record highs. That the energy stocks continue to outperform the commodity suggests to us that the upside break is more likely than a downside break. U.S. commercial oil reserves continue to hover near 5-year lows and will need replenishing. Again, everything continues to support an upside break. The question is when, not if.
On another story, the U.S. is apparently nearing an accord to acquire some 65 billion barrels of Venezuelan oil reserves. This includes 17 Venezuelan oil fields and promises to deliver to U.S. refiners. Will it happen? The U.S. or at least Trump seems to think so. But it’s against Venezuela’s constitution and the Venezuelan people object.
We await the upside breakout.
Copyright David Chapman 2026
GLOSSARY
Trends
Daily – Short-term trend (For swing traders) Weekly – Intermediate-term trend (For long-term trend followers)
Monthly – Long-term secular trend (For long-term trend followers)
Up – The trend is up.
Down – The trend is down
Neutral – Indicators are mostly neutral. A trend change might be in the offing.
Weak – The trend is still up or down but it is weakening. It is also a sign that the trend might change.
Topping – Indicators are suggesting that while the trend remains up there are considerable signs that suggest that the market is topping.
Bottoming – Indicators are suggesting that while the trend is down there are considerable signs that suggest that the market is bottoming.
Disclaimer
David Chapman is not a registered advisory service and is not an exempt market dealer (EMD) nor a licensed financial advisor. He does not and cannot give individualised market advice. David Chapman has worked in the financial industry for over 40 years including large financial corporations, banks, and investment dealers. The information in this newsletter is intended only for informational and educational purposes. It should not be construed as an offer, a solicitation of an offer or sale of any security. Every effort is made to provide accurate and completeinformation. However, we cannot guarantee that there will be no errors. We make no claims, promises or guarantees about the accuracy, completeness, or adequacy of the contents of this commentary and expressly disclaim liability for errors and omissions in the contents of this commentary. David Chapman will always use his best efforts to ensure the accuracy and timeliness of all information. The reader assumes all risk when trading in securities and David Chapman advises consulting a licensed professional financial advisor or portfolio manager such as Enriched Investing Incorporated before proceeding with any trade or idea presented in this newsletter. David Chapman may own shares in companies mentioned in this newsletter.Before making an investment, prospective investors should review each security’s offering documents which summarize the objectives, fees, expenses and associated risks. Although Artificial Intelligence (AI) may be deployed from time to time, AI output is monitored and adjusted, if necessary, for accuracy. David Chapman shares his ideas and opinions for informational and educational purposes only and expects the reader to perform due diligence before considering a position in any security. That includes consulting with your own licensed professional financial advisor such as Enriched Investing Incorporated. Performance is not guaranteed, values change frequently, and past performance may not be repeated.
About the author


Website: https://www.enrichedinvesting.com
Disclaimer: David Chapman is not a registered advisory service and is not an exempt market dealer (EMD) nor a licensed financial advisor. We do not and cannot give individualised market advice. David Chapman has worked in the financial industry for over 40 years including large financial corporations, banks, and investment dealers. The information in this newsletter is intended only for informational and educational purposes. It should not be considered a solicitation of an offer or sale of any security. The reader assumes all risk when trading in securities and David Chapman advises consulting a licensed professional financial advisor before proceeding with any trade or idea presented in this newsletter. David Chapman may own shares in companies mentioned in this newsletter. We share our ideas and opinions for informational and educational purposes only and expect the reader to perform due diligence before considering a position in any security. That includes consulting with your own licensed professional financial advisor.