
Riots in France, bond yields soaring again, a questionable diesel deal, gold rebounds, and stocks made all-time highs again or at least some did. That was the week. Oh yes and lousy job numbers for Canada.
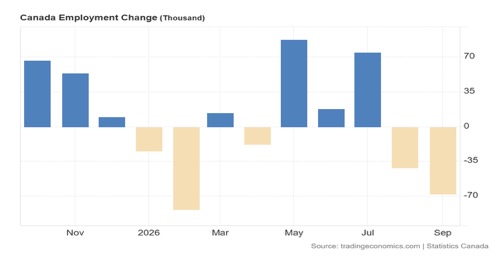
The Canadian job numbers were a disappointment as Canada lost 68,300 jobs in September. The job numbers are the subject of our chart of the week.
Students are rioting in France over education cuts. French bond yields are soaring. France is only one of the G7 nations burdened with too much debt, excessively large budget deficits, an aging population, and an inability to cut expenditures and when they attempt cuts, they face revolt.
But the U.S. stock market couldn't care less as it made new all-time highs once again. Well some, not all. Meanwhile market breadth is deteriorating and more stocks are making new lows than new highs. Consumer confidence is in the dumps but the stock market rises higher. The K economy.
Gold rebounded despite the interest rates and a higher US$ Index. Oil prices eased higher and Trump cut a diesel deal with Russia that at best is a band aid for high diesel prices if it even happens. Energy stocks made new highs too. The stocks are leading both energy and gold all suggesting that when the dust clears oil and gold are going higher. This would benefit Gold production stocks such as Wheaton Precious Metals Corp. that reported record year-to-date production, salves volumes, revenue, earnings and cashflow, pays a dividend, and is held in the Enriched Capital Conservative Growth Strategy.*
Fall is definitely in the air now. Monday is the Thanksgiving holiday in Canada so markets are closed. U.S. is open. U.S. inflation numbers are out this week.
Have a great week!
DC
* Reference to the Enriched Capital Conservative Growth Strategy and its investments, celebrating an
8.6 - year history of 193% growth (annual 13.33%) to August 31, strong alpha and second August ranking at www.emergingmanagers.ca, is added by Margaret Samuel, President, CEO and Portfolio Manager of Enriched Investing Incorporated, who can be reached at 416-203-3028 or msamuel@enrichedinvesting.com This information should not be construed as an offer, or a solicitation of an offer or sale of any security. Past performance does not guarantee future returns.
“China gets their oil from Libya. Why isn't China involved? They're going out spending billions of dollars a day on trying to take over the world economically. And we're spending billions and billions and billions of dollars on policing the world. Why isn't China involved with Libya? That - we don't get oil from Libya, China does.”
—Donald Trump, American politician, media personality, businessman, 45th president of the U.S. (2017–2021), 47th president of the U.S. (2025–present), president family real estate business (1971), host of TV reality show The Apprentice (2004–2015), 34 times convicted felon, impeached twice, other charges dropped including obstruction of the 2020 election and encouraging the attack on the Capitol on January 6, 2021, convicted of sexual assault; b. 1946
“It's important to understand that oil and renewables do different things. Wind and solar are for power generation, so they don't replace oil. About 70% of all oil produced is used for transportation fuel. Renewables are good projects, but they don't get us off of foreign oil.”
—T. Boone Pickens, American business magnate, financier, hedge fund B.P. Capital Management, well-known corporate raider and takeover operator; 1928–2019
“The fossil fuel industry commands outsize sway over U.S. politics, markets, and democracy. I knew these companies were formidable, but when I served on the National Commission on the BP Deepwater Horizon Oil Spill and Offshore Drilling, I got a close-up view of how the industry disregards government safeguards.”
—Frances Beinecke, environmental activist, president Natural Resources Defense Council (2006–2015), awards including from the National Audubon Society, author of Clean Energy Common Sense: An American Call to Action on Global Climate Change with Bob Deans (2010); b. 1949
Riots on the streets of France. A sell-off of French bonds. Rising interest rates, not just in France but just about everywhere. Is there about to be a debt crisis? While one doesn’t seem imminent, a crisis can come out of the blue: i.e., a black swan event. The riots on the streets of France and the bond sell-off are coincidental, not necessarily connected. Both, however, note a deteriorating situation that could spread – i.e., contagion.
Is the French bond sell-off serious? Yes, but at this stage it is merely signaling a repricing rather than a default or a crisis on the level of the EU/Greek debt crisis that started in 2009 and lasted off and on until 2018. The other concern is that this could be related to the unwinding of the yen carry trade. With the yen carry trade, one borrows in Japanese yen when rates are low, sells the proceeds for usually U.S. dollars (but it could be other currencies as well), and then reinvests the funds in higher-yielding securities elsewhere, usually the U.S. bond market or the stock market. The trade works as long as Japanese interest rates stay low and the value of the yen vs. the U.S. dollar also stays low.
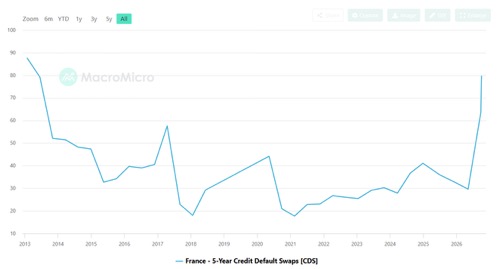
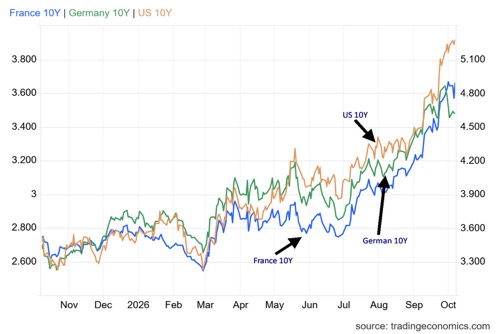
But that’s not what is happening. Japanese interest rates are rising, and attempts are being made to increase the value of the Japanese yen. None of that is good for the yen carry trade. The amount outstanding for the yen carry trade is estimated to be roughly U.S.$10 trillion. The repricing of French bonds at this stage is the more likely reason for the rise in French bond yields, given their fiscal problems. France has experienced the highest jump of all the G7 nations for its benchmark 10-year. The spread between French bonds and German bunds (the highest credit-rated bonds) went from 87 bp to 142 bp over the past month. Is it any surprise that the cost for French 5-year bonds credit default swaps (CDS) have soared?
France: Five (5) Year CDS
Source: www.en.macromicro.me
G7 10-year Bond Yields (October 7, 2026)
|
G7 country |
10-year bond yield today % |
10-year bond yield one month ago % |
Differential/%gain |
Credit rating S&P |
Government debt as % GDP |
Budget deficit as a % GDP |
|
U.S. treasuries |
5.31% |
4.80% |
+51 bp/+10.6% |
AA+ |
123% |
6.5% |
|
Japan JGBs |
3.11% |
2.93% |
+18 bp/+6.1% |
A+ |
235% |
1.8% |
|
Germany bunds |
3.49% |
3.38% |
+11 bp/+3.3% |
AAA |
65% |
4.2% |
|
France OATs |
4.91% |
4.25% |
+ 66 bp/+15.5% |
A+ |
116% |
5.3% |
|
U.K. gilts |
5.44% |
5.18% |
+26 bp/+5.0% |
AA |
104% |
5.2% |
|
Italy BTPs |
4.65% |
4.21% |
+44 bp/+8.4% |
BBB+ |
137% |
3.0% |
|
Canada GofC bonds |
3.96% |
3.78% |
+18 bp/+4.8% |
AAA |
113% * |
2.1% |
|
Average (not weighted) |
4.41% |
4.08% |
+33 bp/+8.2% |
AA |
128% |
4.0% |
Source: www.tradingeconomics.com, www.economist.com
*Canada includes both federal and provincial debt
Bold: denotes highest
France has problems. But so do the other G7 nations. France’s debt to GDP is 116%, while its budget deficit to GDP is 5.3%. Growth is weak, the country is experiencing political fragmentation, and it is difficult to cut expenditures, especially when the largest expenditure is old age security. But the same can be said to varying degrees about all the G7 countries: an aging society, the need for more health care, the need for more education. But they are also emphasizing more expenditures on defence. All those require more funds. Spending cuts are met with protests, as France is discovering with the student protests.
Collectively, the average debt to GDP is 128%, thanks to Japan’s huge 235% debt to GDP and the budget deficit is on average 4% of GDP. The EU has a budget deficit to GDP limit at 3% and a federal debt to GDP limit of 60% Both France and the U.K. exceed the former and all exceed the public debt to GDP limit. Is it enforced?
The budget deficit to GDP is especially high. The U.S has the highest at 6.5% while France and the U.K. are above the average. Germany has the lowest debt to GDP of the G7 countries while Canada has the lowest budget deficit to GDP. Only Germany and Canada hold an AAA credit rating. On average, the G7 countries’ credit rating is AA while the debt to GDP averages 128%, skewed by Japan and Italy.
All G7 countries are being negatively impacted by rising energy prices and rising bond yields. Inflation is a problem for all. The problems become exacerbated and could potentially spark a systemic crisis if any of the following happens: spreads between the countries widen between the best credits and the weaker credits, bond auctions experience continual weak demand, funding costs surge and credit default swap (CDS) spreads surge, or budget deficits continue to expand.
If a systemic debt crisis broke out in a G7 country, the ability of the world’s central banks led by the Federal Reserve to overcome a such a crisis is weakening. Following systemic crises in 2008 (financial crisis) and 2020
(pandemic), the central banks’ ability to respond has weakened considerably. The problem is being exemplified by the street riots in France as students protest teacher wage freezes and funding cuts to education. This could easily spread by contagion elsewhere, even if for different reasons. The most likely countries to immediately feel contagion are Spain and Italy.
Governments are in the unenviable position to either cut spending or raise taxes. Neither action is palatable. Rising interest rates just add to the costs when in the U.S. interest payments on the debt are now the third largest expenditure behind Social Security and Medicare/Medicaid. Most estimates show the U.S. will run out of funds for Social Security by 2032. Onerous debts and sharply rising debt service costs are a threat to all. Is France the canary in the coal mine? Could the crisis spread by contagion? Are Spain and Italy next? This is how a sovereign debt crisis gets underway. Is France too big to save?
10-year Bond Yields France, Germany, U.S.
Source: www.tradingeconomics.com
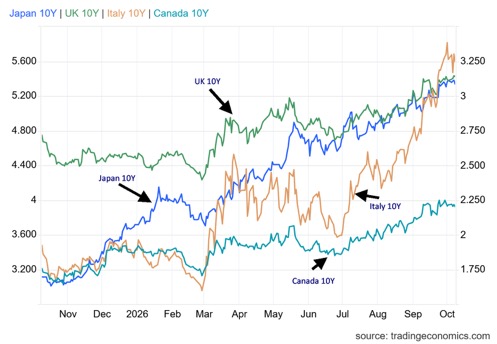
10-year Bond Yields Japan, UK, Italy, Canada
Source: www.tradingeconomics.com
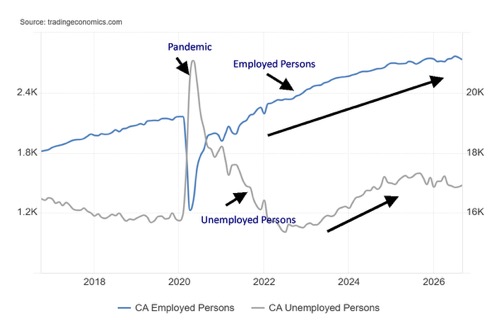
Chart of the week
Canada job numbers
Source: www.tradingeconomics.com, www.statcan.gc.ca
Canada unexpectedly lost 68,300 jobs in September, well below the expected 7,000 increase. In August, Canada lost 41,700 jobs. It makes the net loss of jobs for 2026 a decrease of 41,200. Full-time employment fell 35,400 vs. a decline of 35,900 in August and part-time employment fell 32,900 vs. a decline of 5,800 in August. The headline unemployment rate rose to 6.5% from 6.4% but the R8 unemployment rate, the highest reported by Statistics Canada that includes discouraged searchers, waiting groups, and involuntary part-timers fell to 8.1% from 9.4%. An interesting improvement.
The participation rate fell to 64.8 from 65.0%. The number of employed persons fell to 21,104.8 thousand from 21,173.1 thousand. The number unemployed rose to 1,474.9 thousand from 1,495.5 thousand. Average hourly wages grew to $37.64, up 2.3% following a 2% rise in August. Youth unemployment rose to 13% from 12.9%.
Surprisingly, the loss of jobs was not all trade war related. The biggest losses were seen in education and health care (public sector). Manufacturing also lost some. Oddly, the biggest growth was in wholesale and retail trade, along with what is called other services. The public sector losses are, interestingly enough, provincial responsibilities, not federal. Most of the losses occurred for young people aged 15–24. End of summer jobs? The biggest losses were seen in Quebec, British Columbia, and Ontario, while Alberta added jobs.
The question many will ask is, will the Bank of Canada (BofC) hold interest rates at its next meeting on October 28? Maybe the inflation numbers, to be released October 19, will also influence the BofC. That said, there will most likely be pressure for the BofC to hike rates following the Fed’s last decision. A rise in the interest rate differential between the Canada 10-year and U.S. 10-year to 137 bp from the previous month’s 104 bp is negative for the Cdn$. During that time period the Cdn$ fell to 69.93 from 72.46. The BofC may be forced to hike to narrow the interest rate differential. The BofC also tends to put more emphasis on the inflation rate rather than the unemployment rate. That’s no surprise, given inflation is a monetary issue and therefore a BofC responsibility, while unemployment is a fiscal issue for federal, provincial, and municipal governments.
The job losses shouldn’t have been unexpected, although the prime areas that lost jobs is a surprise. One would have thought the losses would be in industries negatively impacted by the U.S./Canada trade war. The loss of youth jobs shouldn’t be surprising, given that it’s the end of summer and back to school.
Source: www.tradingeconomics.com, www.statcan.gc.ca
Markets and Trends
|
|
|
|
% Gains (Losses) Trends
|
|
||||
|
|
Close Dec 31/25 |
Close Oct 9/26 |
Week |
YTD |
Daily (Short Term) |
Weekly (Intermediate) |
Monthly (Long Term) |
|
|
|
|
|
|
|
|
|
||
|
S&P 500 |
6,845.50 |
7,811.54 (new highs) * |
1.2% |
14.1% |
up |
up |
up |
|
|
Dow Jones Industrials |
48,063.29 |
51,654.95 |
0.9% |
7.5% |
down |
up (weak) |
up |
|
|
Dow Jones Transport |
17,357.19 |
19,804.14 |
(1.0)% |
14.1% |
down |
down (weak) |
up |
|
|
NASDAQ |
23,241.99 |
27,366.17 (new highs) * |
0.6% |
17.7% |
up |
up |
up |
|
|
S&P/TSX Composite |
31,712.76 |
35,664.62 |
0.5% |
12.5% |
down |
up |
up |
|
|
S&P/TSX Venture (CDNX) |
987.74 |
874.03 |
(0.7)% |
(11.5)% |
down |
down |
up |
|
|
S&P 600 (small) |
1,467.76 |
1,672.98 |
(0.8)% |
14.0% |
down |
neutral |
up |
|
|
ACWX MSCI World x US |
67.18 |
75.47 |
(0.7)% |
12.3% |
down |
up |
up |
|
|
Bitcoin |
87,576.98 |
82,332.55 |
(2.4)% |
(6.0)% |
up (weak) |
up |
up (weak) |
|
|
|
|
|
|
|
|
|
|
|
|
Gold Mining Stock Indices |
|
|
|
|
|
|
|
|
|
Gold Bugs Index (HUI) |
701.49 |
750.35 |
1.9% |
7.0% |
down |
down (weak) |
up |
|
|
TSX Gold Index (TGD) |
817.76 |
901.04 |
1.7% |
10.2% |
down |
neutral |
up |
|
|
|
|
|
|
|
|
|
|
|
|
Bonds% |
|
|
|
|
|
|
|
|
|
U.S. 10-Year Treasury Bond yield |
4.17% |
5.25% |
(0.6)% |
25.9% |
|
|
|
|
|
3.3Cdn. 10-Year Bond CGB yield |
3.44% |
3.88% |
(1.8)% |
12.8% |
|
|
|
|
|
Recession Watch Spreads |
|
|
|
|
|
|
|
|
|
U.S. 2-year 10-year Treasury spread |
0.69% |
0.45% |
2.3% |
(34.8)% |
|
|
|
|
|
Cdn 2-year 10-year CGB spread |
0.85% |
0.69% |
3.0% |
(18.8)% |
|
|
|
|
|
|
|
|
|
|
|
|
|
|
|
Currencies |
|
|
|
|
|
|
|
|
|
US$ Index |
98.26 |
102.22 (new highs) |
0.3% |
4.0% |
up |
up |
neutral |
|
|
Canadian $ |
72.87 |
70.11 (new lows) |
(0.1)% |
(3.8)% |
down |
down |
down |
|
|
Euro |
117.48 |
112.02 (new lows) |
(0.5)% |
(4.7)% |
down |
down |
neutral |
|
|
Swiss Franc |
126.21 |
120.50 |
(0.2)% |
(4.5)% |
down |
down |
neutral |
|
|
British Pound |
134.78 |
132.40 |
flat |
(1.7)% |
down |
down |
up (weak) |
|
|
Japanese Yen |
63.83 |
63.19 |
(0.3)% |
(1.0)% |
down (weak) |
neutral |
down |
|
|
|
|
|
|
|
|
|
|
|
|
Precious Metals |
|
|
|
|
|
|
|
|
|
Gold |
4,311.97 |
4,195.18 |
0.3% |
(4.0)% |
down |
down |
up |
|
|
Silver |
71.16 |
60.74 |
0.6% |
(14.6)% |
down |
down |
up |
|
|
Platinum |
2,046.90 |
1,695.30 |
(0.7)% |
(17.2)% |
down |
down |
up |
|
|
|
|
|
|
|
|
|
|
|
|
Base Metals |
|
|
|
|
|
|
|
|
|
Palladium |
1,619.50 |
1,149.50 (new lows) |
(2.0)% |
(29.0)% |
down |
down |
neutral |
|
|
Copper |
5.64 |
6.66 |
2.2% |
18.1% |
up |
up |
up |
|
|
|
|
|
|
|
|
|
|
|
|
Energy |
|
|
|
|
|
|
|
|
|
WTI Oil |
57.44 |
91.60 |
0.5% |
59.5% |
neutral |
up (weak) |
up |
|
|
Nat Gas |
3.71 |
3.20 |
5.3% |
(13.8)% |
up |
up (weak) |
neutral |
|
Source: www.stockcharts.com
* New All-Time Highs
Note: for an explanation of the trends, refer to the glossary at the end of this article.
New highs/lows refer to new 52-week highs/lows and, in some cases, all-time highs.
Stocks
Source: www.stockcharts.com
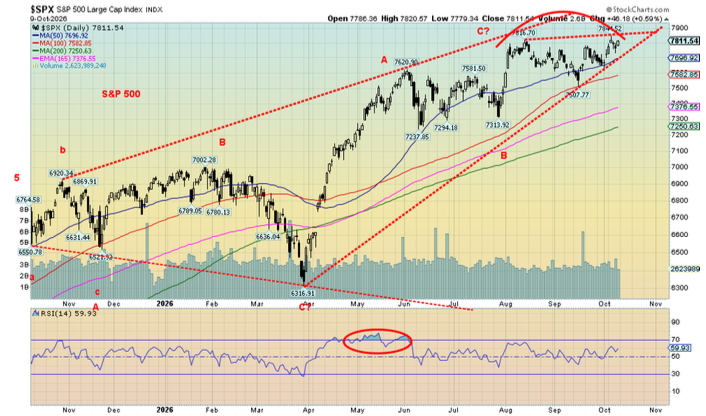
Records continue to fall. Okay, for some but not all. This past week both the S&P 500 and the NASDAQ Composite reached all-time highs. Joining them were the NASDAQ 100, the NY FANG Index, the S&P 100 (OEX), and the Russell 1000. While those indices are making new all-time highs, it is noteworthy that the Dow Jones Industrials (DJI) is down 5% from its all-time high, the Dow Jones Transportations (DJT) is off 17%, the Dow Jones Utilities (DJU) is off 11%, and the Dow Jones Composite (DJC) is down 6%. It seems that the blue chips are struggling whereas the speculative AI stocks continue to soar.
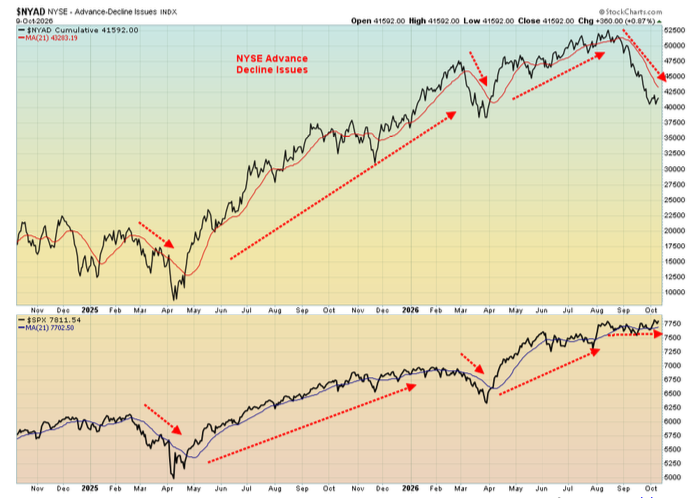
This past week, five of the MAG7 were up in the week. Microsoft and Nvidia reached all-time highs, even as Nvidia closed down on the week. Other FANG stocks saw Advanced Micro (AMD) and Palantir make all-time highs. MAGS, the MAG7 ETF, made all-time highs as well. Earnings are driving the market, and companies continue to report in many cases record earnings. The banks are due to join them. Meanwhile, breadth continues to decline, with more stocks making 52-week lows and then making 52-week highs. The market continues to tell us it is dangerous to buy up here, but we are not yet seeing signs of a breakdown.
On the week, the S&P 500 gained 1.2%, the DJI was up 0.9%, the DJT fell 1.0%, while the NASDAQ rose 0.6%. The S&P 400 (Mid) was flat while the S&P 600 (Small) fell 0.8%. In Canada, the TSX Composite was up 0.5% while the TSX Venture Exchange (CDNX) continued its recent woes, falling 0.7%. Bitcoin fell this past week, down 2.4%.
In the EU, the London FTSE rose 0.9%, the EuroNext fell 0.8%, the Paris CAC 40 dropped 1.2%, and the German DAX fell 0.6%. The U.S. remained firm, while the EU was struggling. In Asia, China’s Shanghai Index (SSEC) fell 0.7%, the Tokyo Nikkei Dow (TKN) rose 1.1%, Hong Kong’s Hang Seng (HSI) rose 1%, while India’s Nifty Fifty hit new 52-week lows but finished up 0.4%.
Source: www.stockcharts.com
As we noted, breadth continues to falter and this chart of the NYSE advance/decline issues illustrates it. The S&P 500 holds while the AD line falls.
In Canada, five of the 14 sub-indices fell this past week including Real Estate (TRE) and Telecommunications (TTS) making 52-week lows. The upside leader was Consumer Discretionary (TCD), but the materials sector helped: Gold (TGD), Metals (TGM), and Materials (TMT).
Source: www.stockcharts.com
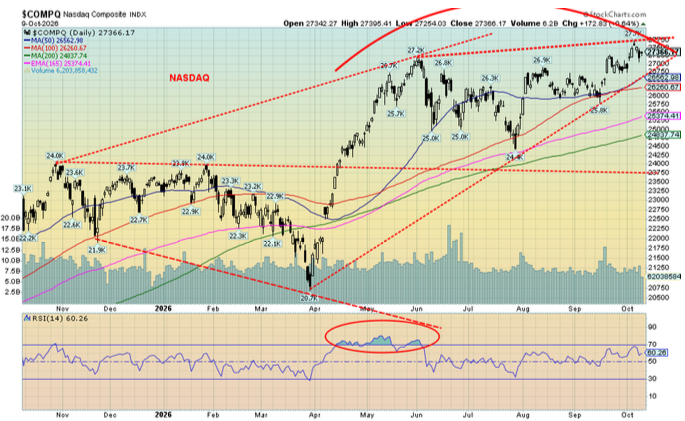
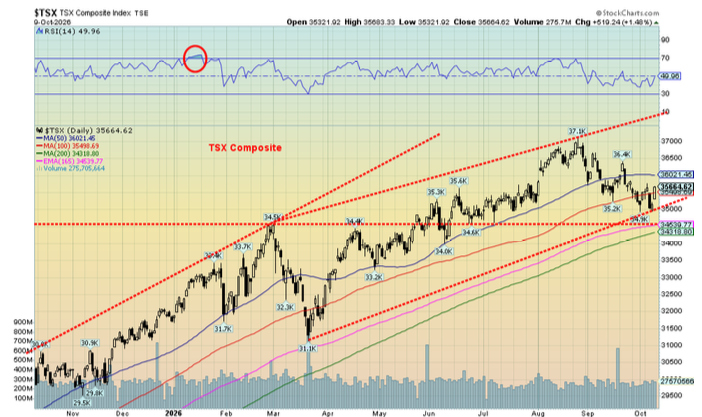
Yes, the S&P 500 and NASDAQ made all-time highs this past week, but they were feeble highs and didn’t hold. The S&P 500 breaks down under 7,700 but a safer breakdown point is under 7,500. The NASDAQ breaks under 26,500 and especially under 25,000. New highs keep the party going. The TSX is relatively weaker currently, breaking under 35,000 and especially under 34,000.
We’re not dismissing new highs as earnings continue to be firm. But we remain wary of the downside. And the market remains two-tiered, led by the high-tech/AI stocks while the rest of the market is languishing. Banks are reporting this week, and we expect the profit parties to continue.
Source: www.stockcharts.com
Bonds
Source: www.tradingeconomics.com, www.home.treasury.gov, www.bankofcanada.ca
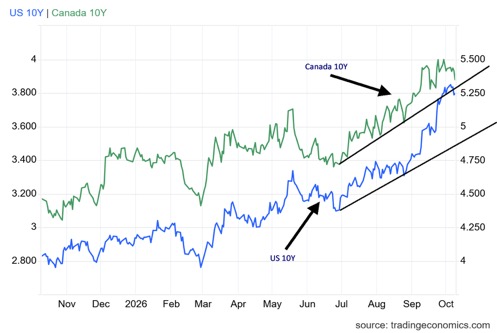
President Trump’s musings on not attacking Iran until after the mid-terms helped ease bond yields this past week. The U.S. 10-year Treasury note fell to 5.25%, down from a peak of 5.32% and last week’s close of 5.28%. Canada’s Government of Canada bonds (CGB) also fell to 3.88%, thanks to the easing of U.S. bond yields and the weaker than expected job numbers released on Friday. The CGB peaked at 4.00% earlier.
Nonetheless, the trend for bond yields remains firmly to the upside. The CGB might break down under 3.80% and the U.S. 10-year breaks under 4.80%, although under 5.00% would be a negative sign, but overall we see little that could help push bond yields down significantly. Too much debt, too big budget deficits, no desire to either raise taxes or cut spending, continued high demand including recently from AI companies all conspire to keep bond yields firm. It doesn’t matter that a Fed rate hike might not occur this month but instead they are focused on the potential for a December rate hike. Only two meetings are left: October 27–28 and December 8–9.
Gold and silver
Source: www.stockcharts.com
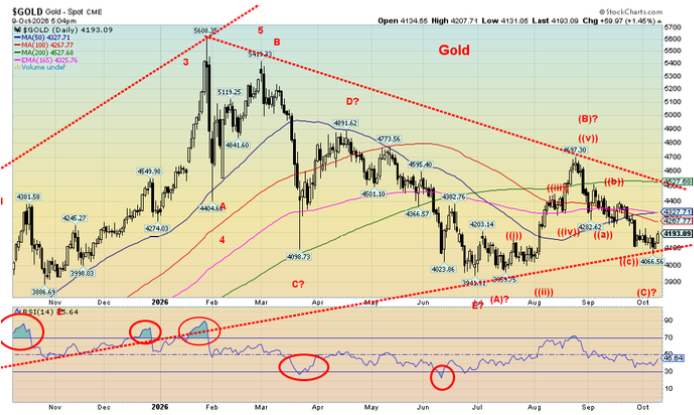
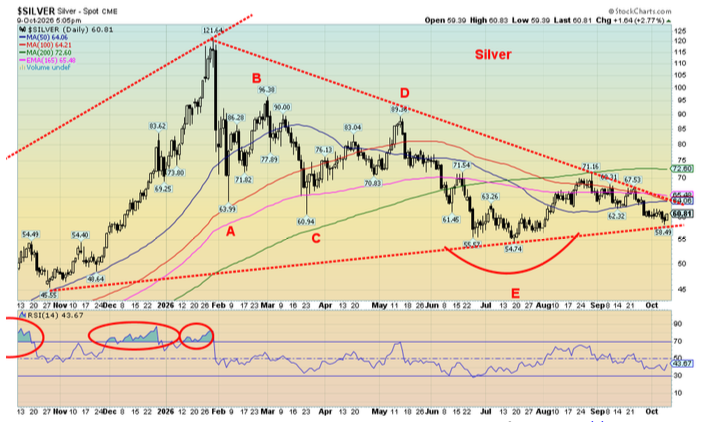
Despite a surging US$ Index, rising interest rates, and firm oil prices, gold rose this past week. Gold was up 1.3%, silver gained 0.6%, but platinum faltered, down 0.7%. Of the near precious metals, palladium fell almost 2.0% and hit 52-week lows. Copper rose 2.2%. The gold stocks caught a bit of a bid with the Gold Bugs Index (HUI) up 1.9% and the TSX Gold Index (TGD) rising 1.6%. Those are small but significant gains, given the dollar, interest rate strength, and oil firmness.
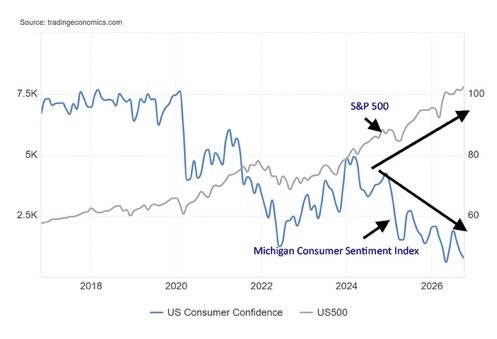
Gold may have gained a bit of confidence on expectations that the Fed won’t hike interest rates in October. Also, the Michigan Consumer Sentiment Index came in at a bearish 46.3, below the expected 47.6 and a reading of 48.1 in September. Consumer sentiment remains very low, seemingly in contrast to a stock market that is still making new all-time highs. The K economy? The Michigan Consumer Sentiment Index hit a record low in May at 44.8. The S&P 500 reached an all-time high this past week. The rich get richer. As for the rest – meh!
Gold sits on the cusp of either breaking down or surging higher. Unfortunately, the breakdown point is a lot closer than the breakout point. Gold breaks down under $4,100 but doesn’t break out until it is over $4,500. Silver is in the same conundrum as currently, at $60.81, the breakdown is under $58, but the breakout isn’t until over $66. We’d actually prefer it over $72 to feel confident.
The K Economy – S&P 500 vs. Michigan Consumer Sentiment Index 2016–2026
Source: www.tradingeconomics.com, www.umich.edu
We won’t get bullish until we take out our breakout points. We can’t ignore the breakdown points and recognize they remain at risk. But the rise in the face of dollar, interest rates, and oil this past week is encouraging.
Gold needs a black swan event. We watch the debt situation carefully as it is there that a potential black swan exists. A sovereign debt crisis? We already mentioned France. The Fed is not expected to act this month, but traders are still expecting another 25 bp rate hike by December. This week we get the inflation numbers. Any easing will help gold. But if they tick higher, then all bets are off. Irrespective of this, central banks continue to accumulate gold.
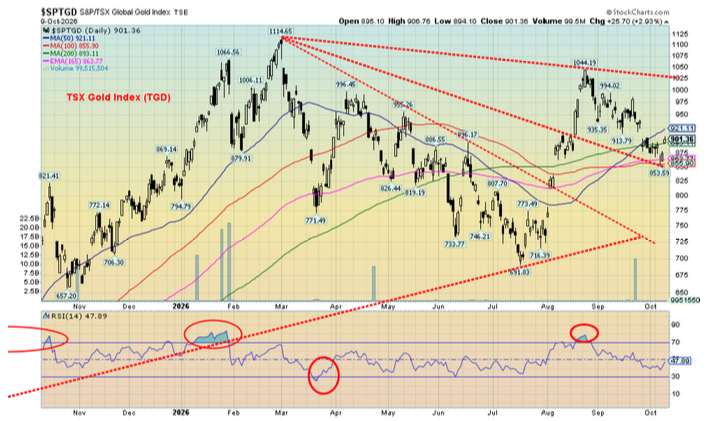
Another piece of encouragement came Friday when the gold stock indices (HUI, TGD) both gapped higher. A breakaway gap? The improvement for gold and the gold stocks was thanks to Trump announcing that he wouldn’t hit Iran until after the mid-terms. That helped to steady oil and ease bond yields somewhat. But now Trump has threatened to hit the Houthis over the bombing of the Riyadh airport that killed 12 including an American citizen and injured over 300. Any entry of the U.S. into that war could trigger further expansion of an already dangerous and growing war. Impact on oil prices? TBD.
Upside follow-through for gold this coming week will be important. Falling back could signal new lows ahead. The TGD hit support near 865 and closed at 901. If there is any concern in the gold market, it is the feeble performance of the junior explorers. The TSX Venture Exchange (CDNX) fell again this past week, and many junior gold explorers are just moribund.
Source: www.stockcharts.com
Where we are encouraged about gold going forward is the stronger performance of the gold stocks vs. gold and silver and the strong performance of copper. Silver is down 50% from its all-time high in January 2026, gold is down 25%, but the HUI is off only 24% and the TGD is down 19% from the same point. Copper is up 1%, currently at $6.66 vs. $6.58 at the January 2026 high. The stocks and copper are usually the leaders. Normally, the stocks would be down 40%–60%, given the drops for gold and silver. But they aren’t. And copper is up, albeit a small rise.
As we noted, central banks continue to buy up some 170 metric tonnes in the first eight months. Leading the way have been Poland and China, both up roughly 80–100 tonnes. Their buying was offset by selling from Turkey and Russia, both unloading some 55–80 metric tonnes. Central banks bought 39 metric tonnes in August alone (source: World Gold Council www.gold.org).
Despite high prices, gold continues to be bought, particularly by Asian countries, but in North America gold is underowned.
Source: www.stockcharts.com
The case for gold remains as strong as ever, despite the setback and bear market of 2026. High interest rates, far too much debt, huge budget deficits, particularly for the G7 countries, and the shaky geopolitical situation are favourable for gold. Despite the weakness, the technicals continue to indicate some strength. We await the breakout.
A note on currencies as the US$ Index made 52-week highs this past week while the Cdn$ and the euro made 52-week lows. All the currencies were down this past week, except for the pound sterling which ended the week flat.
Oil and gas
Source: www.stockcharts.com
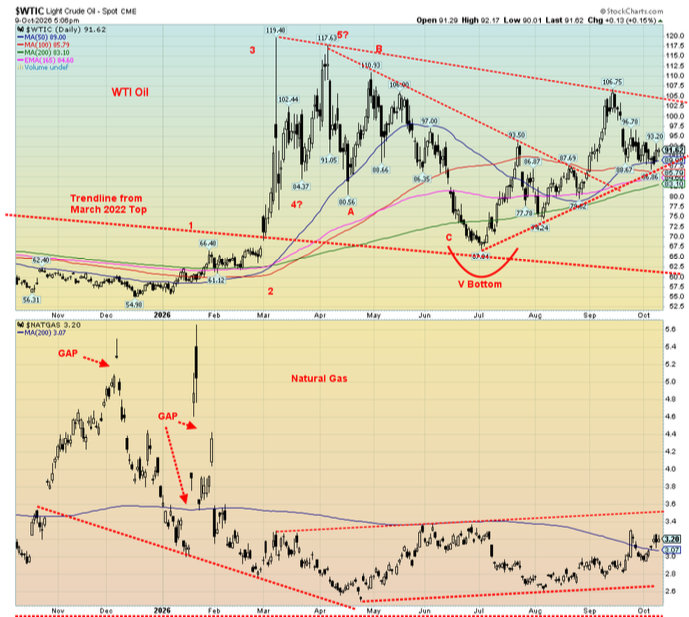
Whither oil prices? The Trump administration’s desperate attempts to lower oil prices before the mid-terms are taking on some twisted turns. There will be no attacks on Iran until after the mid-terms. That sparked oil prices to back off the previous week. But it didn’t stop oil prices from creeping higher this past week. Then along comes Hurricane Isaias that potentially threatens oil and gas facilities in the Gulf of Mexico. Nor did it stop Iran from continuing to hit tankers in the Strait of Hormuz. It didn’t stop the ongoing conflict between the Houthis and Saudi Arabia over the el-Mandeb Strait and the Red Sea. Now Yemen is in the mix as well, complicating that conflict even further. Worse, the U.S. is threatening to enter that war.
Not only has it not stopped Iran nor opened the Strait of Hormuz, but Iran is also using the lull to re-arm and re-supply with purportedly arms from Russia. Iran may be under a U.S. embargo in the Persian Gulf and the Gulf of Oman, but overland Iran borders are on Pakistan, Afghanistan, Turkey, Armenia, Azerbaijan, Turkmenistan, and Iraq, and Russia is accessible through the Caspian Sea. Air routes may also be open.
Then along came the diesel deal, whereby the U.S. is to get 300,000 tonnes of diesel from Russia immediately, another 500,000 tonnes in November, and another 3 million tonnes depending on refinery conditions in Russia. It is to supply the U.S. and the global market. Sanctions against Russia are to be removed until April 2027. It’s all geared to lower diesel prices in the U.S. that are hurting a wide range of constituencies, including farmers, truckers, and households. Diesel prices eased after the announcement, but will that hold? Likely not. The 300,000 tonnes purported to be to be released is only about 14 days’ supply of what the U.S. imports daily.
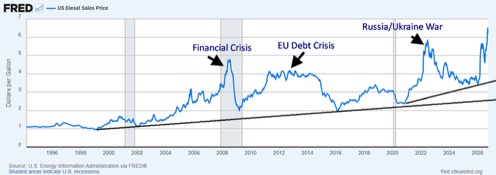
The deal was immediately condemned by Ukraine and the EU. Ukraine responded by bombing more Russian refineries. The EU said it maintains its sanctions. The war between Russia and Ukraine continues, even as Kiev is now in the dark and oil and gas reserves are low in the EU with winter approaching. Reserves are also low in the U.S. The diesel price below is only to October 5, leaving off the latest gyrations. The recent high was at $6.20, up 78% in 2026. Most analysts conclude that it is merely a band-aid and it won’t last. Ukraine is complaining the deal effectively throws Ukraine under the bus. With the bombing of more Russian refineries the deal may be still born.
U.S. Diesel Sales Price: 1994–2026 to Oct 5, 2026
Source: www.stlouisfed.org
With all the political gyrations, one can only conclude that attempts to lower oil and diesel prices are merely temporary solutions. When the fireworks start again, as they inevitably will, oil prices will shoot higher once
again. This past week WTI oil rose 0.5%, Brent crude was up 1.5%, natural gas (NG) at the U.S. Henry Hub rose 5.3%, while NG at the EU Dutch Hub was up 5.1%. NG was responding more to tight supplies and the potential for a cold winter. As to the energy stocks, the ARCA Oil & Gas Index (XOI) made all-time highs, up 5.1% while the TSX Energy Index (TEN) gained 2.1%.
Technically, WTI oil continues to form what appears to be a bull triangle with a breakout above $105. If successful, it potentially projects to as high as $135. Danger occurs if we break under $85. Given current conditions, we see little danger of that, but the risk remains until we break out. NG continues to base but needs to break out over $3.50/$3.60. Given the base, a breakdown is unlikely.
Copyright David Chapman 2026
GLOSSARY
Trends
Daily – Short-term trend (For swing traders)
Weekly – Intermediate-term trend (For long-term trend followers)
Monthly – Long-term secular trend (For long-term trend followers)
Up – The trend is up.
Down – The trend is down
Neutral – Indicators are mostly neutral. A trend change might be in the offing.
Weak – The trend is still up or down but it is weakening. It is also a sign that the trend might change.
Topping – Indicators are suggesting that while the trend remains up there are considerable signs that suggest that the market is topping.
Bottoming – Indicators are suggesting that while the trend is down there are considerable signs that suggest that the market is bottoming.
Disclaimer
David Chapman is not a registered advisory service and is not an exempt market dealer (EMD) nor a licensed financial advisor. He does not and cannot give individualised market advice. David Chapman has worked in the financial industry for over 40 years including large financial corporations, banks, and investment dealers. The information in this newsletter is intended only for informational and educational purposes. It should not be construed as an offer, a solicitation of an offer or sale of any security. Every effort is made to provide accurate and complete information. However, we cannot guarantee that there will be no errors. We make no claims, promises or guarantees about the accuracy, completeness, or adequacy of the contents of this commentary and expressly disclaim liability for errors and omissions in the contents of this commentary. David Chapman will always use his best efforts to ensure the accuracy and timeliness of all information. The reader assumes all risk when trading in securities and David Chapman advises consulting a licensed professional financial advisor or portfolio manager such as Enriched Investing Incorporated before proceeding with any trade or idea presented in this newsletter. David Chapman may own shares in companies mentioned in this newsletter. Before making an investment, prospective investors should review each security’s offering documents which summarize the objectives, fees, expenses and associated risks. Although Artificial Intelligence (AI) may be deployed from time to time, AI output is monitored and adjusted, if necessary, for accuracy. David Chapman shares his ideas and opinions for informational and educational purposes only and expects the reader to perform due diligence before considering a position in any security. That includes consulting with your own licensed professional financial advisor such as Enriched Investing Incorporated. Performance is not guaranteed, values change frequently, and past performance may not be repeated.
About the author


Website: https://www.enrichedinvesting.com
Disclaimer: David Chapman is not a registered advisory service and is not an exempt market dealer (EMD) nor a licensed financial advisor. We do not and cannot give individualised market advice. David Chapman has worked in the financial industry for over 40 years including large financial corporations, banks, and investment dealers. The information in this newsletter is intended only for informational and educational purposes. It should not be considered a solicitation of an offer or sale of any security. The reader assumes all risk when trading in securities and David Chapman advises consulting a licensed professional financial advisor before proceeding with any trade or idea presented in this newsletter. David Chapman may own shares in companies mentioned in this newsletter. We share our ideas and opinions for informational and educational purposes only and expect the reader to perform due diligence before considering a position in any security. That includes consulting with your own licensed professional financial advisor.