
Following the election, which delivered a major rebuke to President Trump, markets went wild. The day after the election saw a wild upward move driven by elation. The next day it all reversed and then some. Apparently $2.5 trillion was wiped out, just like that. A divided government is usually good for gridlock. Instead this one might just signal chaos given that Trump has veto power and is known for his extreme confrontation. Hold your elation.
We note an interesting relationship between bonds and gold. Since 1970 and the end of the gold standard they are usually in sync (bond yields/gold) although they diverged during one period. It's contrary to popular opinion.
The October job numbers came out in the U.S. and Canada this past week. The U.S. surprised to the upside. Canada disappointed. The job numbers are the subject of our chart of the week.
Is the bear market underway? Stocks broke down this past week. The NASDAQ entered correction territory. Many individual stocks are in bear markets including some MAG7. Is the AI hangover under way? But gold leaped putting in its best week in months. We highlight the divergence between gold/silver and gold stocks. The action suggests we may have made a low. This would bode well for precious metals streaming companies such as Wheaton Precious Metals Corp., that reported increased revenue, higher net earnings, and stronger operating cashflows, pays a dividend, and is held in the Enriched Capital Conservative Growth Strategy.* Although we are not out of the woods yet.
Oil prices sank. Is the oil bull over? Probably not. With any pretense of control no longer on Trump instead we may get the opposite as some including Trump are suggesting to nuke Iran. No, not Tehran but instead the mountain area where Iran's nuclear facilities are alleged to be kept. By the end of the weekend things were already starting to heat up there once again. Whither oil prices. The elation over this past week's drop in prices may be short lived.
This week we get the October inflation numbers. They are expected to be chilly, just like the weather.
Have a great week.
DC
* Reference to the Enriched Capital Conservative Growth Strategy and its investments, celebrating an 8.67 - year history of 195% growth (annual 13.31%) to September 30, strong alpha and ranking amongst the top at www.emergingmanageralliance.com, is added by Margaret Samuel, President, CEO and Portfolio Manager of Enriched Investing Incorporated, who can be reached at 416-203-3028 or msamuel@enrichedinvesting.com This information should not be construed as an offer, or a solicitation of an offer or sale of any security. Past performance does not guarantee future returns.
“I know nothing grander, better exercise … more positive proof of the past, the triumphant result of faith in humankind, than a well-contested election.”
—Walt Whitman, American poet, essayist, journalist, considered one of the most influential poets in American and world literature, wrote poetry collection Leaves of Grass (1855); 1819–1892
“The longer you can look back, the further you can look forward.”
—Winston Churchill, British statesman, military officer, writer, prime minister of the U.K. 1940–1945, 1951–1955, member of parliament 1900–1964, born into the aristocratic Spencer family; 1874–1965
“When America sneezes, the rest of the world catches a cold.”
—anonymous (circa 1929)
The election is over. Apparently, President Trump won’t be challenging the results. Unlike the vote for president, confirmation and certification is state by state. It also has to be completed by the end of December. States will have their own timeline. The new Congress and Senate take their seats on January 3, 2027. There should be no January 6 insurrection this time as was the case in 2021 with the certification of the president that is elected across the country. In that respect, President Trump has been subdued. Although, maybe not.
Markets rejoiced. The Dow Jones Industrials (DJI) soared over 1,600 points the next day. Not so much the S&P 500 and NASDAQ. Gold soared over $100, with silver and the gold stocks following. The US$ Index lost altitude and bond yields fell. The market sees gridlock for the next two years. Gridlock is music to the market’s ears. Historically, markets perform well into the pre-election year and perform well with gridlocked governments. Yes, the president can override with veto power, but then Congress and the Senate need a two-thirds majority to override a veto, something not attainable unless enough Republicans side with the Democrats.
Follow-through the next day was mixed, as gold jumped again, but stocks didn’t just falter; they completely reversed. The DJI gave back all its November 4 gains and then some. Bond yields bounced back up. Seems that bond yields rejoiced that there will be less government spending. That’s not a given as the president maintains authority over economic and foreign policy. Nonetheless, the relationship between the president and Congress/Senate will be anything but friendly, even as Trump has struck a more conciliatory tone, given that his ability to challenge the results this time is difficult.
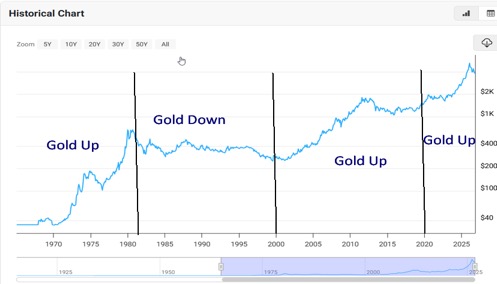
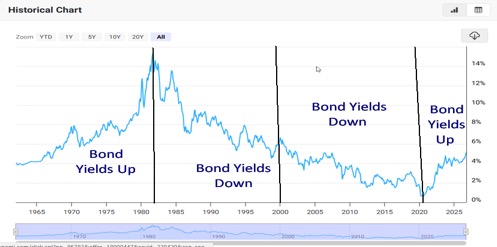
An interesting relationship we read at Elliott Wave International (www.elliottwave.com) points out that, contrary to popular opinion, gold and bond yields do move together (it’s the opposite for bond prices as they move inversely to yields). Many believe that when bond yields move higher, gold will fall. But generally, that’s not what the record shows. From 1970 to 1980/1981, bond yields rose sharply. Gold soared as well. From 1981 to 2000, bond yields fell. But so did gold.
Source: www.macrotrends.net
Source: www.macrotrends.net
The next period saw the divergence. From 2000 to 2020, bond yields continued to fall but gold soared into 2011 before having its down move into 2015 and then starting to rise again.
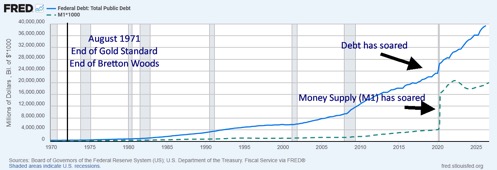
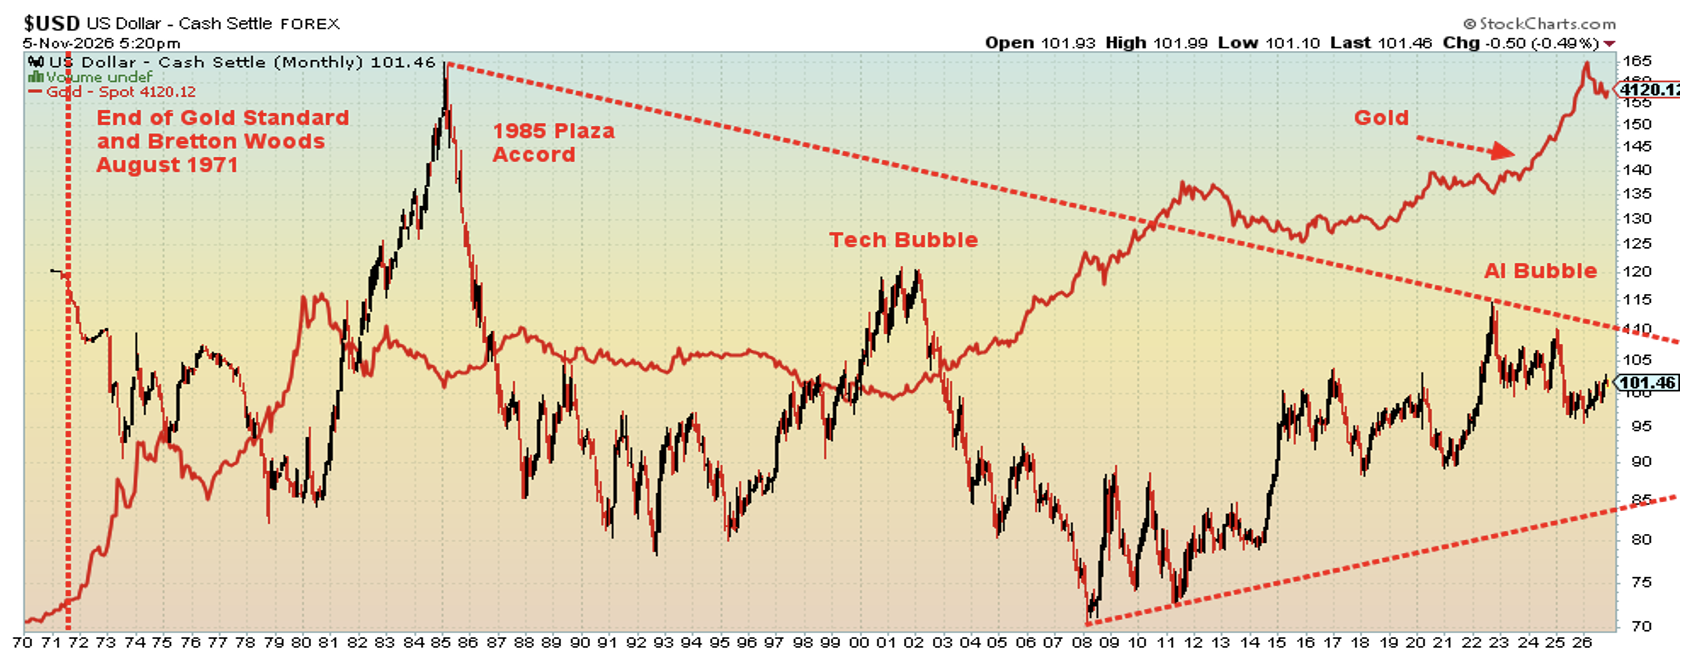
Was that the anomaly? It’s hard to say, but since 2020 bond yields started to rise again and so did gold. Yes, gold topped in January 2026 while bond yields kept rising, but so far gold’s long-term uptrend has held. No, they do not always march in the same direction, even during a period where bond yields rise and gold rises. But the longer-term relationship is interesting. It is difficult to compare the two before 1970 as gold prices were fixed. The gold standard collapsed in August 1971 when President Richard Nixon took the world off the gold standard, signalling the end of Breton Woods and the beginning of the period of fiat currencies. Since then, debt and money supply have soared while, despite up periods, the US$ Index has been in a long-term downtrend.
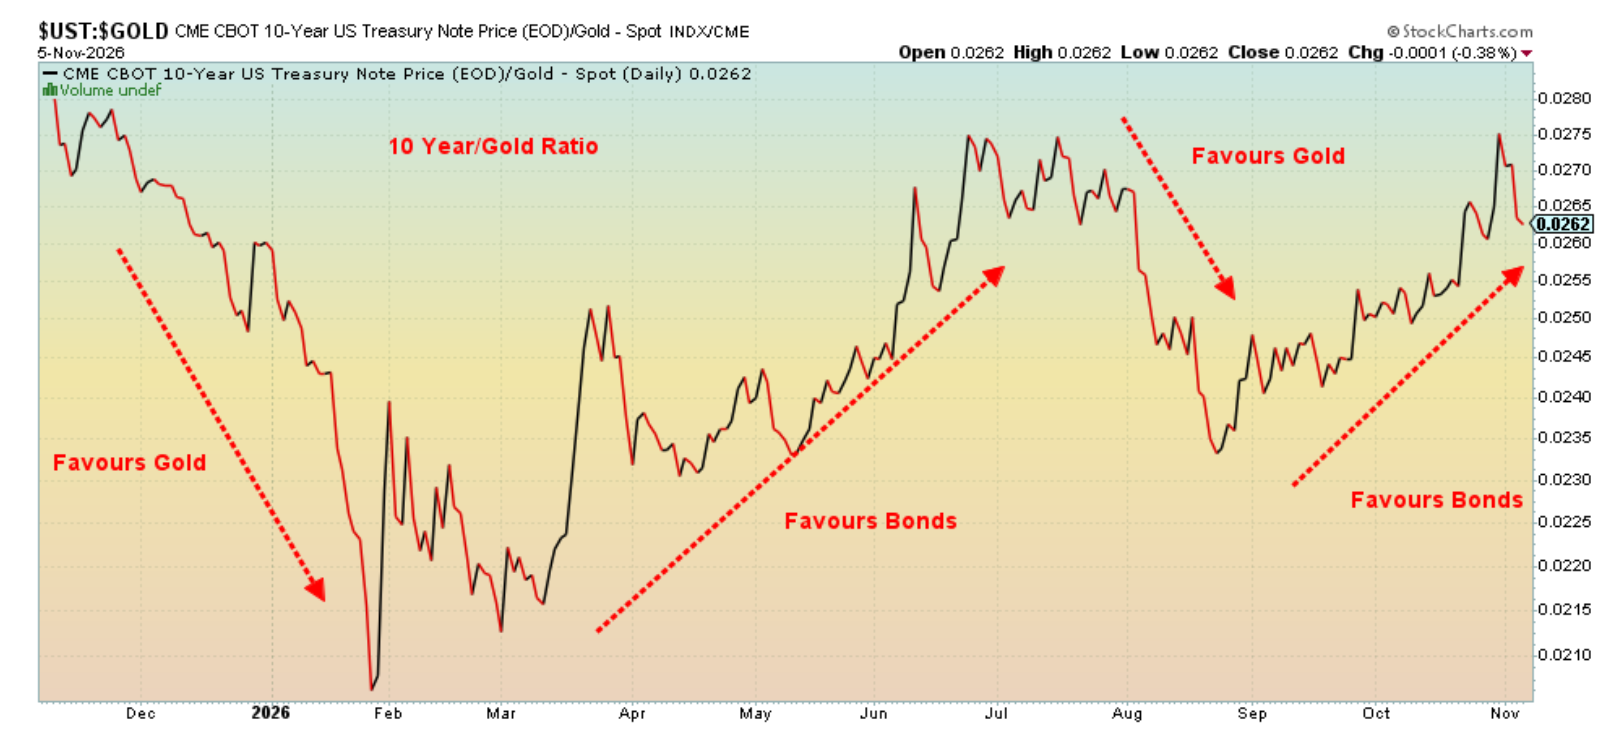
We may be wise to pay attention to the bond/gold ratio. It is represented in the following chart with the 10-year Treasury note/gold ratio. The bonds are represented by the 10-year using price, not yield. Since 2000 the ratio has consistently favoured holding gold over bonds. But the past year has been choppier as this chart shows.
Source: www.stockcharts.com
U.S. federal debt today stands at $40.6 trillion while the annual deficit now exceeds $2 trillion. Interest on the debt is last reported at $1.1 trillion annually but is rising. Money supply (M1) stands at $20 trillion. In 2000, the federal debt was $5.7 trillion, M1 stood at $1.1 trillion, interest on the debt was $355 billion, and the U.S. ran a budget surplus in 2000 of $236 billion. How things have changed. Trump may have been rebuked but the debt and interest payments are not going away. They are probably going even higher.
U.S. Federal Debt, M1 1970–2026
Source: www.stlouisfed.org, www.federalreserve.gov
With President Trump’s hands still firmly on foreign policy, the Iran war could continue. The huge sell-off in the stock market on November 5 was a counterreaction to the elation the day after the election. While Trump can control foreign policy, he may have a harder time with domestic policy. Tighter regulation could be in store for AI, plus the ongoing pushback against data centres is not ending. A top in capital spending may also be at hand. The MAG7 were estimated to have seen $1 trillion in market value wiped out on November 5. Copper prices fell on the fears that there would be less spending on the data centres.
Is that the signal that what this election might really trigger is sharply increased volatility?
US$ Index, Gold 1970–2026
Source: www.stockcharts.com
Chart of the week
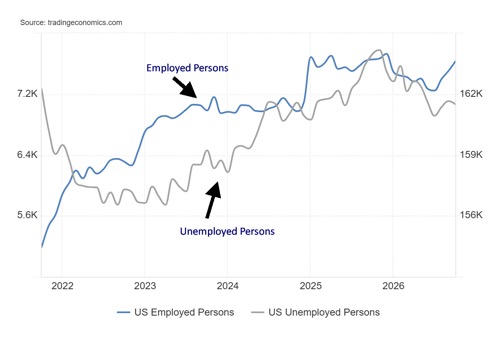
U.S. job numbers
U.S. Employed Persons, Unemployed Persons 2021–2026
Source: www.tradingeconomics.com, www.bls.gov
That was a surprise. The U.S. unexpectedly added 165,000 jobs, nonfarm payrolls, in October vs. 60,000 in September. The estimate was for a gain of 70,000 jobs. The previous two months were revised upwards by 84,000 as well. Most of the jobs came, also unexpectedly, from the private sector at 156,000. That’s another surprise, given that the ADP employment number came in at 89,000 earlier in the week. The household survey showed a big gain of 463,000 which exceeded the gain of the civilian labour force that was up 421,000. That helped lower the unemployment rate (U3) to 4.1% from 4.2%. Half the gain came from the 55+ cohort, which was another surprise. Experience matters?
However, the U6 unemployment level, which includes those working part-time who want full-time and those who aren’t looking for a job but would take one if offered, jumped to 7.9% from 7.6%. There were some
strange numbers for full-time and part-time employment. According to the household survey, full-time employment jumped 714,000 while part-time employment fell 242,000. We’ve been unable to reconcile these numbers between the establishment survey (which is the nonfarm payrolls) and the household survey (everything else).
As to specifics of where gains were seen, professional services jumped as did the usual suspects, healthcare and social assistance. Apparently, the big losers were leisure/hospitality and information technology. The category of those not in the labour force fell 481,000, suggesting those who have been unemployed for the longer term either found work or at least returned to the labour force. All this helped improve the labour force participation rate to 61.9% from 61.8%, while the employment population ratio rose to 59.3% from 59.2%.
Employment has definitely picked up. The three-month average is 137,000 vs. the six-month average is 83,000 and the one-year average 74,000. That’s an improvement. Will it hold? Or is this just a blip?
Gold was steady to mildly down, the stock market was making a feeble rebound after November 5’s big down day, and bond yields ticked mildly higher. The market seems to be taking a wait-and-see attitude towards the unexpected jump. Some are now expecting the Fed to hold the line at the December 8–9 FOMC.
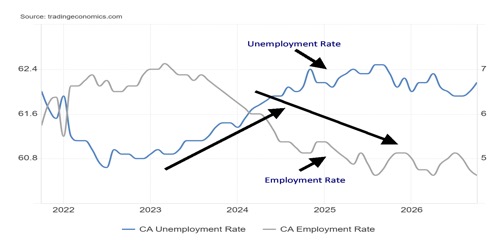
Canada job numbers
Canada Unemployment Rate, Employment Rate 2021–2026
Source: www.tradingeconomics.com, www.statcan.gc.ca
If employment jumped in the U.S., it went the opposite way in Canada. Once again, Canada saw job losses this time 4,700. That’s a lot better than the 68,300 jobs lost in September. The market had expected a gain of about 14,000. The labour force participation rate was unchanged at 64.8% while the employment population ratio fell to 60.5% from 60.6%. The unemployment rate jumped to 6.7% from 6.5% and above the expected 6.5%. The R8 unemployment, the highest reported by Statistics Canada (www.statcan.gc.ca), was steady at 8.1%.
It seems Alberta lost jobs, but British Columbia gained jobs. Newfoundland & Labrador also saw a gain in jobs. Quebec and Ontario were steady. Employment in construction jobs rose as did educational services. But losers were in wholesale and retail trade.
There wasn’t much movement in markets following the numbers. The Bank of Canada (BofC) is now expected to hold rates steady at the December 9 meeting.
Markets and Trends
|
|
|
|
% Gains (Losses) Trends |
|
||||
|
|
Close Dec 31/25 |
Close Nov 6/26 |
Week |
YTD |
Daily (Short Term) |
Weekly (Intermediate) |
Monthly (Long Term) |
|
|
|
|
|
|
|
|
|
|
|
|
|
|
|
|
|
|
|
||
|
S&P 500 |
6,845.50 |
7,376.86 |
(2.7)% |
7.8% |
down |
up (weak) |
up |
|
|
Dow Jones Industrials |
48,063.29 |
51,285.73 |
(0.9)% |
6.7% |
down |
up |
up |
|
|
Dow Jones Transport |
17,357.19 |
19,774.87 |
(2.7)% |
13.9% |
neutral |
neutral |
up |
|
|
NASDAQ |
23,241.99 |
24,579.42 |
(3.4)% |
5.8% |
down |
neutral |
up |
|
|
S&P/TSX Composite |
31,712.76 |
35,789.09 |
0.5% |
12.9% |
neutral |
up |
up |
|
|
S&P/TSX Venture (CDNX) |
987.74 |
822.03 |
2.3% |
(16.8)% |
down |
down |
up`(weak) |
|
|
S&P 600 (small) |
1,467.76 |
1,673.98 |
(1.9)% |
14.9% |
down (weak) |
neutral |
up |
|
|
ACWX MSCI World x US |
67.18 |
72.08 |
(1.8)% |
7.3% |
down |
neutral |
up |
|
|
Bitcoin |
87,576.98 |
75,815.76 |
(1.4)% |
(13.4)% |
down |
up |
up (weak) |
|
|
|
|
|
|
|
|
|
|
|
|
Gold Mining Stock Indices |
|
|
|
|
|
|
|
|
|
Gold Bugs Index (HUI) |
701.49 |
737.28 |
13.5% |
5.1% |
neutral |
down (weak) |
up |
|
|
TSX Gold Index (TGD) |
817.76 |
889.02 |
15.7% |
8.7% |
neutral |
down (weak) |
up |
|
|
|
|
|
|
|
|
|
|
|
|
Bonds% |
|
|
|
|
|
|
|
|
|
U.S. 10-Year Treasury Bond yield |
4.17% |
4.87% |
(1.4)% |
16.8% |
|
|
|
|
|
3.3Cdn. 10-Year Bond CGB yield |
3.44% |
3.66% |
(3.7)% |
6.4% |
|
|
|
|
|
Recession Watch Spreads |
|
|
|
|
|
|
|
|
|
U.S. 2-year 10-year Treasury spread |
0.69% |
0.34% |
flat |
(50.7)% |
|
|
|
|
|
Cdn 2-year 10-year CGB spread |
0.85% |
0.52% |
6.1% |
(38.8)% |
|
|
|
|
|
|
|
|
|
|
|
|
|
|
|
Currencies |
|
|
|
|
|
|
|
|
|
US$ Index |
98.26 |
102.29 |
0.4% |
4.1% |
up |
up |
neutral |
|
|
Canadian $ |
72.87 |
70.79 |
(1.2)% |
(2.9)% |
neutral |
down |
down |
|
|
Euro |
117.48 |
111.41 |
(0.2)% |
(5.2)% |
down |
down |
neutral |
|
|
Swiss Franc |
126.21 |
121.89 |
0.5% |
(3.4)% |
up |
down |
up (weak) |
|
|
British Pound |
134.78 |
133.5 |
(0.3)% |
(0.9)% |
neutral |
neutral |
up |
|
|
Japanese Yen |
63.83 |
63.09 |
(0.6)% |
(1.2)% |
down |
neutral |
down |
|
|
|
|
|
|
|
|
|
|
|
|
Precious Metals |
|
|
|
|
|
|
|
|
|
Gold |
4,311.97 |
4,065.65 |
4.8% |
(5.7)% |
down |
down |
up |
|
|
Silver |
71.16 |
51.91 |
5.5% |
(27.1)% |
down |
down |
up (weak) |
|
|
Platinum |
2,046.90 |
1,532.90 |
6.6% |
(25.1)% |
down |
down |
up (weak) |
|
|
|
|
|
|
|
|
|
|
|
|
Base Metals |
|
|
|
|
|
|
|
|
|
Palladium |
1,619.50 |
1,021.50 |
4.3% |
(36.9)% |
down |
down |
down |
|
|
Copper |
5.64 |
6.24 |
(3.4)% |
10.6% |
down |
up (weak) |
up |
|
|
|
|
|
|
|
|
|
|
|
|
Energy |
|
|
|
|
|
|
|
|
|
WTI Oil |
57.44 |
90.49 |
(12.1)% |
57.5% |
down |
up (weak) |
up |
|
|
Nat Gas |
3.71 |
2.97 |
3.1% |
(20.0)% |
neutral |
neutral |
neutral |
|
Source: www.stockcharts.com
* New All-Time Highs
Note: for an explanation of the trends, refer to the glossary at the end of this article.
New highs/lows refer to new 52-week highs/lows and, in some cases, all-time highs.
Stocks
Source: www.pinterest.com
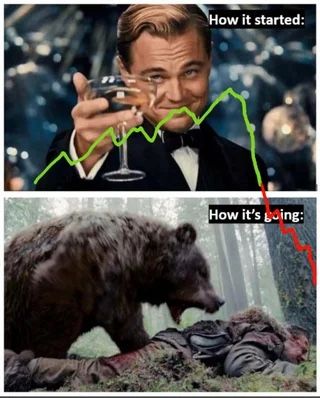
Thanks, Mike, for the idea of the bear meme. What a dramatic week. On November 4, following the elation of the elections, the Dow Jones Industrials (DJI) leaped almost 1,600 points. On November 5 they changed their minds and the DJI fell 1,800 points. Bubbly one day; a mauling the next. Jay Gatsby (The Great Gatsby) would approve the bubbly. We suspect Jordan Belfort (The Wolf of Wall Street) would approve as well. Then came the mauling - Hugh Glass (The Revenant). Oh yes, both Gatsby and Belfort ended up getting mauled too.
The NASDAQ is now in correction territory. Google and Tesla are in bear markets. Apparently $2.5 trillion was wiped out from markets on Thursday. Elon Musk is no longer a trillionaire. Okay, he’s still the richest person in the world with Forbes estimating his wealth at $850 billion. If Elon were a country, he’d rank number 23 behind Taiwan but ahead of Belgium. Goldman Sachs advises that almost 60% of stocks are in bear markets, down over 20% from their highs. Tesla is down 27%, while SpaceX is down 40% from their highs. The Tesla Cybertruck is no more. A symbol of our times?
Source: www.stockcharts.com
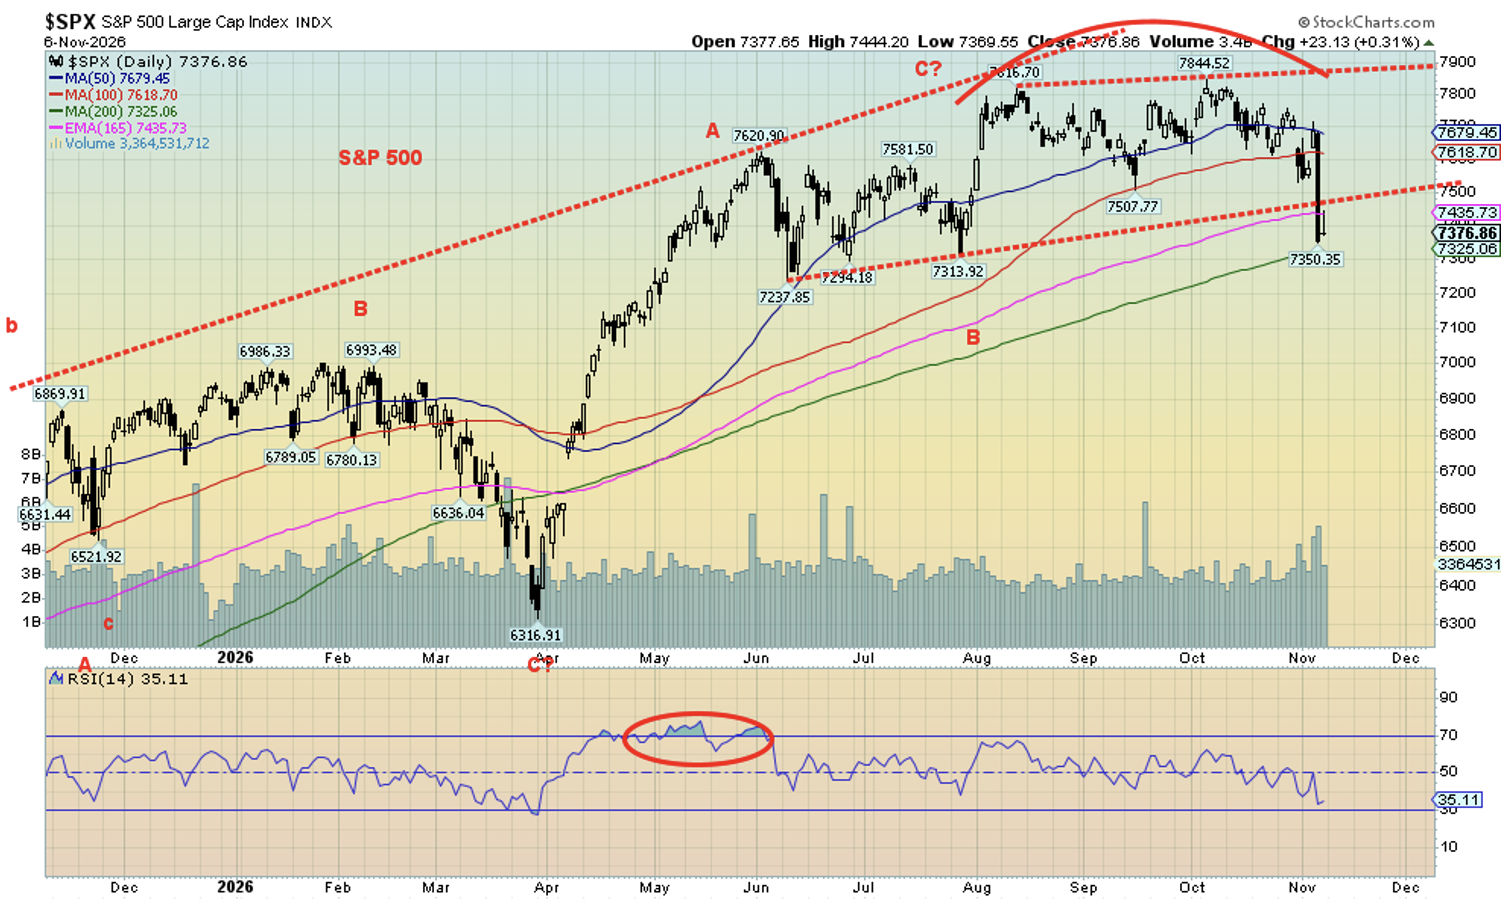
Okay, maybe we are still early in calling a bear market. For the past few weeks, we’ve been warning that the market looked increasingly vulnerable. This past week showed that it is. The S&P 500 broke down from its topping pattern. So did the NASDAQ and the DJI. That said, the DJI is still hanging in and needs to break under 50,000 to suggest a top is in. A correction is underway. But a bear market? That’s too early to call, even as many stocks are already in bear markets. But the big cap AI and high-tech stocks led the market up and are now at least wobbling. Tesla and Netflix are down over 20% on the year. Google is down over 20% from its all-time high. But Apple, Amazon, Advanced Micro (AMD), and Micron remain nicely up on the year. One we’d like to mention that is being slaughtered is Trump Media (DJT), which fell a whopping 28.6% this past week. It is down 70% in 2026 and down 98% from its all-time high. Not even Trump’s approval rating has fallen that far. Call it the Trump mauling.
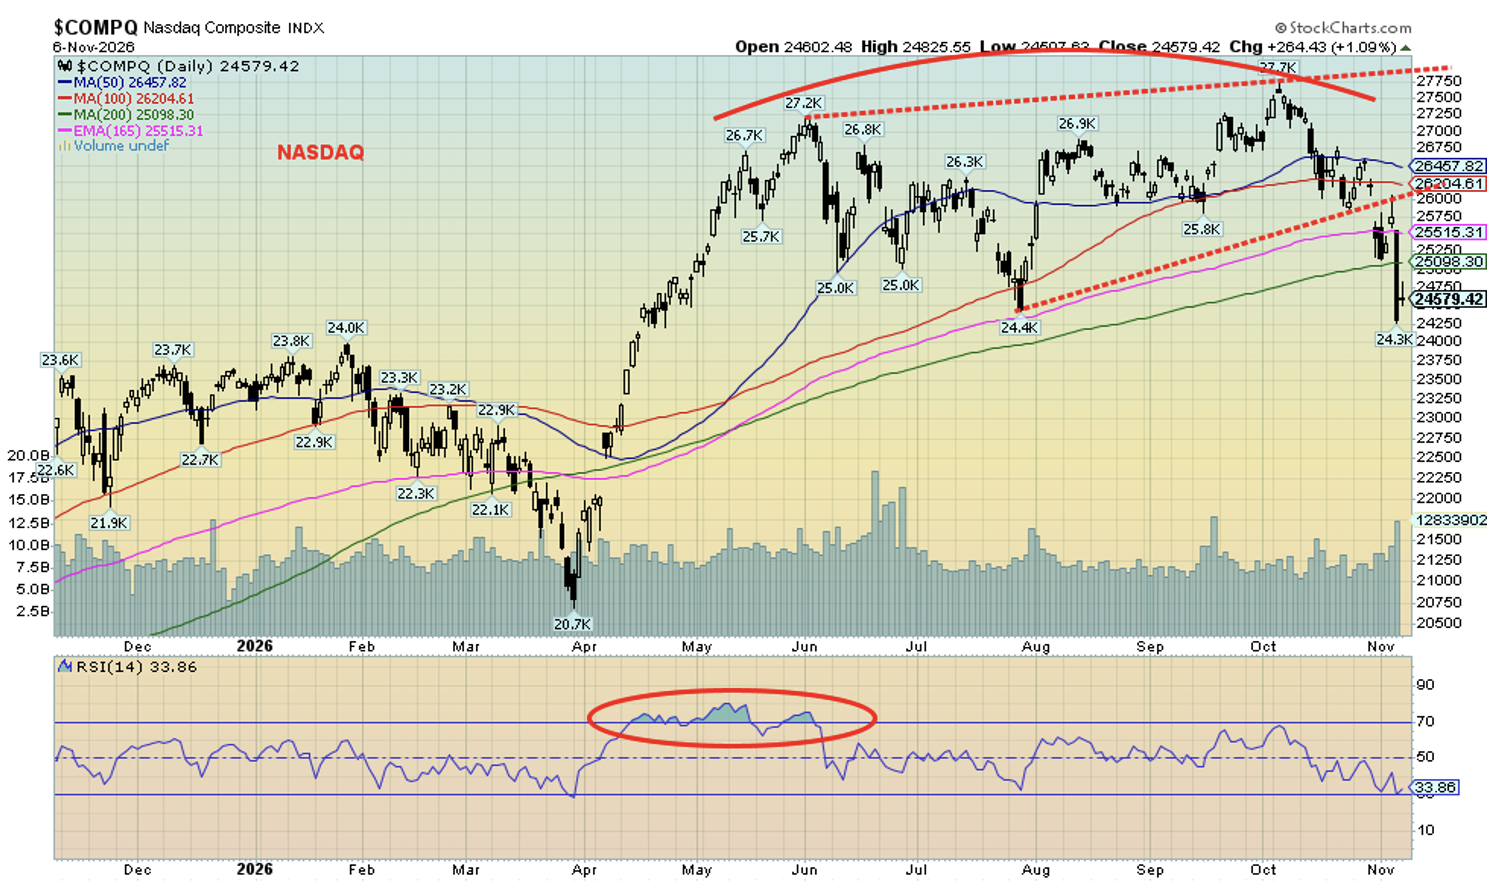
It was not a pleasant week. The post-election day rally was a one-day wonder. On the week, the S&P 500 fell 2.7%, the DJI was down 0.9%, the Dow Jones Transportations (DJT) lost 2.7%, and the NASDAQ fell 3.4%. The S&P 400 (Mid) lost 1.6% while the S&P 600 (Small) fell 1.9%. The NY FANG Index dropped 4.3%, but to show the broader market wasn’t as bad the S&P 500 Equal Weight Index was down only 1.1%. Bitcoin fell 1.4%.
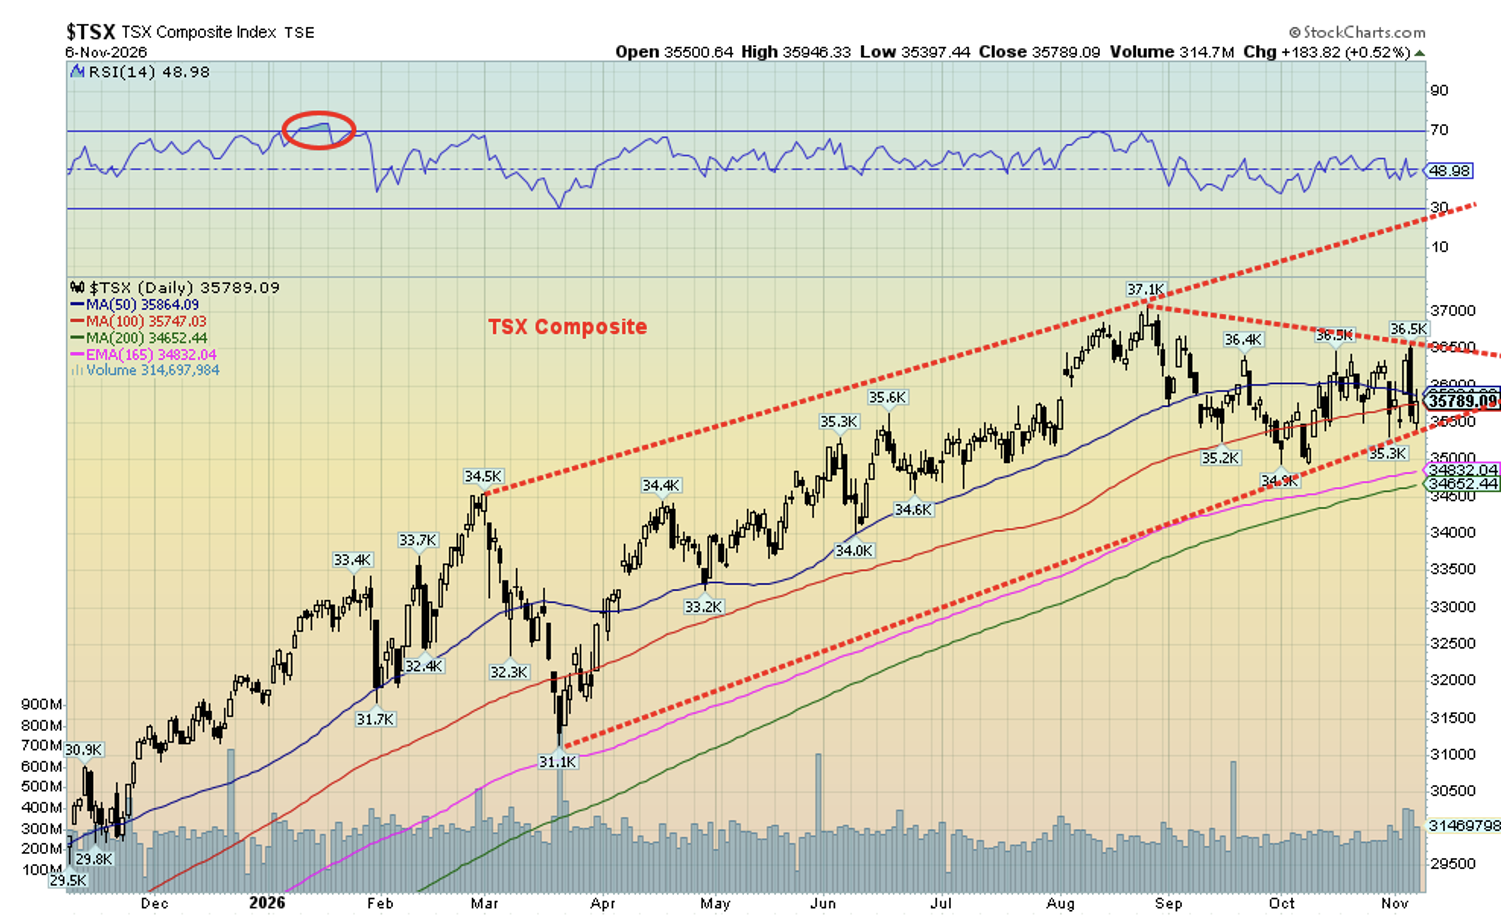
In Canada, the TSX Composite bucked the trend, gaining 0.5% thanks to strong gains from the materials (Golds (TGD), Metals (TGM), and Materials (TMT)), offsetting the big drop for the TSX Energy Index (TEN). Even the TSX Venture Exchange (CDNX) came to life and gained 2.3% this past week.
Source: www.stockcharts.com
The EU was mixed. The London FTSE fell 0.6% but the EuroNext and the German DAX were flat on the week. The Paris CAC 40 gained 2.1% despite the ongoing riots on the streets. In Asia, China’s Shanghai Index (SSEC) rose 1.4% but Japan’s Tokyo Nikkei Dow (TKN) dropped a sharp 9.3%. Hong Kong’s Hang Seng (HSI) rose 4.7% while India’s Nifty Fifty leaped 8.6%. Funds moving from Japan to Hong Kong/India?
One thing to keep in mind is the ongoing turmoil in the EU as the France riots spread to other countries. Also, the rhetoric of war vs. Russia keeps rising. Could that be followed by capital flight from the EU? After all, that’s what happened during World War I and World War II, and the beneficiary was the U.S. markets stocks and bonds. Something to keep in mind.
The S&P 500 has broken the topping pattern and is hanging just above the 200-day MA near 7,350. A break of 7,300 could send the S&P 500 lower. We don’t have significant support until around 6,900/7,000. A return back above 7,500 might be positive. The NASDAQ has firmly broken under its topping pattern and is now below the 200-day MA. Targets could be down to 22,000/23,000. With an RSI near 34 we have room to move lower. The DJI needs to break under 50,000 to trigger further losses. The TSX is the best performer as it hasn’t broken under its topping pattern. It needs to get under 35,000 to start further drops.
Source: www.stockcharts.com
It was a nasty week with that reversal on November 5. Is that the start of a bigger drop? It remains to be seen. We noted before we were intrigued with some comparison to the 2000 top. In that market the DJI topped in January and two months later the S&P 500 and the NASDAQ topped. What followed was a swift collapse of 40% for the NASDAQ but only 14% for the S&P 500. This time the DJI topped in August and two months later in October the S&P 500 and NASDAQ topped. We now appear to be starting a decline. In 2000 the markets fell into April/May. If the pattern holds, we’ll fall into December/January before we start a recovery. The markets rebounded in 2000 into September/October before the major decline began. While they fell short of new highs, we recognize that new highs could still occur following a decline now. Patterns can repeat themselves.
From bubbly to a mauling. Bull markets last a long time – on average at least two years but sometimes as long as eight years. Bear markets are short and swift, lasting only about a year but sometimes lasting as long as 2.5 years. The current bull started in 2022 and lasted until the top in 2026. Now comes the reckoning.
Bonds
Source: www.tradingeconomics.com, www.home.treasury.gov, www.bankofcanada.ca
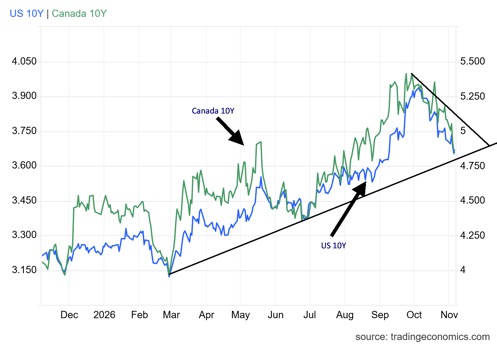
Bonds love gridlock so bond yields fell this past week. Then came Friday’s job numbers that were stronger than expected and they bounced up again. But on the week the U.S. 10-year Treasury note fell to 4.87% from 4.94% the previous week. The Canadian 10-year Government of Canada bond (CGB) also fell, helped further by the weak job numbers in Canada. The 10-year fell to 3.66% from 3.80%.
This week we get the U.S. inflation numbers for October. The market is expecting 3.7% year-over-year, unchanged from the previous month. The bonds appear to have support below. The U.S. near 4.75% and Canada near 3.50%. A break of those levels could signal further declines. However, the odds favour a rebound up instead. And if war breaks out between the U.S./Iran once again, then all bets of lower rates are off. The longer-term trend remains up for bond yields.
Gold and silver
Source: www.stockcharts.com
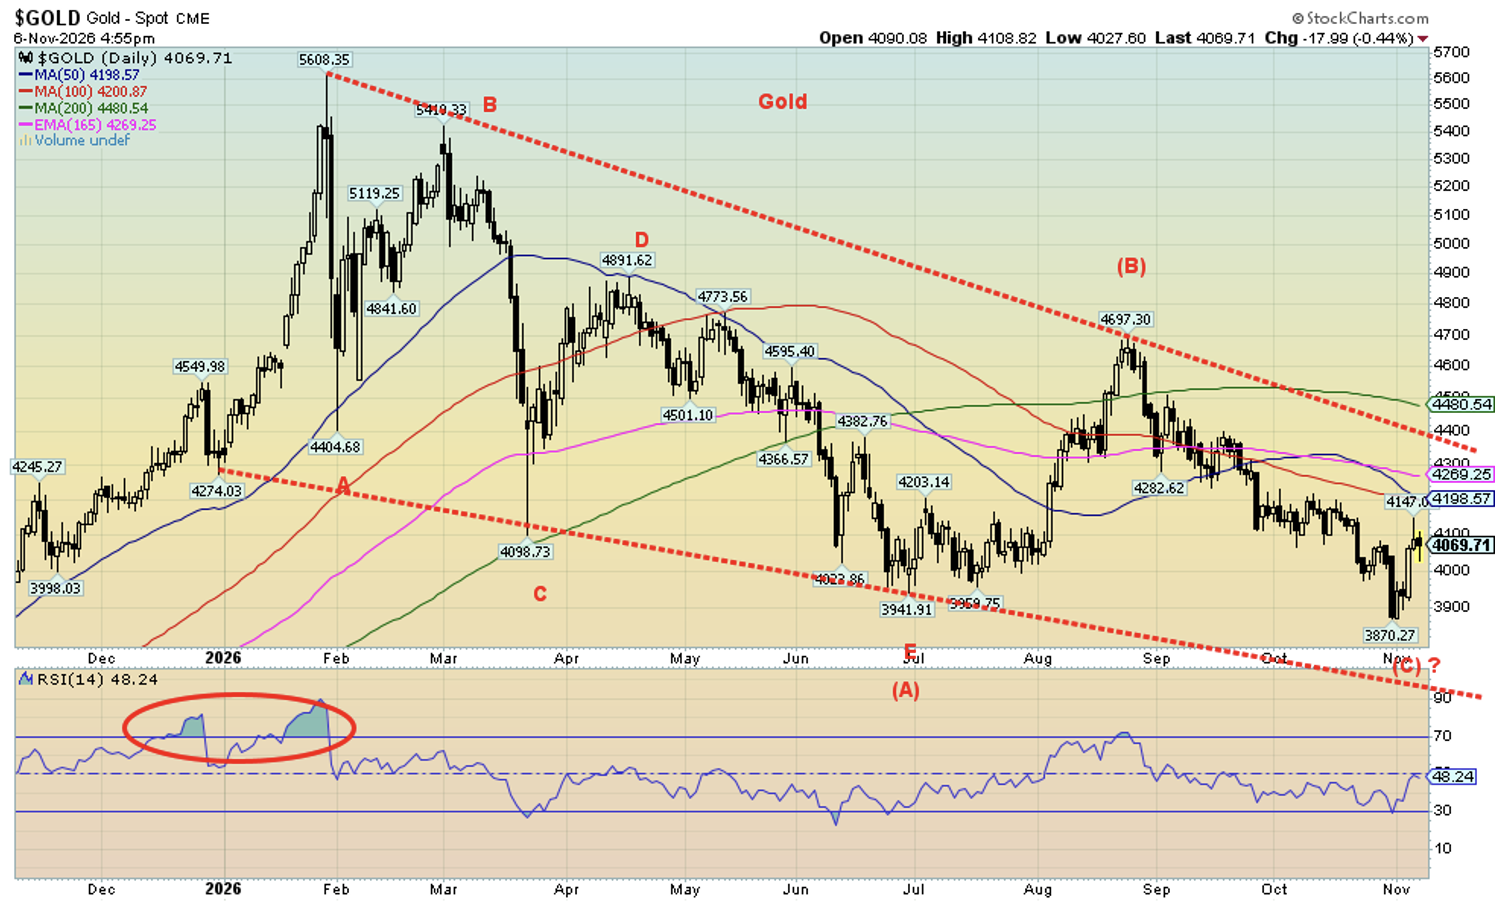
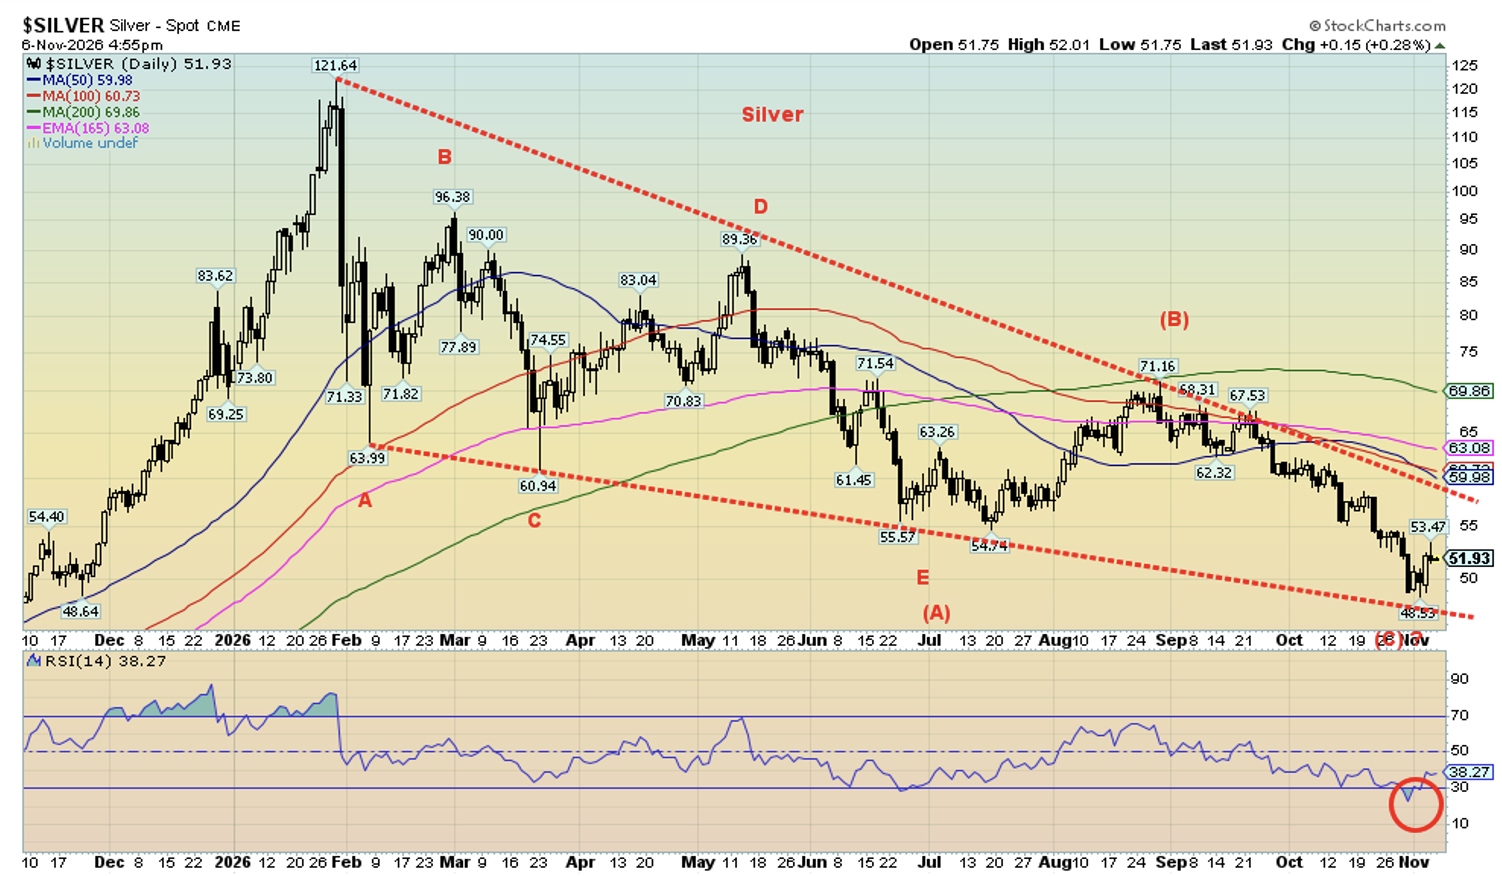
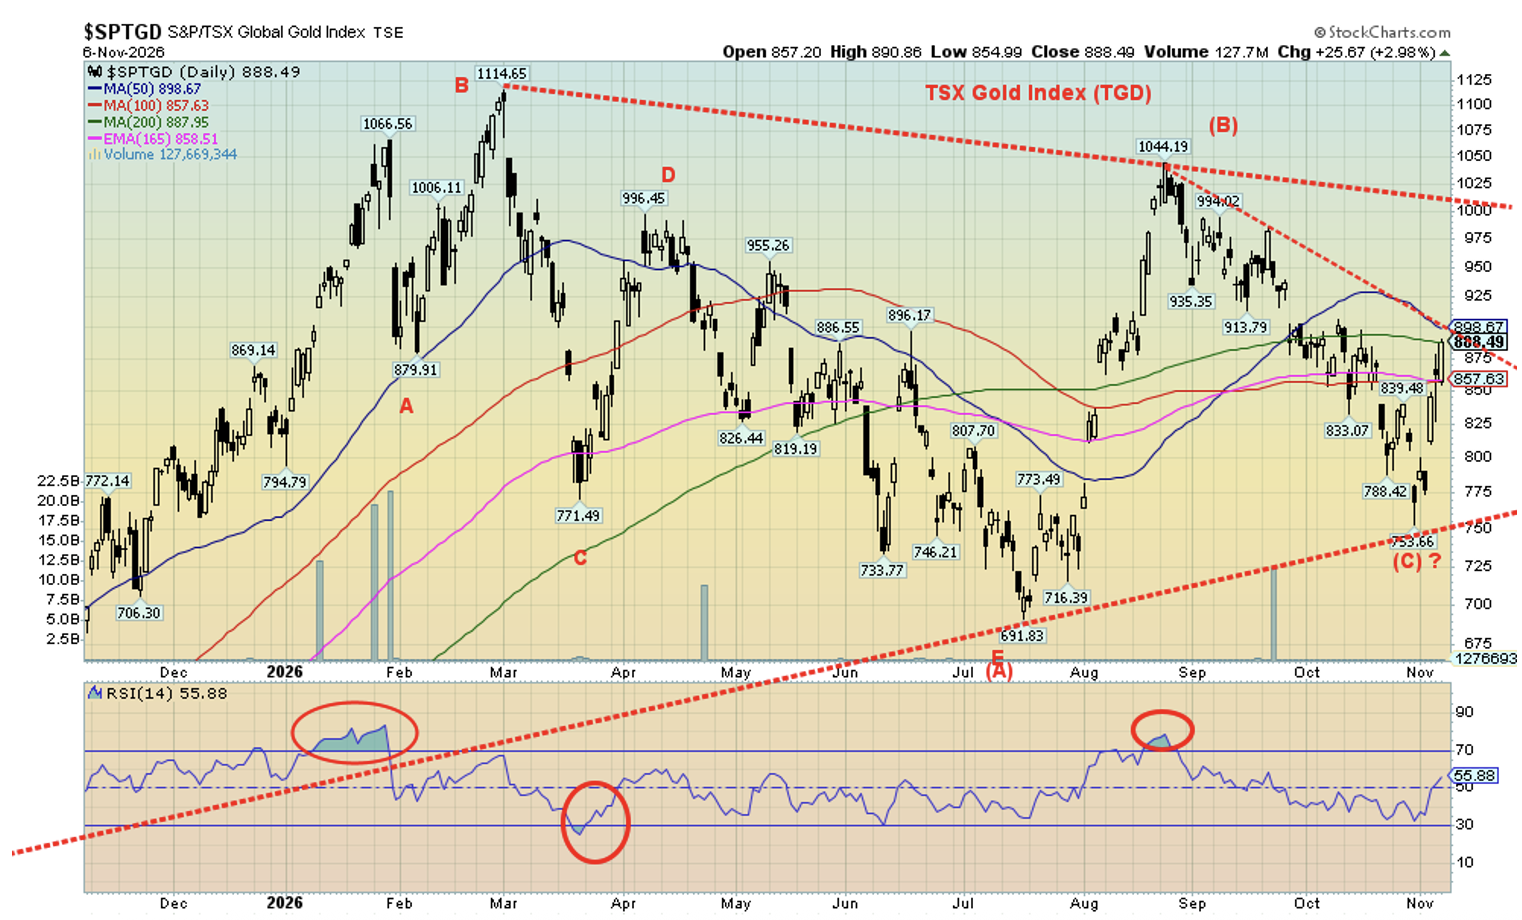
Have gold and precious metals bottomed? This week was quite encouraging. The results of the U.S. election seemed to give gold a boost as it ended a three-week losing streak and put in its best week since August. Yes, gold fell about 0.5% on Friday, but silver and the gold stocks did not. Gold leaped 4.8% on the week and silver was up 5.5%, but it was the gold stocks that really shone. The Gold Bugs Index (HUI) was up 13.5%, and the TSX Gold Index (TGD) rose 15.7%. The rally in the gold stocks was so good that both the HUI and TGD are once again positive on the year.
We had noted previously the divergence between the gold stocks indices and the metals gold and silver. Both gold and silver made fresh lows for the move down since January 2026 but the HUI and the TGD did not. Indeed, they were above their recent lows and performance-wise they have generally outperformed gold and silver. Since the top in January 2026 to the recent low, gold lost 31%, silver was hammered, down 60%, but the HUI fell 41% and the TGD only 38%. But that was the July low. At the more recent low the HUI was down 35% while the TGD was off 32%. That’s higher lows, even as gold and silver made lower lows. A strong performance for the gold stocks, which normally would have seen 70% drops when gold fell 30%.
Source: www.stockcharts.com
The result is we are encouraged that gold may have seen its low. Now we enter a more positive seasonal period for gold and silver. But hold on – we are not out of the woods yet. Indeed, we would not be surprised that we continue a choppy pattern until the December 8–9 FOMC and the interest rate decision. Gold still fears higher interest rates and expectations remain for the moment that the Fed will hike at its next meeting, especially after the bullish jobs report. As long as we make no new lows, the set-up could be into the Fed period before we really start to rise.
On the charts, gold failed to hit that downtrend line while silver remains in what looks like a huge descending wedge triangle (bullish). The breakout point for gold is above $4,400, but we’d prefer above $4,500 to confirm a low. For silver, that is above $60 but regaining above $70 would confirm the low. The TGD pattern is different and a breakout above 900 would be positive and especially above 1,000. What’s key is that the low near 750 holds on any further pullback. We like the odds.
A gridlocked U.S. government is good, and turmoil will continue in the U.S. And, as noted, with Trump still in charge of foreign policy, a restart of the U.S./Iran war could also be positive for gold. We are reminded that Trump even at 30% approval still has over 50 million believers. Another reason for market turmoil is the ongoing turmoil in the EU, particularly France, where we could see some flight of capital, especially if the rhetoric vs. Russia amps up further. Capital flight could in turn be positive for the U.S. bond and stock markets, as well as for gold/silver and the gold stocks.
Source: www.stockcharts.com
Oil and gas
Source: www.stockcharts.com
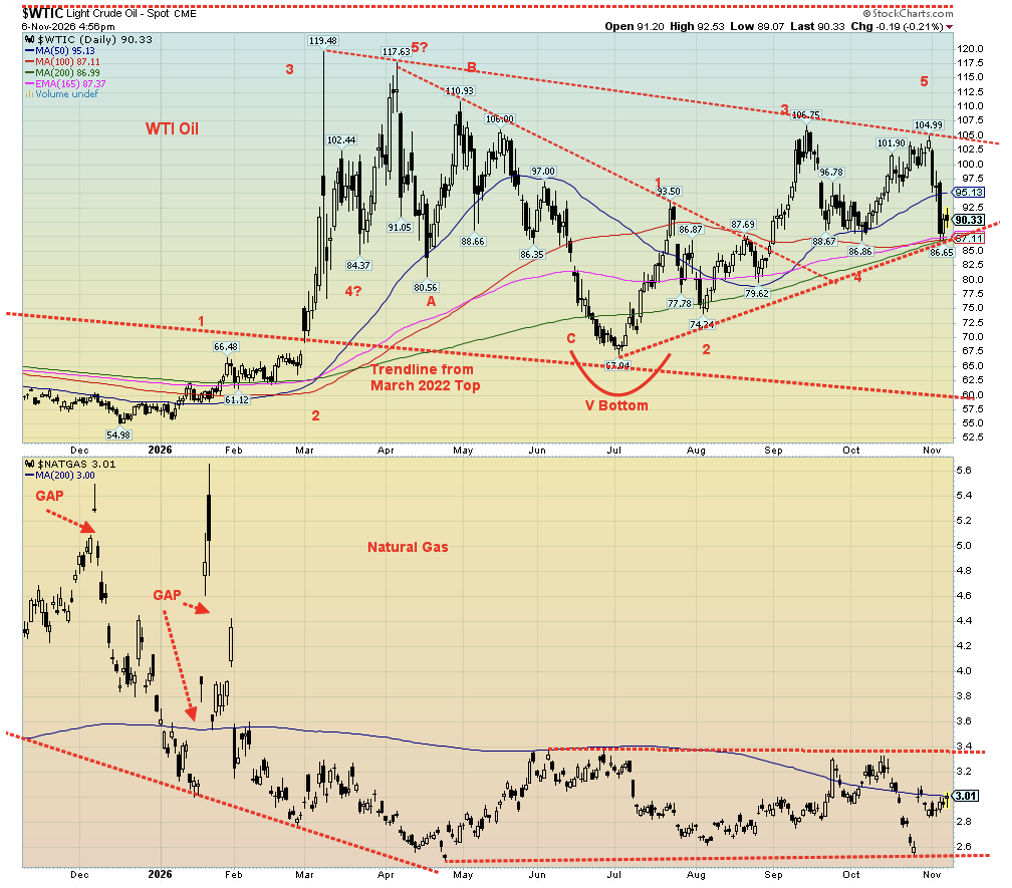
It’s peace in our time. Or maybe not. For whatever reason, hopes of a U.S./Iran peace deal were at the top of discussions. That in turn fueled bearish sentiment towards oil and natural gas (NG), even though Iranian drone attacks in the Strait of Hormuz continued. It was one of the steepest drops in memory. Yes, we bounced up by Friday, but WTI oil finished the week down 12.1% to around $90 while Brent crude fell 13% to around $98. NG didn’t fare any better, even though NG at the Henry Hub jumped 3.1% but NG at the EU Dutch Hub plunged 15.7%. The energy stocks coughed up a spitball as the ARCA Oil & Gas Index (XOI) fell 13.2% and the TSX Energy Index (TEN) dropped 12.7%.
So that’s it? Will prices at the gas pumps plunge as a result? President Trump gets to brag how he made peace with Iran and lowered oil prices. Hold on. Trump may have lost both Congress and the Senate, making his domestic agenda difficult, but he maintains control over foreign policy. He’s still the boss of the military. Congress may want him to end the war, but he can ignore it as he knows the odds of them getting a two-thirds majority to override him are very difficult. He could easily restart the attack on Iran. He’s even made threats of nuking them. While the odds of that happening are slim to none, the fact he made the comment, as has others, is a threat in itself. U.S. carriers remain in the area. Any nuking of Iran would focus on the mountain supposedly containing Iran’s nuclear development facilities. Any use of nuclear weapons would be unprecedented and probably bring global condemnation.
What better way to distract attention on the home front than to restart the war on Iran, sending oil prices soaring once again. Yes, we plunged this past week, but we note that all we did was hit down to a key support zone near $90 and then rebounded. $105 remains our firm breakout zone while a firm break under $90 and especially under $88 would send prices tumbling. The pattern since that September high of $106.75 appears as a large ABC corrective. We are entering the positive oil and gas seasonal period that runs roughly from December to June.
In that respect, things could be aligned that send oil (and gas) prices higher, not lower. We may bounce around a bit from here, but as long as the $90 zone holds, the next move should be up, not down. We note evidence that oil insiders have been buying this dip. The drop this past week has all the earmarks of a knee-jerk reaction to the thoughts of peace in our time. However, there is little evidence to support that. Yes, Gulf states are looking at building more pipelines to get around the blockage at the Strait of Hormuz, but building pipelines doesn’t happen overnight. As well, the conflict between the Houthis and Saudi Arabia is not over and the Red Sea and Bab-el-Mandeb Strait blockages continue. The Russia/Ukraine war continues, and Ukraine’s targeting of Russian oil refineries has not stopped, even as Russian targeting of Ukraine energy facilities and civilian targets has not stopped, either.
Do we have a caveat for the current situation? Yes. If we firmly bust through $90 and under $88, then we could fall to the next level of support near $75, but we suspect that would be about it. The U.S./Iran is not resolved, and hostilities could start up again at any time. Trump has the power to see that happens.
Copyright David Chapman 2026
GLOSSARY
Trends
Daily – Short-term trend (For swing traders)
Weekly – Intermediate-term trend (For long-term trend followers)
Monthly – Long-term secular trend (For long-term trend followers)
Up – The trend is up.
Down – The trend is down
Neutral – Indicators are mostly neutral. A trend change might be in the offing.
Weak – The trend is still up or down but it is weakening. It is also a sign that the trend might change.
Topping – Indicators are suggesting that while the trend remains up there are considerable signs that suggest that the market is topping.
Bottoming – Indicators are suggesting that while the trend is down there are considerable signs that suggest that the market is bottoming.
Disclaimer
David Chapman is not a registered advisory service and is not an exempt market dealer (EMD) nor a licensed financial advisor. He does not and cannot give individualised market advice. David Chapman has worked in the financial industry for over 40 years including large financial corporations, banks, and investment dealers. The information in this newsletter is intended only for informational and educational purposes. It should not be construed as an offer, a solicitation of an offer or sale of any security. Every effort is made to provide accurate and complete information. However, we cannot guarantee that there will be no errors. We make no claims, promises or guarantees about the accuracy, completeness, or adequacy of the contents of this commentary and expressly disclaim liability for errors and omissions in the contents of this commentary. David Chapman will always use his best efforts to ensure the accuracy and timeliness of all information. The reader assumes all risk when trading in securities and David Chapman advises consulting a licensed professional financial advisor or portfolio manager such as Enriched Investing Incorporated before proceeding with any trade or idea presented in this newsletter. David Chapman may own shares in companies mentioned in this newsletter. Before making an investment, prospective investors should review each security’s offering documents which summarize the objectives, fees, expenses and associated risks. Although Artificial Intelligence (AI) may be deployed from time to time, AI output is monitored and adjusted, if necessary, for accuracy. David Chapman shares his ideas and opinions for informational and educational purposes only and expects the reader to perform due diligence before considering a position in any security. That includes consulting with your own licensed professional financial advisor such as Enriched Investing Incorporated. Performance is not guaranteed, values change frequently, and past performance may not be repeated.
About the author


Website: https://www.enrichedinvesting.com
Disclaimer: David Chapman is not a registered advisory service and is not an exempt market dealer (EMD) nor a licensed financial advisor. We do not and cannot give individualised market advice. David Chapman has worked in the financial industry for over 40 years including large financial corporations, banks, and investment dealers. The information in this newsletter is intended only for informational and educational purposes. It should not be considered a solicitation of an offer or sale of any security. The reader assumes all risk when trading in securities and David Chapman advises consulting a licensed professional financial advisor before proceeding with any trade or idea presented in this newsletter. David Chapman may own shares in companies mentioned in this newsletter. We share our ideas and opinions for informational and educational purposes only and expect the reader to perform due diligence before considering a position in any security. That includes consulting with your own licensed professional financial advisor.