We may be entering the best six months of the year for the stock market but it's getting off to a rocky start. This reminds us a bit of 2018 and 2007, two years that peaked in October and then swooned. Will we repeat? The AI/high tech stocks fell this past week. No stock fell more so than Google, the subject of our chart of the week.
Oddly, however, even as the AI stocks faltered, the market broadened, as mid- and small-cap stocks were up. So what's going on? We outline the reasons why this market may struggle through 2027. Overvaluation, ongoing wars, rising social unrest, rising inflation, and rising interest rates are amongst the reasons this market is faltering.
The stock markets were mixed this past week: North America faltered, but the EU and Asia were mostly up. Gold and precious metals are facing a washout. Could this be the final swoon? Oil prices hesitated but the upward pressure remains as they sit on the precipice of a significant upside breakout. This is beneficial for integrated energy companies such as Cenovus Energy Inc., which last reported increased revenues, higher operating margin, and expanded excess funds flow, pays a dividend, and is held in the Enriched Capital Conservative Growth Strategy.*
This past week, the Fed stood pat on interest rates as expected, while Canada hiked rates as expected. Expectations remain that another Fed hike is coming at the December 8-9 FOMC. Inflation remains sticky even as the stock market faltered.
This past week saw the Israeli election, which ended with no one securing a majority. This week is the U.S. midterm elections, with polls suggesting the Democrats could win. But behind the scenes the Trump administration continues to chip away at election integrity with lawsuits and more. Will we face a repeat of January 6, 2021?
The October job numbers for both Canada and the U.S. are out November 6. Expectations are not high as we may see a repeat of the weak September jobs market report.
As we go into November the weather is cooling, just like the stock market it seems.
Have a great week.
DC
* Reference to the Enriched Capital Conservative Growth Strategy and its investments, celebrating an 8.67 - year history of 195% growth (annual 13.31%) to September 30, strong alpha and ranking amongst the top at www.emergingmanageralliance.com, is added by Margaret Samuel, President, CEO and Portfolio Manager of Enriched Investing Incorporated, who can be reached at 416-203-3028 or msamuel@enrichedinvesting.com This information should not be construed as an offer, or a solicitation of an offer or sale of any security. Past performance does not guarantee future returns.
“From the 1920s into the 1940s, Britain's standard of living was supported by oil from Iran. British cars, trucks, and buses ran on cheap Iranian oil. Factories throughout Britain were fueled by oil from Iran. The Royal Navy, which projected British power all over the world, powered its ships with Iranian oil.”
—Stephen Kinzer, American author, historian, journalist, correspondent for The New York Times, wrote Bitter Fruit (1982) about military coups and destabilization in Guatemala in the 1950s, others; b. 1951
“Back when Saddam Hussein was in power, the Americans didn't care about his crimes. When he was gassing the Kurds and gassing Iran, they didn't care about it. When oil was at stake, somehow, suddenly, things mattered.”
—Sam Richards, sociologist, professor at Pennsylvania State College, distinguished professor of digital culture; b. 1960
“Measuring the oil industry in dollars gives you a very warped view. Pick a sound currency such as Swiss francs or gold grams and look at the oil business through that lens.”
—Porter Stansberry, American financial publisher, author, founded Stansberry Research and the monthly newsletter Stansberry Investment Advisory, covering investments and in investment theory in stocks, commodities, and real estate; b. 1972
November begins what is called the best six months of the year. Stocks roar. Okay, maybe not so much right now. October may be the crash month, but it is also known as a bear killer, with a reputation of seeing lows. In their annual Stock Trader’s Almanac, Jeffery Hirsch and Christopher Mistal describe the period from November 1 to April 30 each year as an “eye-popping strategy.” Since 1950, the strategy has returned on average annually 7.2% for the Dow Jones Industrials (DJI) during the November 1–April 30 period vs. 1.1% annually for the May 1–October 31 period. The November 1–April 30 period has returned 59 up years vs. 17 down years. That compares to the May 1–October 31 period that saw 47 up years vs. 29 down years. All this applies to the DJI and varies with other indices and individual stocks.
It was noted that only four November 1–April 30 periods saw double-digit losses. They were: 1970 (bombing of Cambodia), 1973 (Arab oil embargo), 2008 (financial crisis), and 2020 (COVID-19 pandemic). So, all this raises the question: what about this year? The just-completed May 1–October 30 period has seen the DJI return 4.3%, the S&P 500 4.9%, the NASDAQ 1.7%, and the TSX 4.3%. For the DJI, the return is above the long-term average.
So, what will this year’s November 1–April 30 period bring? So far, it doesn’t look good. Could we have the first down November 1–April 30 period since 2020 and the pandemic? The stock market peaked on October 6, 2026, for the S&P 500 and the NASDAQ. The Dow Jones Industrials (DJI) peaked back on August 5, 2026. As we have noted, October tops in 2007 and 2018 proved fateful as bear markets followed. It also reminds us of 2000 when the DJI peaked in January while the S&P 500 and NASDAQ didn’t peak until March – two months apart, same as today. What followed was the 2000–2002 dot.com crash.
The reasons for a stock market correction are everywhere. We’ll start with some easy ones:
- The PE ratio as measured by the Schiller PE ratio is last at 41.04, just below its all-time high seen in 1999 at 44.19 before the dot.com crash. Long-term averages are around 17.4. The S&P 500 PE is at 26.3, which is well below its 2008 high but above its long-term mean of 16.2.
- The Buffett Indicator, which is a measure of stock market capitalization to GDP, stands at 233%. On that basis, the market is grossly overvalued. Long-term averages suggest a ratio of 75%–90% is reasonably valued. We haven’t seen those levels since the Great Recession/financial crisis of 2007-2009.
- High borrowing costs are an impediment to companies. While the Fed recently stood pat, inflation is putting pressure on the Fed to raise, not cut rates. That feeds through the economy, raising the cost of borrowing (mortgages).
- Rising yields on government securities (T-bills, notes, bonds) are a safe alternative to funding corporations. That could lead to crowding out as there is a switch from stocks to bonds.
- Rising inflation eats into purchasing power and corporate profit margins.
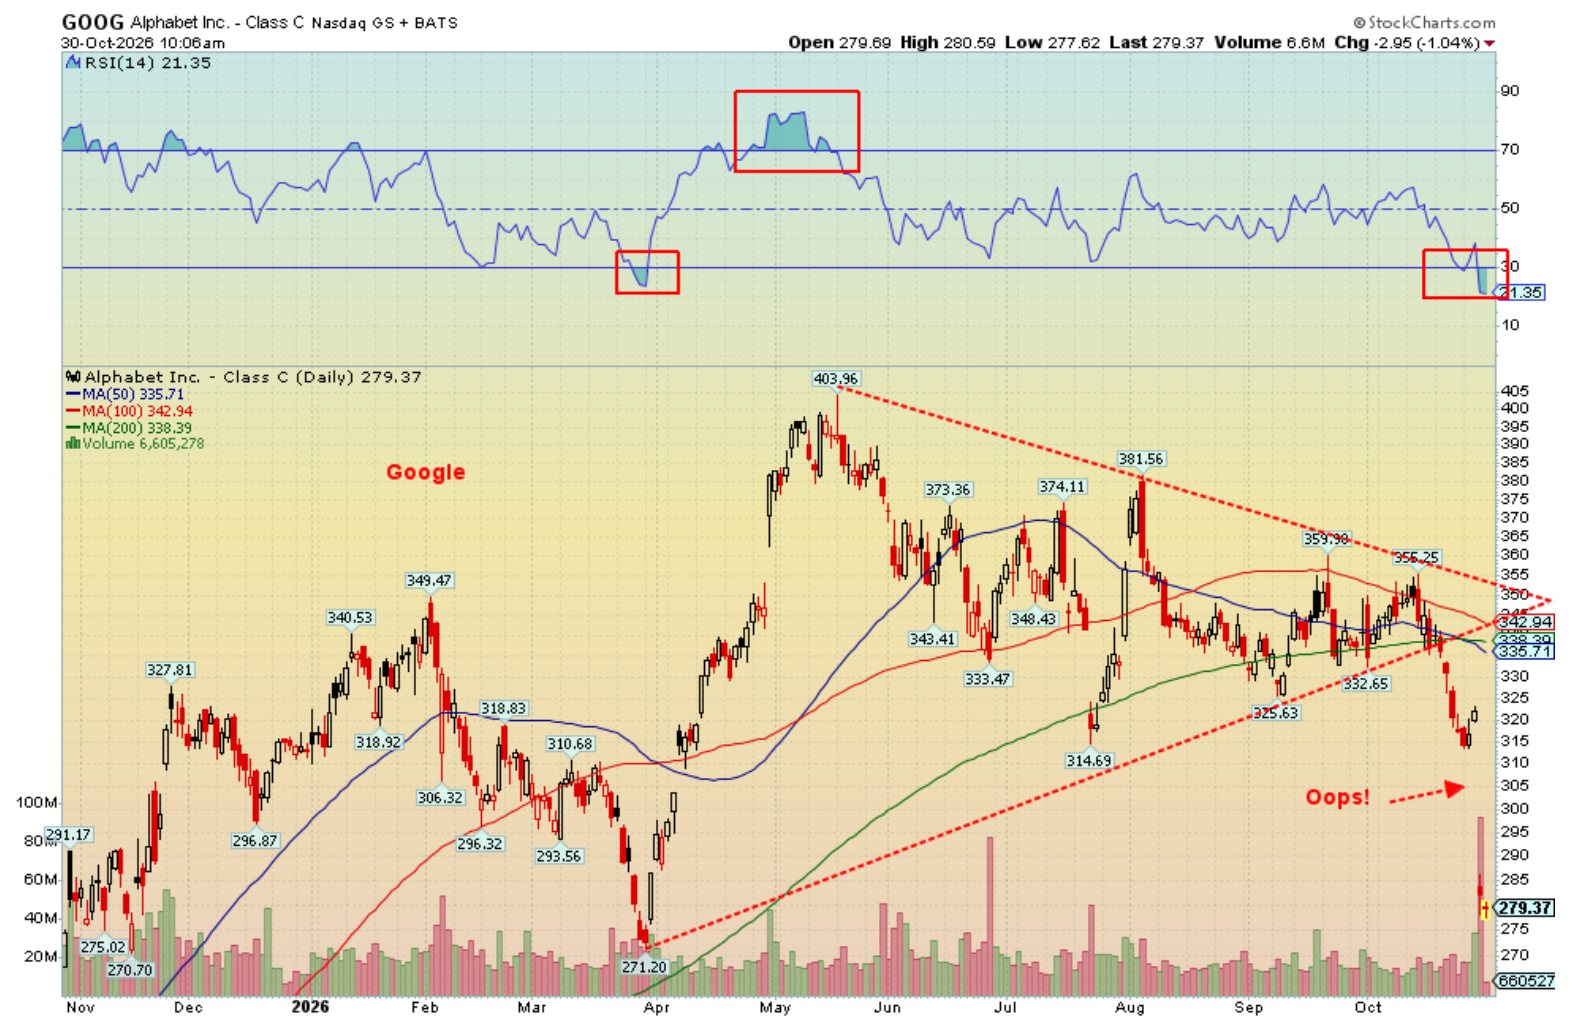
- The stock market has relied heavily on about ten stocks (MAG7 + others) to drive the market to record highs. If they falter, the entire market could falter. They are showing signs of faltering – witness the recent drop for Google and Intel (see “Chart of the week”).
- The current S&P 500 earnings yield is 3.78%, below the rate of the U.S. 10-year Treasury note at 4.99%. Bonds have become more attractive over stocks.
- Rising geopolitical uncertainty, given that the wars in the Middle East and Russia/Ukraine are threatening to widen, puts further upward pressure on energy prices, which feeds into rising inflation.
- Geopolitical instability is rising, given the deteriorating situation in France through street riots. The riots are spreading to other countries, giving rise to further instability, particularly in the eurozone. However, rising social unrest is not just limited to the eurozone, as this unrest has also been seen in a number of Asian countries. There has also been a rise of far-right parties as another form of instability. Political uncertainty is not friendly to stock markets.
- Political instability is rising, given what may be a contentious election in the U.S., including denial of election results. There is also an uncertain result in Israel’s election, giving rise to potential instability there. We are also seeing the rise of far-right politics in both Israel and the U.S., another source of instability. Ongoing deportations carried out by the Department of Homeland Security (DHS) are giving rise to not only a potentially shrinking labour force but uncertainty for many companies as they lose their employees. As well, we are witnessing more protests and social unrest against the DHS’s military force known as ICE (Immigration and Customs Enforcement) and the detention of thousands in what many describe as internment camps or concentration camps.
- Rising debt, rising military payments, and rising interest on the debt is another source of growing instability.
- Aging societies in Japan and the eurozone (less so in Canada and the U.S.) are another source of instability, given that it sparks higher payments for Social Security and Medicare/Healthcare while the tax-paying base shrinks. That could spark further withdrawals from the stock market to help pay for the rising costs.
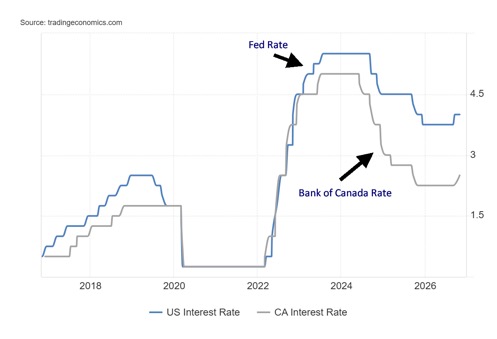
Against this backdrop, it was no surprise the Fed left rates unchanged at its October 28 FOMC meeting. It didn’t lessen thoughts that rate hikes may still be on the table at the December meeting. Canada did hike the key bank rate by 25 bp, as was widely expected.
Fed Rate, Bank of Canada Rate 2016–2026
Source: www.tradingeconomics.com, www.federalreserve.com, www.bankofcanada.ca
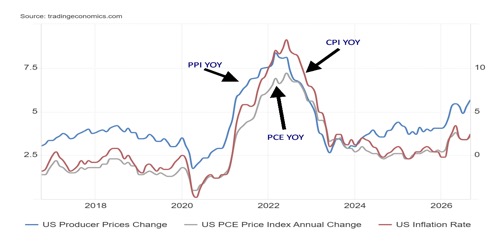
Inflation remains a problem. The latest Personal Consumption Expenditures (PCE) prices showed they jumped 0.5% in September as expected, but above the 0.3% gain in August. Year-over-year (yoy) prices for September rose 3.6%, up from August’s 3.4% but again in line with expectations. Economic strength is still present. However, it is benefitting primarily a small portion of the economy – Wall Street over Main Street. Q3 advance GDP rose 3.4% above the expected 3.1% and Q2’s 2.2%. Private domestic investment, particularly in AI, was a primary driver, along with purchases of equipment for AI. Personal consumption remained robust while spending on health care rose again. All this puts upward pressures on prices. But, as we have noted, the GDP gain is uneven with a smaller portion of the population benefitting over the majority (the K economy). Going forward the GDP numbers are subject to revisions.
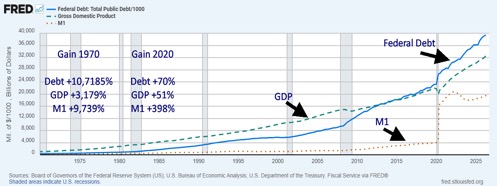
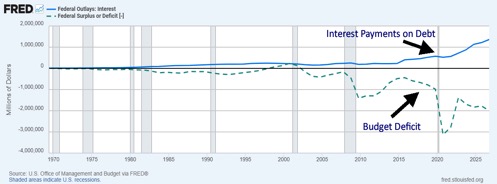
Could a debt crisis hit the U.S.? U.S. federal debt has grown at an astronomical pace since 2020, up some 70%. Since 1970 that growth is even more dramatic, up 10,718%. Meanwhile, GDP growth has not kept up, growing only by 51% since 2020 and since 1970 up 3,179%. Debt growing three times faster than the economy. As a result, not only has money supply soared but interest payments on the debt have soared.
Money supply (M1) is up 9,739% since 1970 and up 398% since 2020, primarily because of the needs of the pandemic. The rapid money supply growth also contributes to inflation. Interest payments on the debt have leaped 594% since a low in 2015 and are still up 260% since 2020. Interest payments are now the third largest expenditure behind Social Security and Medicare/Medicaid and ahead of defence. Interest payments as a percentage of GDP are now at 4%, while the budget deficit as a percentage of GDP is over 6%. These are unheard-of and unsustainable levels. Foreigners are buying an increasingly smaller share of the bond auctions. Japan and China are two countries shedding U.S. debt, while the U.K. and Canada have increased purchases. The result of all the debt is increasing pressure on the market to absorb it all without also pushing out the needs of others, particularly in the AI sector. No wonder there has been upward pressure on interest rates.
PCE, PPI, CPI Inflation Rates 2016–2026
Source: www.tradingeconomics.com, www.bls.gov, www.bea.gov
Debt, GDP, M1 1970–2026
Source: www.stlouisfed.org, www.federalreserve.gov, www.bea.gov, www.home.treasury.gov
Interest payments on the U.S. Federal Debt, U.S. Budget Deficit 1970–2026
Source: www.stlouisfed.org, www.whitehouse.gov
Rather than a continuation of the bull market that has been in place since 2009, with some notable interruptions in 2011, 2015/2016, 2018, 2020, and 2022, we could be facing a down year into 2027. Years ending in seven have not had a good record, even as the last five years ending in seven have all been positive. Years ending in seven have collectively averaged negative 0.5% return since 1880. Notable years ending in seven with declines greater than 20% were 1907, 1917, 1937, and 1977. Years ending in seven have only been surpassed by years ending in zero. Are we overdue for a bad year in 2027? The signs are not good.
Chart of the week
Source: www.stockcharts.com
Poof! Just like that. Bye, bye a half-trillion dollars – $500 billion. Yes, that’s the loss that investors in Google/Alphabet (GOOG) woke up to on October 29, 2026. Maybe they forgot to look at their calendar, and they would have noted that on October 29, 1929, a day known as Black Tuesday, saw the Dow Jones Industrials (DJI) plunge almost 12%. Combined with October 28, 1929, it was a two-day plunge of 25%, known as “the crash of ’29.” Google didn’t get the message and decided to do it all in one day.
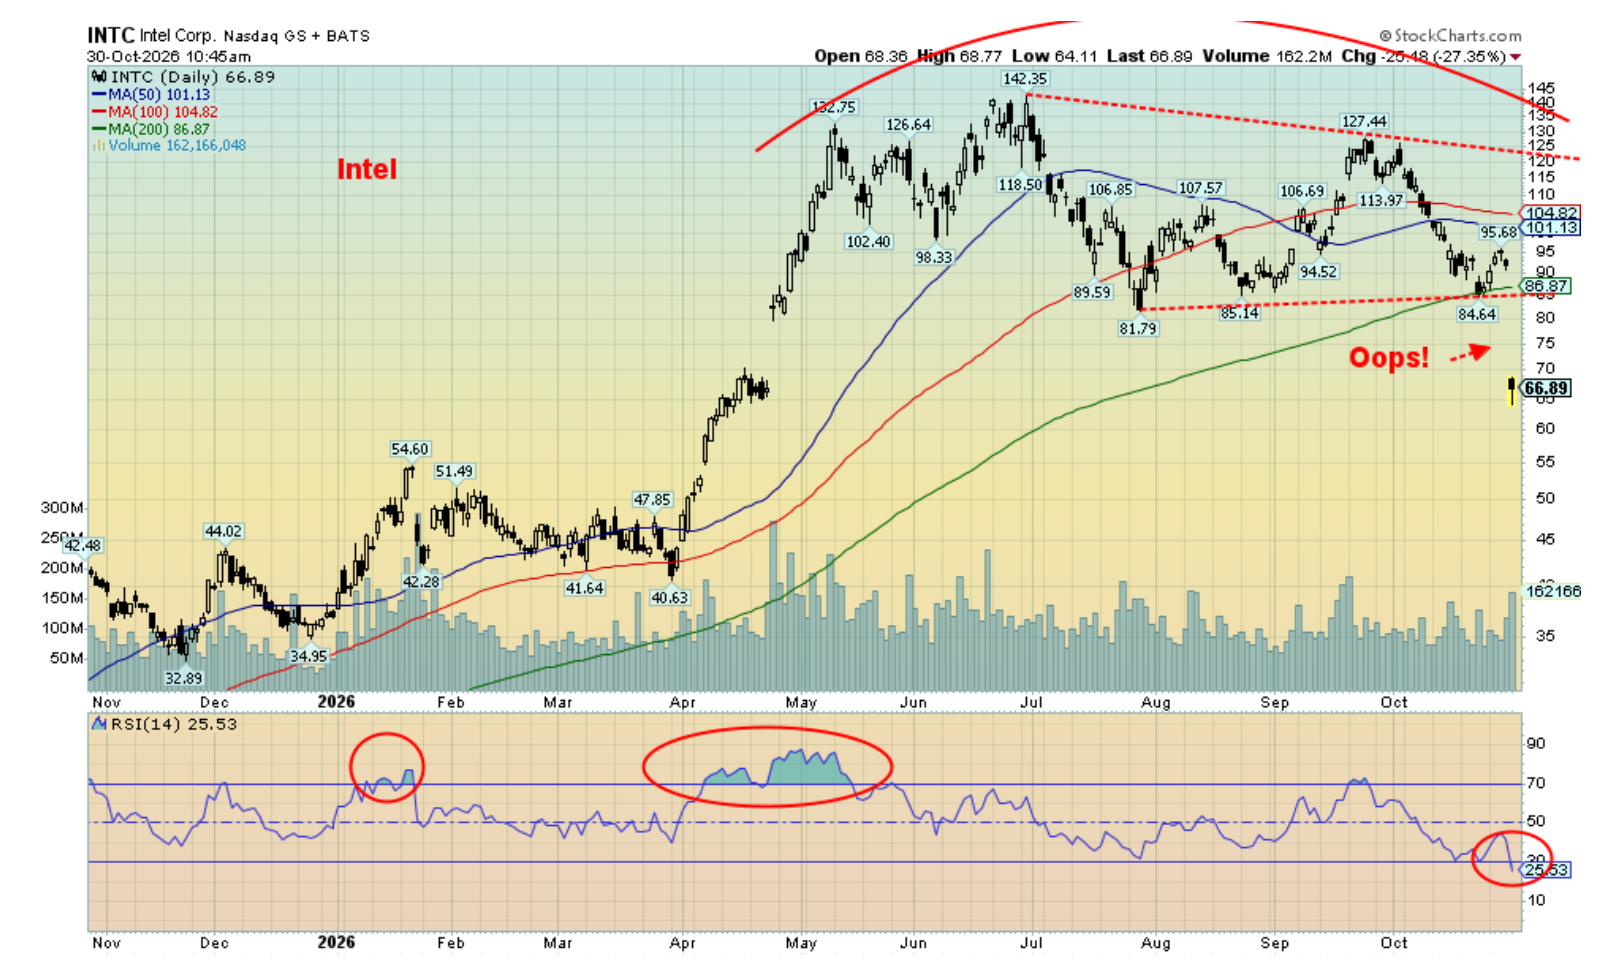
Then, the very next day on October 30, 2026, Intel (INTC) decided to outdo Google and plunged almost 30%. Yes, that’s in one day. As to market cap lost? Piffle. The drop only wiped off $128 to $140 billion of Intel’s stock, just over a quarter of Google’s market loss.
Maybe we can call it the crash of the Titans. Google is a key member of the MAG7 and the Dow Jones 30. Intel? Just a high-tech company that happens to make chips. So why did they crash? They reported lousy earnings. Expectations were built way too high. The stocks reverted to the mean.
Source: www.stockcharts.com
When the high-profile stocks are getting trashed, the lesser-known stocks don’t stand a chance.
Google had an incredible final run, gaining some 49% from March to May 2026. Then the well-needed correction set in. Only it turned out to be a bull trap, and the result was October 29. Google is now down 31% from that May top. The downside target should be at least to $248/$250. We are already close. That doesn’t mean it’s the final low; it’s just a technical target. We are deeply oversold with a current RSI of 21. A near-term low could be at hand.
As to Intel, its gain and loss are even more spectacular. From March to May 2026 Intel gained 227%. When Intel made its final high in June it was up 250%. Now Intel is doing its own imitation of a crash, down 53% from that June 2026 high. Targets could be down to $25/$26. We have a lot of room to fall. However, like Google, we are deeply oversold.
The AI/high-tech party appears to be over.
Markets and Trends
|
|
|
|
% Gains (Losses) Trends |
|
||||
|
|
Close Dec 31/25 |
Close Oct 30/26 |
Week |
YTD |
Daily (Short Term) |
Weekly (Intermediate) |
Monthly (Long Term) |
|
|
|
|
|
|
|
|
|
|
|
|
|
|
|
|
|
|
|
||
|
S&P 500 |
6,845.50 |
7,580.07 |
(0.6)% |
10.7% |
down |
up |
up |
|
|
Dow Jones Industrials |
48,063.29 |
51,770.31 |
(0.9)% |
7.7% |
up (weak) |
up |
up |
|
|
Dow Jones Transport |
17,357.19 |
20,329.33 |
1.4% |
17.1% |
neutral |
neutral |
up |
|
|
NASDAQ |
23,241.99 |
25,437.00 |
(2.0)% |
9.4% |
down |
up (weak) |
up |
|
|
S&P/TSX Composite |
31,712.76 |
35,620.03 |
(0.5)% |
12.3% |
neutral |
up |
up |
|
|
S&P/TSX Venture (CDNX) |
987.74 |
803.78 |
(2.1)% |
(18.6)% |
down |
down |
up`(weak) |
|
|
S&P 600 (small) |
1,467.76 |
1,706.25 |
1.5% |
16.3% |
up |
up (weak) |
up |
|
|
ACWX MSCI World x US |
67.18 |
73.41 |
(0.1)% |
9.3% |
down |
neutral |
up |
|
|
Bitcoin |
87,576.98 |
76,895.40 |
(5.4)% |
(12.2)% |
down |
up |
up (weak) |
|
|
|
|
|
|
|
|
|
|
|
|
Gold Mining Stock Indices |
|
|
|
|
|
|
|
|
|
Gold Bugs Index (HUI) |
701.49 |
649.74 |
(3.9)% |
(7.4)% |
down |
down |
up |
|
|
TSX Gold Index (TGD) |
817.76 |
768.69 |
(4.2)% |
(6.0)% |
down |
down |
up |
|
|
|
|
|
|
|
|
|
|
|
|
Bonds% |
|
|
|
|
|
|
|
|
|
U.S. 10-Year Treasury Bond yield |
4.17% |
4.94% |
(1.2)% |
18.5% |
|
|
|
|
|
3.3Cdn. 10-Year Bond CGB yield |
3.44% |
3.80% |
(1.3)% |
10.5% |
|
|
|
|
|
Recession Watch Spreads |
|
|
|
|
|
|
|
|
|
U.S. 2-year 10-year Treasury spread |
0.69% |
0.34% |
13.3% |
(50.7)% |
|
|
|
|
|
Cdn 2-year 10-year CGB spread |
0.85% |
0.49% |
flat |
(42.4)% |
|
|
|
|
|
|
|
|
|
|
|
|
|
|
|
Currencies |
|
|
|
|
|
|
|
|
|
US$ Index |
98.26 |
101.90 |
0.1% |
3.7% |
up (weak) |
up |
neutral |
|
|
Canadian $ |
72.87 |
71.62 |
0.3% |
(1.7)% |
up |
down (weak) |
down |
|
|
Euro |
117.48 |
111.65 |
(0.3)% |
(5.0)% |
down |
down |
neutral |
|
|
Swiss Franc |
126.21 |
121.33 |
0.1% |
(3.9)% |
neutral |
down |
neutral |
|
|
British Pound |
134.78 |
133.94 |
0.2% |
(0.6)% |
neutral |
down |
up |
|
|
Japanese Yen |
63.83 |
63.47 |
(0.5)% |
(0.6)% |
neutral |
up (weak) |
down |
|
|
|
|
|
|
|
|
|
|
|
|
Precious Metals |
|
|
|
|
|
|
|
|
|
Gold |
4,311.97 |
3,880.24 |
(2.9)% |
(10.0)% |
down |
down |
up |
|
|
Silver |
71.16 |
49.19 |
(8.7)% |
(30.9)% |
down |
down |
up (weak) |
|
|
Platinum |
2,046.90 |
1,437.50 (new lows) |
(7.6)% |
(29.8)% |
down |
down |
up (weak) |
|
|
|
|
|
|
|
|
|
|
|
|
Base Metals |
|
|
|
|
|
|
|
|
|
Palladium |
1,619.50 |
979.00 (new lows) |
(6.4)% |
(39.6)% |
down |
down |
down (weak) |
|
|
Copper |
5.64 |
6.46 |
flat |
14.5% |
down |
up |
up |
|
|
|
|
|
|
|
|
|
|
|
|
Energy |
|
|
|
|
|
|
|
|
|
WTI Oil |
57.44 |
102.96 |
(0.5)% |
79.3% |
up |
up |
up |
|
|
Nat Gas |
3.71 |
2.88 |
9.5% |
(22.4)% |
down |
down |
neutral |
|
Source: www.stockcharts.com
* New All-Time Highs
Note: for an explanation of the trends, refer to the glossary at the end of this article.
New highs/lows refer to new 52-week highs/lows and, in some cases, all-time highs.
Stocks
Source: www.stockcharts.com
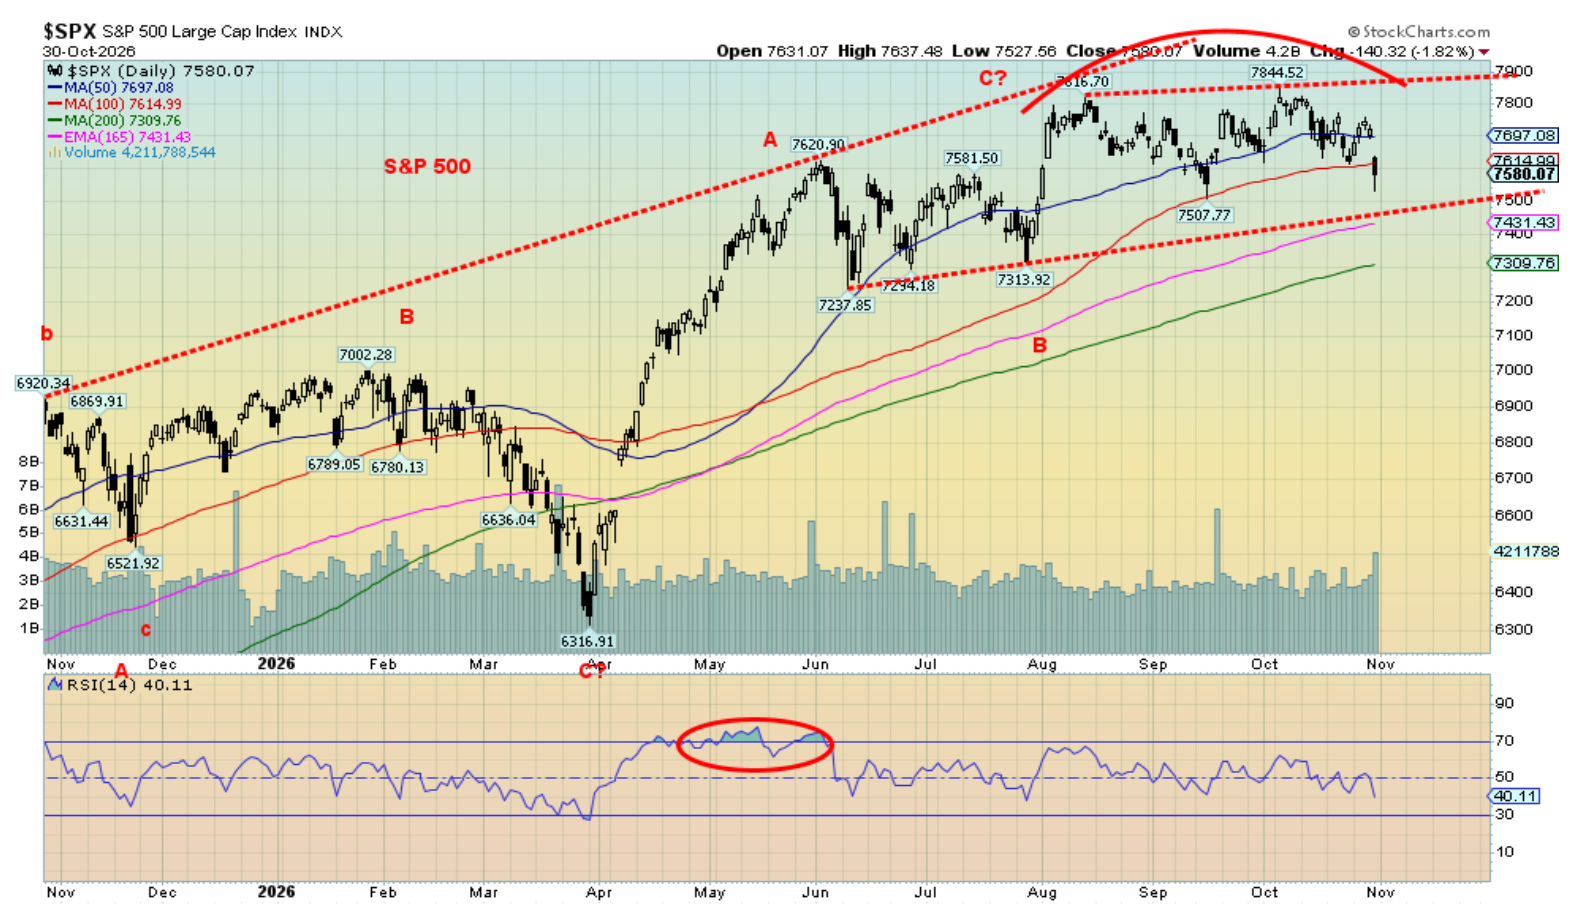
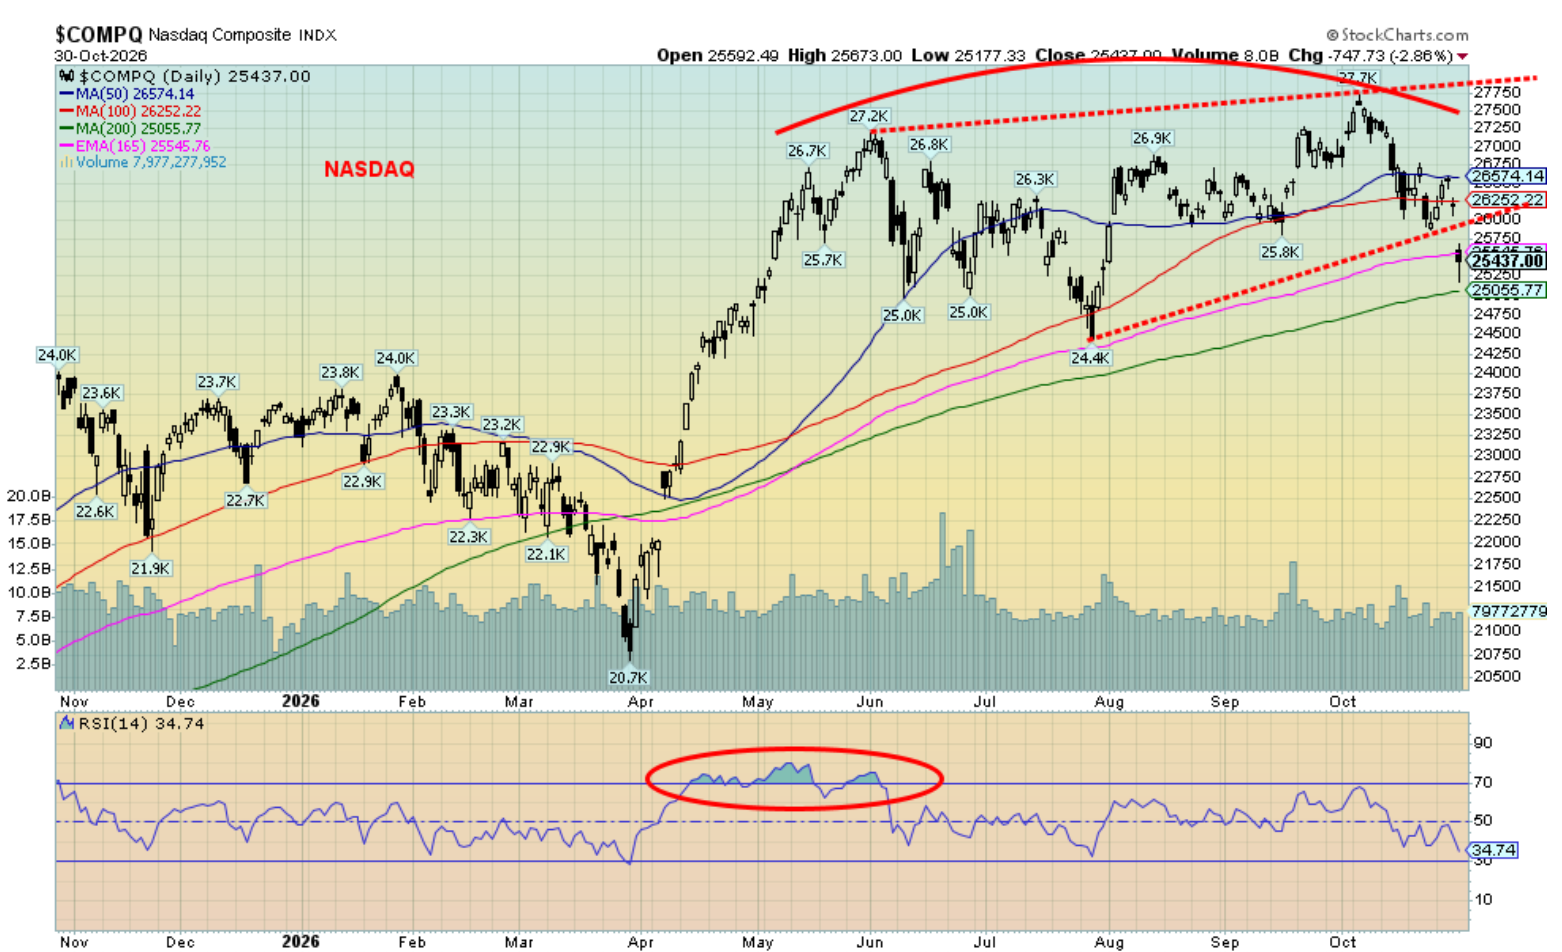
Is the party really over this time? This week both the S&P 500 and the NASDAQ gapped lower on Friday as the AI/high-tech sell-off intensified. We have noted it feels like 2000 with the DJI making its high in January and then two months later in March the S&P 500 and NASDAQ make their highs. Today it’s the same, only the DJI made its high in August while the S&P 500 and the NASDAQ made their highs in October. What will help a sell-off is a Democrat victory in the House and Senate this coming week. Wall Street hates Democrats, viewing them in the stereotypical tax and spend, even if it is Republicans that consistently have the largest deficits and add more to the debt.
If there is some encouragement, the market seems to be broadening the S&P 500 Equal Weight Index and the Mid-Cap and Small-Cap indices were up this past week. But the S&P 500 fell 0.6% this past week while the NASDAQ dropped 2%. The Dow Jones Industrials (DJI) fell 0.9% but the Dow Jones Transportations (DJT) continues to surprise, up 1.4%. The S&P 400 (Mid) rose 4.1% while the S&P 600 (Small) was up 1.5%. The NY FANG Index was down 3.4%. The Semi-Conductor Index (SOX) fell 0.8% on the week but on Friday it dropped over 7%.
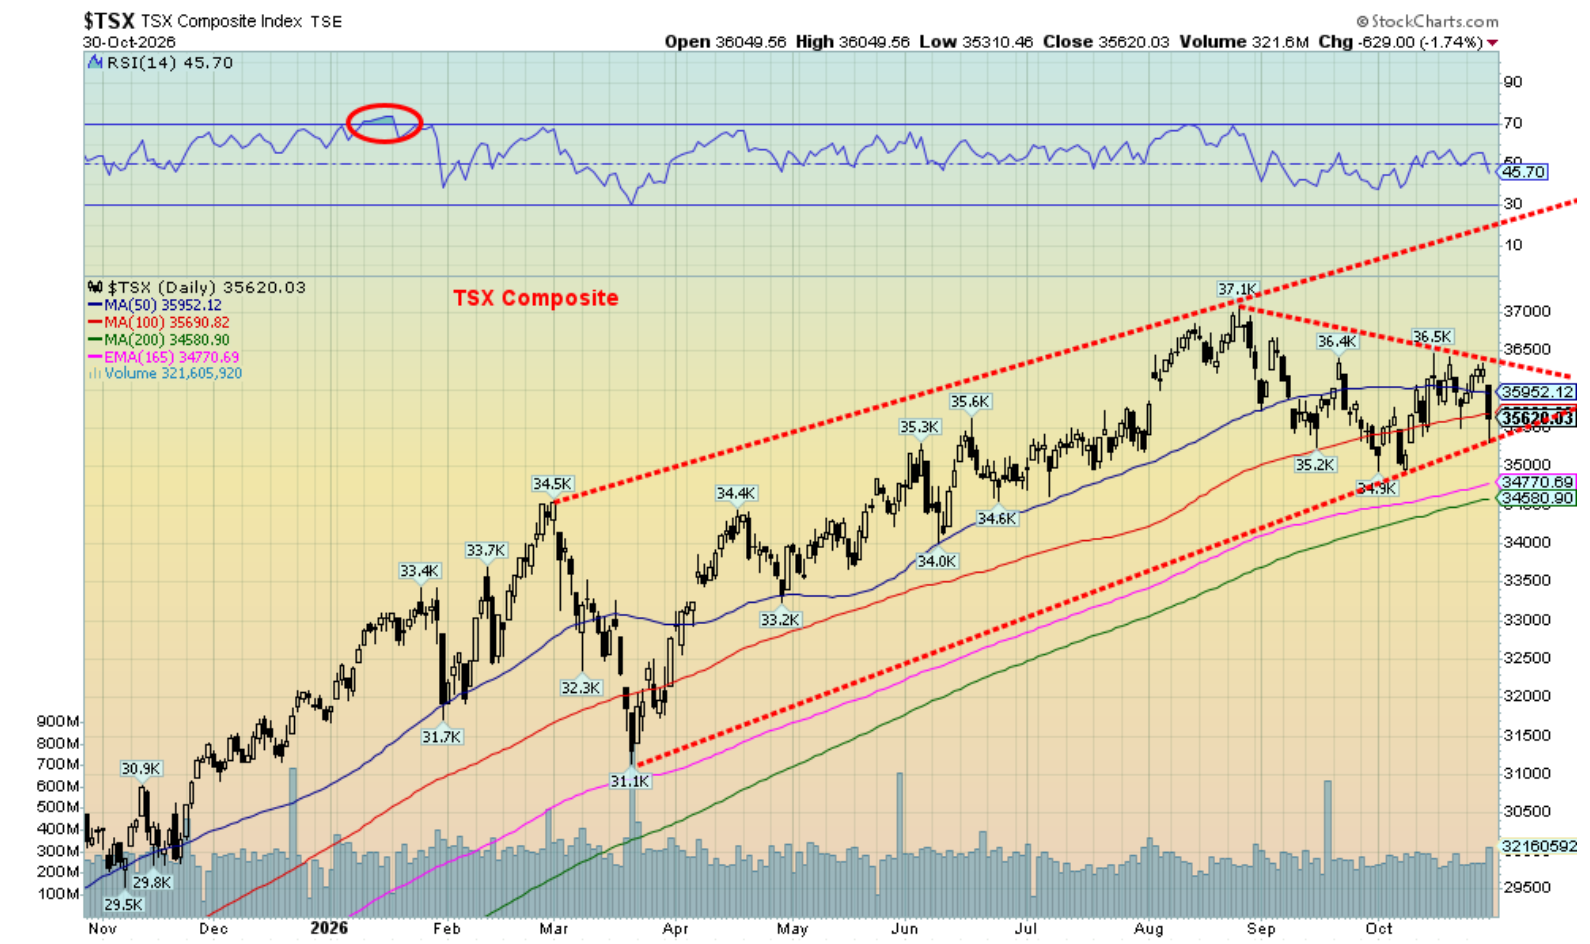
In Canada, the TSX Composite was off 0.5% while the TSX Venture Index (CDNX) continued its woes, down 2.1%. Some junior mining stocks have fallen 50% from their highs. When selling gets underway, the bids often just walk away. It’s not as if anything is fundamentally wrong with the companies.
In the EU, it was positive all around. The London FTSE rose 0.6%, the EuroNext was up 1.6%, the Paris CAC 40 gained 2.4%, and the German DAX rose 2.5%. Asia was more mixed as China’s Shanghai Index (SSEC) fell 2.5% to new 52-week lows but Japan’s Nikkei Index (TKN) rose 1.0%. Hong Kong’s Hang Seng (HSI) rose 1.3% while India’s Nifty Fifty was up 2%. If the U.S. markets continue to fall, then eventually the EU and Asian markets will follow.
Source: www.stockcharts.com
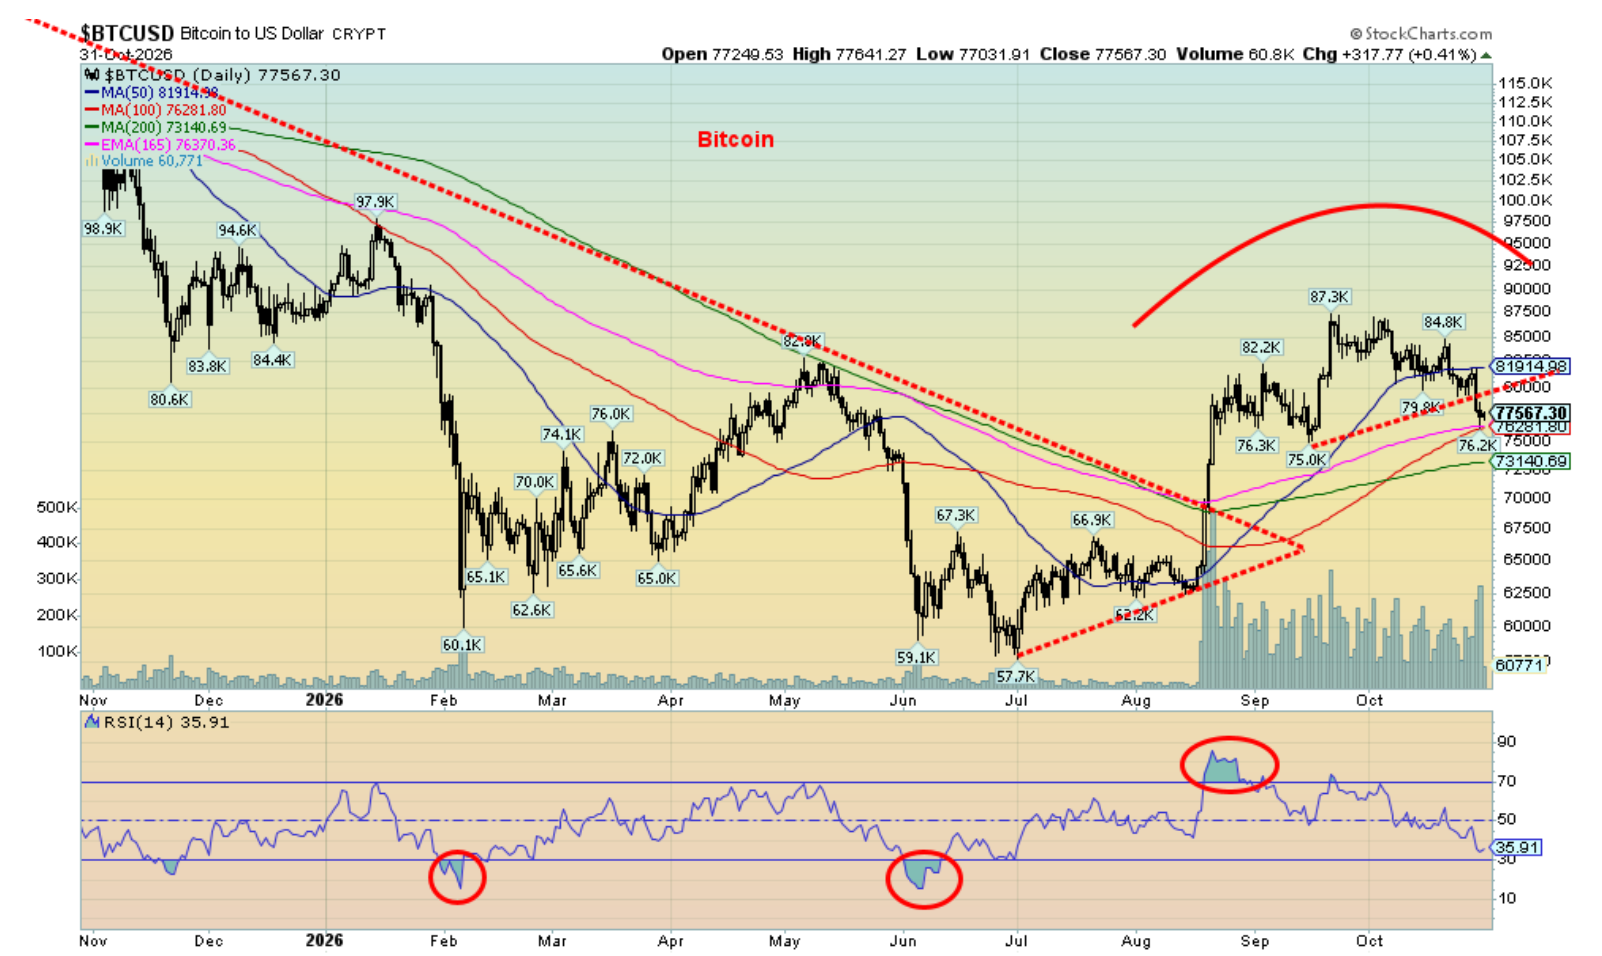
If there was a story on the week besides the U.S. AI/high-tech sell-off, it was the monstrous hack at Binance where it is alleged hackers from North Korea broke in and stole $6.3 billion. That’s mind-boggling. And crypto is supposed to be safe? As a result, Bitcoin fell 5.4% this past week. The down move may just be getting underway. The breakdown from that topping pattern suggests a fall to at least $67,700. Under $73,000 more losses could be seen and under $64,700 new lows are probable.
Friday’s gap down is of concern. It could be the start of a steeper decline. Again, we are reminded of the 2018 bear market that topped in October and then fell over 20% into December. Or the October high of 2007, which was the start of the financial crisis collapse that saw stock markets fall over 50% into March 2009.
The S&P 500 is approaching support near 7,500. More support is seen at 7,400. But under 7,200 a bigger sell-off could get underway. The NASDAQ has already broken support and the 200-day MA is looming at 25,050. A solid break under that level and a bigger sell-off gets underway.
Source: www.stockcharts.com
The TSX saw only five of its 14 sub-indices up this past week. The gains were led by Financials (TFS), up 1.2%, and Utilities (TUT), which were up 1.3%. The losers were led by Golds (TGD), down 4.2%. Metals (TGM) fell 2.7% and Materials (TMT) were off 3.6%. The TSX Venture Exchange (CDNX) looks miserable, down 32% from its highs. No wonder some individual junior mining stocks have fallen 50%. The TSX ended the week at support but a break under 35,300 could set off a decline to 34,000 and 200-day MA support.
Given that the RSIs of the stock indices are not oversold, there is considerable room to move lower. The AI/high-tech party appears to be over. Meta, Google, and Tesla are in bear markets with Google down 31.1% from its high. Amazon and Nvidia are in correction zones. Only Apple and Microsoft are still hanging in with Apple near all-time highs. If it’s any consolation, things could be worse. Trump Media (DJT) is down a whopping 97% from its all-time highs. But then it leaped initially by almost 1,700% following its introduction in 2021. It didn’t last long. Today we are down 43% from the 2021 introduction. Not even Trump’s approval ratings have fallen as low as his stock.
Source: www.stockcharts.com
Bonds
Source: www.tradingeconomics.com, www.home.treasury.gov, www.bankofcanada.ca
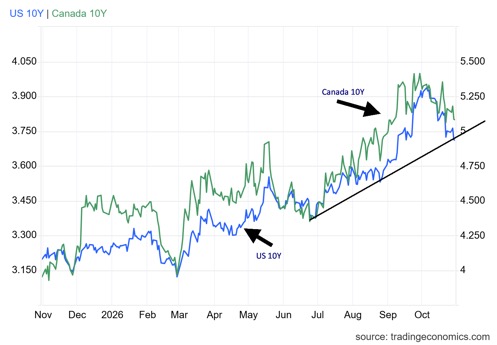
Equities down, bond prices up (yields that move inversely to price were down). It’s a see-saw as U.S. treasury yields fell this past week. The 10-year U.S. Treasury note fell to 4.94% from 5%. But the 30-year Treasury bond barely moved, down to 5.31% from 5.32%. In Canada, the Government of Canada 10-year bond (CGB) fell to 3.80% from 3.85%. We are now on the cusp of a further decline in yields, or we’ll start back up again.
The stumbling equity market could see the Fed hesitating at its December 8–9 meeting. Expectation is still for a rate hike, but a falling stock market may make them hesitate. A fractured, contested midterm elections result could also cause the Fed to hesitate about hiking rates. But a resumption of the U.S./Iran war and an escalation of the Saudi/Houthis and Russia/Ukraine wars could spark oil prices higher, with more inflation to follow.
Nonetheless, if the U.S. 10-year falls through 4.75% and the Canada 10-year drops through 3.75%, lower yields may be in the offing. But then inflation remains sticky and that translates into higher, not lower yields.
Gold and silver
Source: www.stockcharts.com
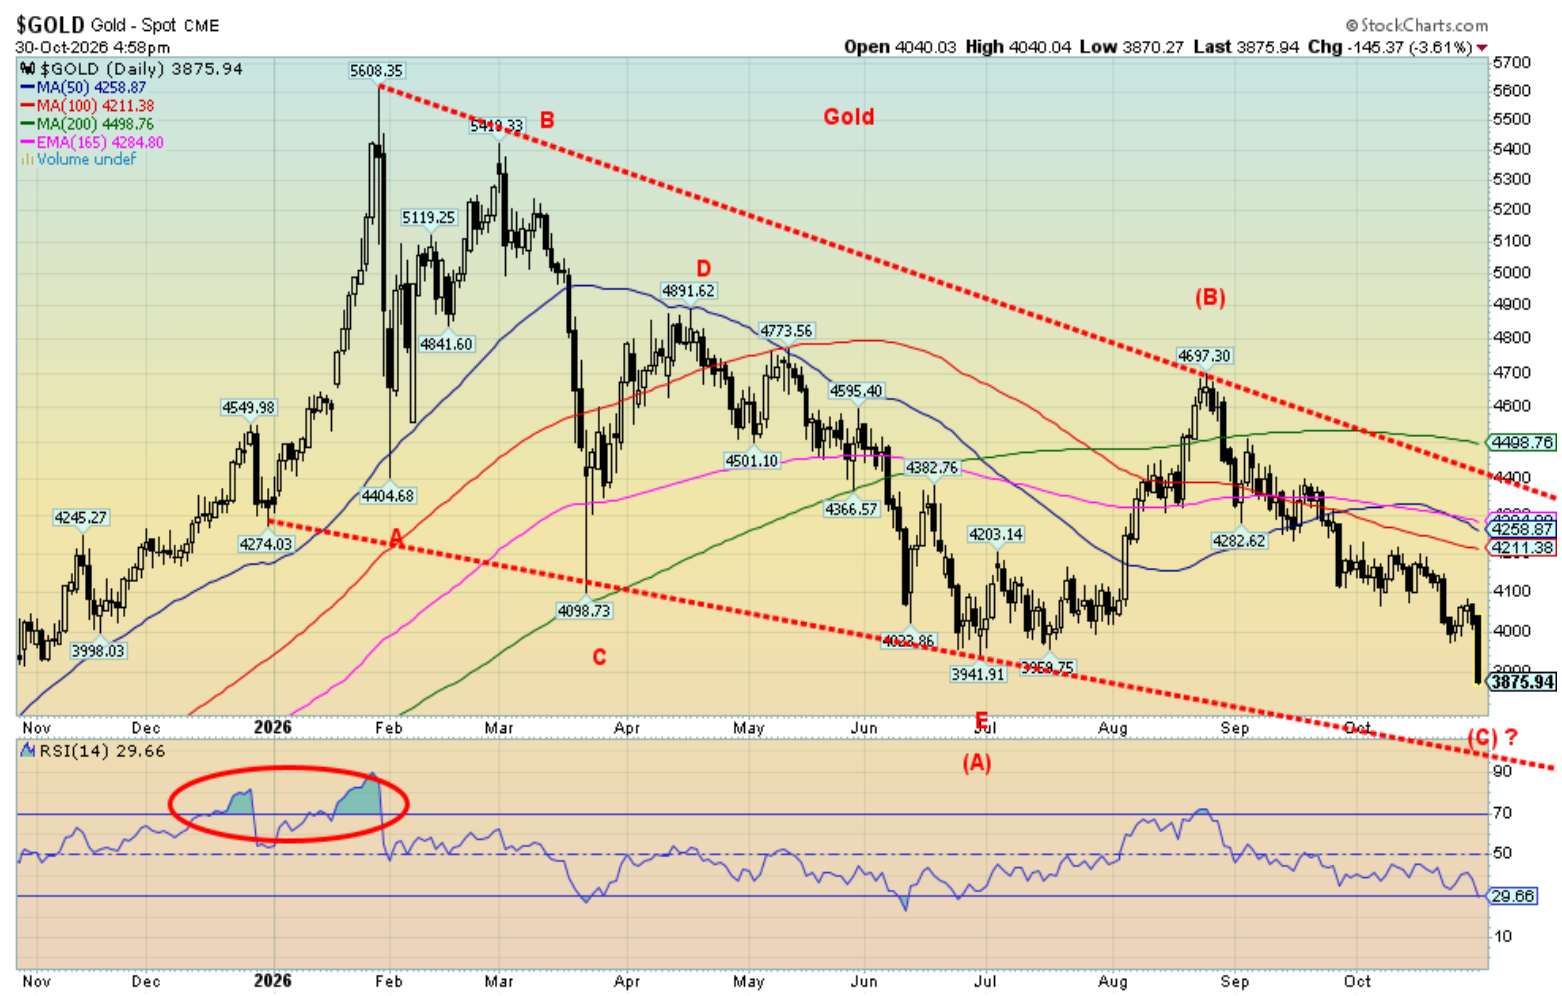
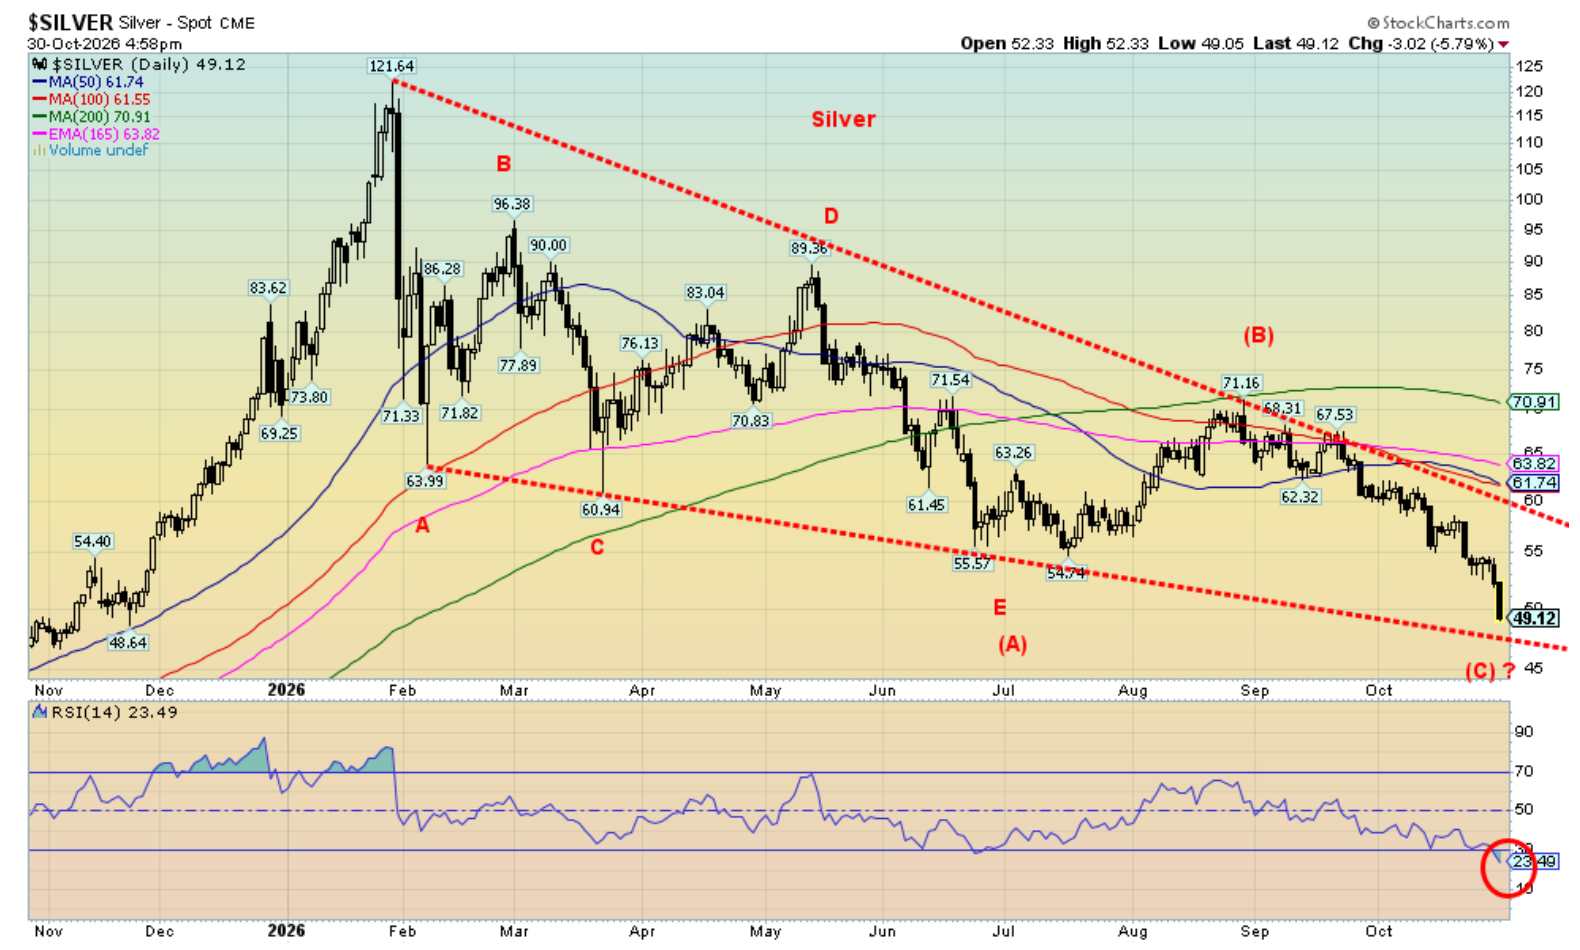
If you see gold traders jumping out of windows, don’t worry. They always do that at bottoms. We’re sure a few might have been doing that this past week as both gold and silver plunged to new lows for the down move since that January 2026 top. Gold is now down about 31% from that top. Silver is worse, down about 60%.
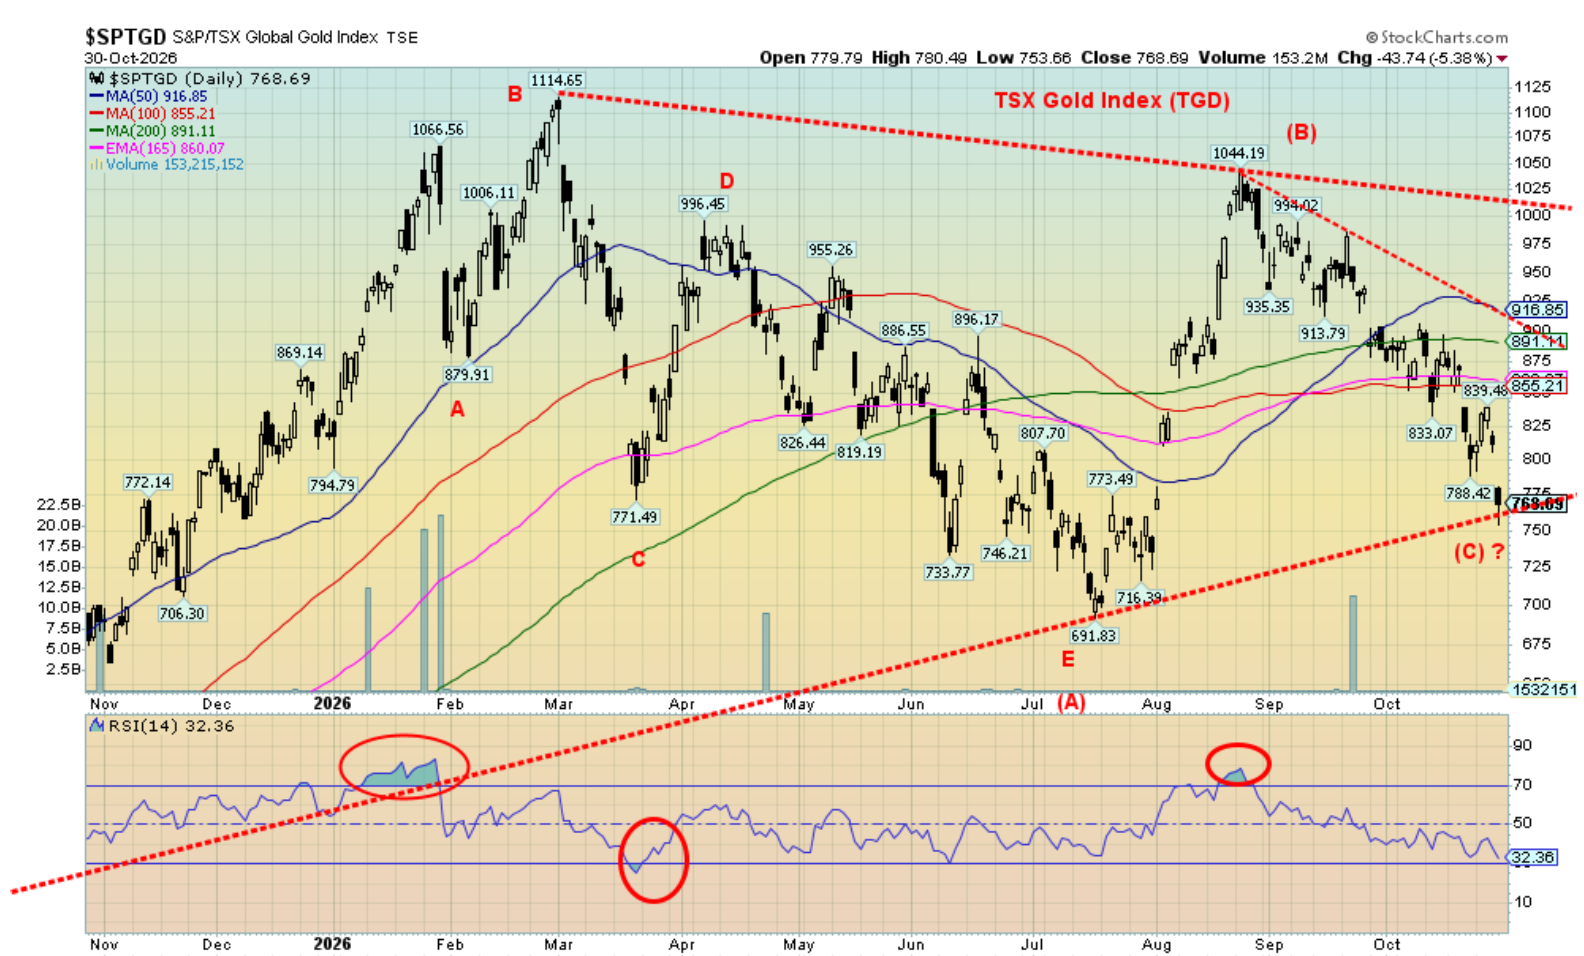
In the financial crisis crash of 2008, gold fell 34% while silver dropped 60%. The gold stocks were massacred as the Gold Bugs Index (HUI) fell 71% and the TSX Gold Index (TGD) dropped 60%. This time? At its worst, so far the HUI fell 41% and the TGD was down 38%. The remarkable thing is that while both gold and silver have made new lows for the move both the HUI and the TGD remain nicely above their recent lows. A divergence?
We’re seeing a lot of fear in the market. One thing we have noted is in 2022, just before the midterm elections, gold and silver made their bottom. The bottom was actually in late September with a secondary low in late October. Nonetheless, it marked the low for the move and gold rose for the next two and half years. Is that a given? No. The wild card is the midterms. If the Democrats win big, that might give the stock markets the signal to continue their sell-off. That in turn could drag the precious metals market down with it.
October was a scary month for gold and silver. Gold fell 6.8% but silver was scarier, down 18.7% and now hitting that crucial $50 support zone. The HUI fell 12.2% while the TGD dropped 13.2%. Scarier still was platinum, down 16.6%, and palladium, down 19.5%.
That was the week too as gold fell 2.9%, silver was down 8.7%, the HUI was off 3.9%, and the TGD was down 4.2%. Platinum fell 7.6% and palladium dropped under $1,000, off 6.4%. Copper was the star. It was flat last week and off only 1.1% on the month while making a record high at one point. Copper remains our leader. The others will follow.
Source: www.stockcharts.com
We can’t help but notice that gold and silver are oversold as measured by the RSI indicator. Readings under 30 are oversold. The HUI and TGD are close but are not yet under 30. Our chart of gold suggests we could fall further to the lower trend line, but silver appears to be making a falling wedge triangle (bullish) and is at/near support. While we closed just under $50, we view the zone as major support. Gold is also at support, but recognize it could fall towards $3,500/$3,600. The gold stocks (HUI, TGD) are also at support levels. We also appear to be completing what could be a larger ABC pattern to the downside.
We are encouraged by the outperformance of the HUI and TGD vs. gold and silver. It is essential that the gold stocks lead if we are to come out of this current malaise. The recent sell-off appears to be more of a response to the sell-off in the equity market then it is to anything fundamentally wrong with gold and silver. The currencies did nothing this past week with most of them up or down marginally.
Fundamentally, with monstrous debts and budget deficits coupled with continued buying by the central banks as they sell U.S. treasuries and buy gold, this is an encouraging sign that this sell-off is just temporary. Given the huge run-up from 2022 to 2026 (gold gained almost 200% while silver leaped almost 300%), it shouldn’t be a surprise we’ve been hit with an overdue correction. Of course, for the gold bugs it’s a disaster. Maybe they should have better locks on their windows.
Source: www.stockcharts.com
Oil and gas
Source: www.stockcharts.com
To bomb or not to bomb; that is the question. The midterms are just around the corner and once they pass President Trump is threatening to resume bombing of Iran. Iran has promised a full response. The Strait of Hormuz remains effectively closed, although a few tankers have tried to go through and if they were lucky, they did get through; otherwise, they were bombed. The Houthis continue to cause havoc against Saudi Arabia, effectively making the Red Sea and the Bab-el-Mandeb Strait precarious at best.
There have also been explosions at Iranian ports as the U.S. tries to enforce its embargo. The bottom line, however, is that the Strait remains effectively closed or at least dangerous for anyone trying to traverse the waterway.
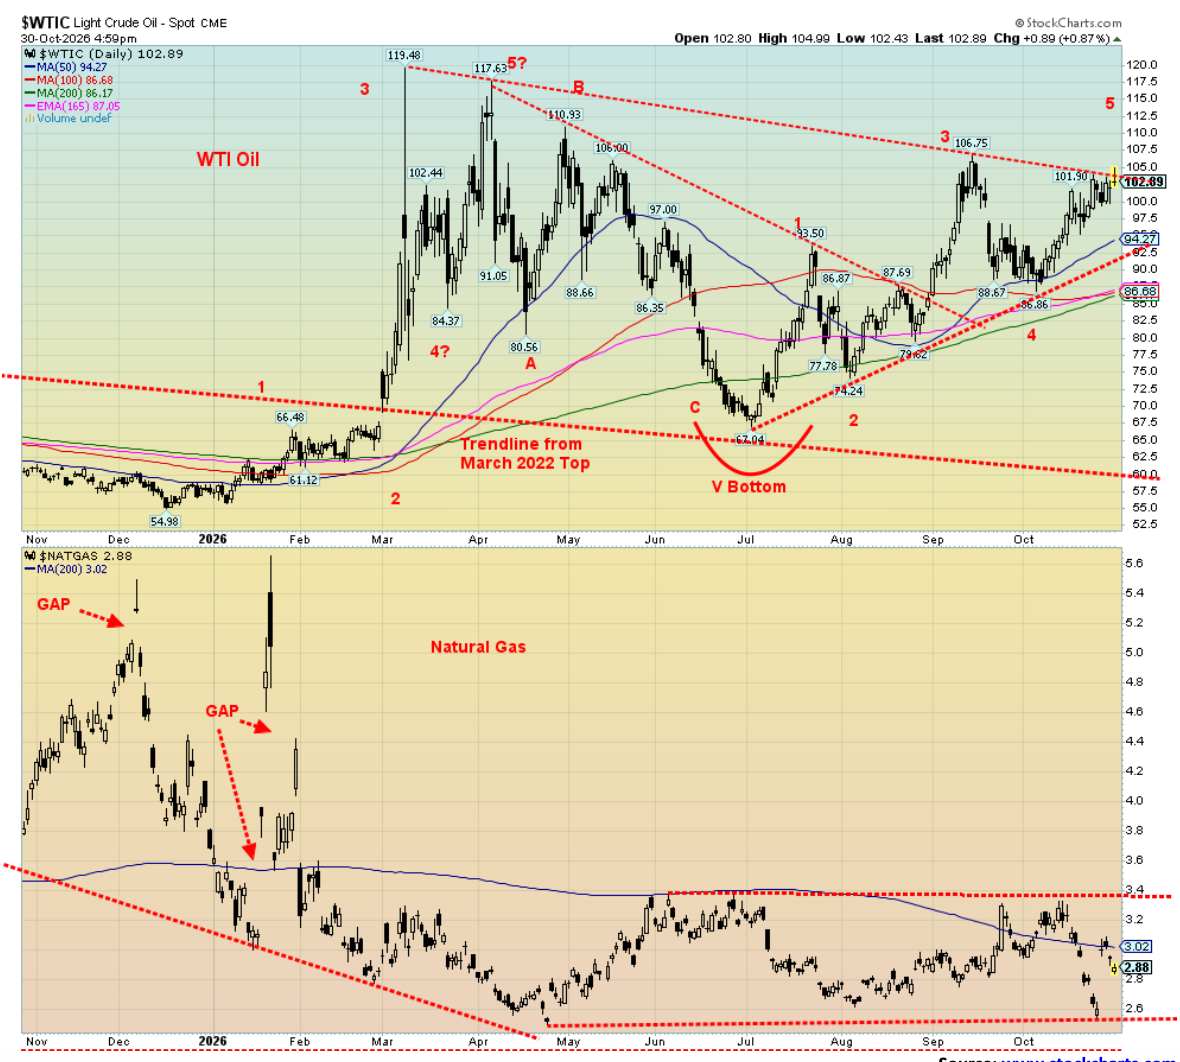
We have picked up news that commodity traders are positioning themselves for an upside breakout. Given WTI oil’s proximity to that $105 breakout, that is not surprising. The other side is a breakdown under $92.50. Given the circumstances, the odds of a breakdown are low but can’t be ruled out, given President Trump’s ability to turn into the TACO man. But once the midterms are out of the way he has less reason to try and suppress oil prices.
This past week oil did wobble or at least showed hesitation in front of the midterms. WTI fell 0.5% while Brent crude was down 3.9%. Nonetheless, both WTI and Brent continued to close over $100. A breakout of the $105 level could project to at least $120 and even up to $135/$150. Would then $5/gallon gas beckon and in Canada $2/litre? On the month, WTI gained 13.8% while Brent jumped 14.6%. Natural gas (NG) wasn’t spared this past week as NG at the Henry Hub jumped 9.5% while NG at the EU Dutch Hub was up 10.5%. NG at the EU Dutch Hub was up over 30% in October as concern kept growing about the conflict between the U.S./Iran. Forecasts of colder weather in both the EU and North America didn’t help. U.S. oil reserves continue to hover around five-year lows and need replenishing.
The energy stocks continue to enjoy success as the ARCA Oil & Gas Index (XOI) made new all-time highs once again, but some profit-taking pushed the index down 0.6% on the week. The TSX Energy Index (TEN) didn’t make an all-time high but closed up 0.4%. The energy stocks continue to support the thesis that we are more likely to break out above $105 than we are to break down. Oil and oil stocks – stay long.
Copyright David Chapman 2026
GLOSSARY
Trends
Daily – Short-term trend (For swing traders)
Weekly – Intermediate-term trend (For long-term trend followers)
Monthly – Long-term secular trend (For long-term trend followers)
Up – The trend is up.
Down – The trend is down
Neutral – Indicators are mostly neutral. A trend change might be in the offing.
Weak – The trend is still up or down but it is weakening. It is also a sign that the trend might change.
Topping – Indicators are suggesting that while the trend remains up there are considerable signs that suggest that the market is topping.
Bottoming – Indicators are suggesting that while the trend is down there are considerable signs that suggest that the market is bottoming.
Disclaimer
David Chapman is not a registered advisory service and is not an exempt market dealer (EMD) nor a licensed financial advisor. He does not and cannot give individualised market advice. David Chapman has worked in the financial industry for over 40 years including large financial corporations, banks, and investment dealers. The information in this newsletter is intended only for informational and educational purposes. It should not be construed as an offer, a solicitation of an offer or sale of any security. Every effort is made to provide accurate and complete information. However, we cannot guarantee that there will be no errors. We make no claims, promises or guarantees about the accuracy, completeness, or adequacy of the contents of this commentary and expressly disclaim liability for errors and omissions in the contents of this commentary. David Chapman will always use his best efforts to ensure the accuracy and timeliness of all information. The reader assumes all risk when trading in securities and David Chapman advises consulting a licensed professional financial advisor or portfolio manager such as Enriched Investing Incorporated before proceeding with any trade or idea presented in this newsletter. David Chapman may own shares in companies mentioned in this newsletter. Before making an investment, prospective investors should review each security’s offering documents which summarize the objectives, fees, expenses and associated risks. Although Artificial Intelligence (AI) may be deployed from time to time, AI output is monitored and adjusted, if necessary, for accuracy. David Chapman shares his ideas and opinions for informational and educational purposes only and expects the reader to perform due diligence before considering a position in any security. That includes consulting with your own licensed professional financial advisor such as Enriched Investing Incorporated. Performance is not guaranteed, values change frequently, and past performance may not be repeated.
About the author


Website: https://www.enrichedinvesting.com
Disclaimer: David Chapman is not a registered advisory service and is not an exempt market dealer (EMD) nor a licensed financial advisor. We do not and cannot give individualised market advice. David Chapman has worked in the financial industry for over 40 years including large financial corporations, banks, and investment dealers. The information in this newsletter is intended only for informational and educational purposes. It should not be considered a solicitation of an offer or sale of any security. The reader assumes all risk when trading in securities and David Chapman advises consulting a licensed professional financial advisor before proceeding with any trade or idea presented in this newsletter. David Chapman may own shares in companies mentioned in this newsletter. We share our ideas and opinions for informational and educational purposes only and expect the reader to perform due diligence before considering a position in any security. That includes consulting with your own licensed professional financial advisor.