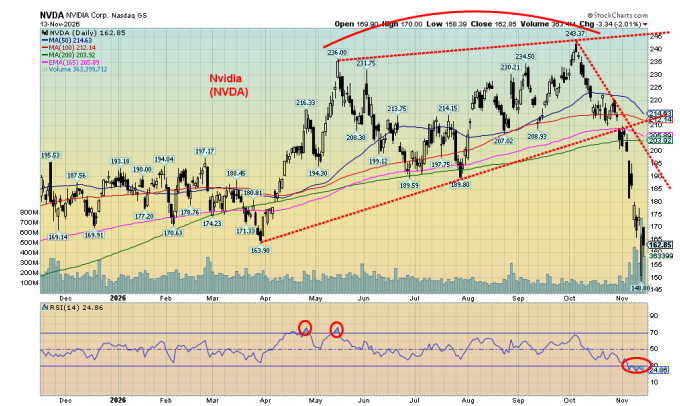
The story of the week is Nvidia (NVDA), the world's second-largest company by market cap. Its co-founder and CEO for 33 years, Jensen Huang, is alleged to have had affairs, including one with what is described as a Chinese intelligence asset. He was forced to step down. He was the only CEO the company has ever known. Nvidia fell 12.8% on the week and is down 32% from its all-time high. Huang is the 13th richest person in the world. It's a story worthy of a movie thriller, and it is still being written. Nvidia is the subject of our chart of the week.
Inflation was the other big story as both the U.S. CPI and PPI continued to come in elevated. In Canada, interest rate pressures are offset by discount banners and private-label offerings in retail stores such as Loblaw Companies Limited, which reported Q2 increased revenue, higher operating income, and greater EBITDA, pays a dividend, and is held in the Enriched Capital Conservative Growth Strategy.* Stock markets shrugged off the inflation news and rose on the week. But bond yields and the US$ Index leaped, and talk of a Fed rate hike at the December 8-9 FOMC heightened. Gold didn't like the news and fell, with the metal itself making (barely) 52-week lows. This wasn't the case for silver or the gold stocks. A positive divergence?
Oil prices slipped again as peace talks between the U.S./Iran and Russia/Ukraine continued. In reality, any peace talks look shaky: the Strait of Hormuz is still mostly closed, the Houthis are still in conflict with Saudi Arabia, and Russia and Ukraine continue to hurl bombs at each other. But oil stocks performed well this week. Are they telling us that oil prices will rise again?
The aftermath of the U.S. midterms continues with the Trump administration suggesting that anyone investigating Trump and his administration could face criminal charges. Trump is engaging in election denialism again.
This week Canada releases its inflation news. The U.S. sees retail sales and manufacturing indices.
The weather continues to chill. But it's sunny. Have a great week.
DC
* Reference to the Enriched Capital Conservative Growth Strategy and its investments, celebrating an
8.75 - year history of 189% growth (annual 12.91%) to October 31, strong alpha and ranking amongst the top at www.emergingmanageralliance.com, is added by Margaret Samuel, President, CEO and Portfolio Manager of Enriched Investing Incorporated, who can be reached at 416-203-3028 or msamuel@enrichedinvesting.com This information should not be construed as an offer, or a solicitation of an offer or sale of any security. Past performance does not guarantee future returns.
"Inflation is always and everywhere a monetary phenomenon, in the sense that it is and can be produced only by a more rapid increase in the quantity of money than in output."
—Milton Friedman, American economist, statistician, Nobel Prize Economics (1976), leader of the Chicago School of Economics, rejected Keynesianism in favour of monetarism; 1912–2006
"In the absence of the gold standard, there is no way to protect savings from confiscation through inflation. There is no safe store of value."
—Alan Greenspan, American economist, 13th chair Federal Reserve Board (1987–2006), consulting firm Greenspan Associates LLC, known for easy money and the ‘Greenspan put,’ which were blamed for the dot.com bubble and housing bubble that led to the 2008 financial crisis; 1926–2026
"Continued inflation inevitably leads to catastrophe."
—Ludwig von Mises, Austrian American political economist, philosopher of the Austrian School of Economics, defender of classic liberalism; 1881–1973
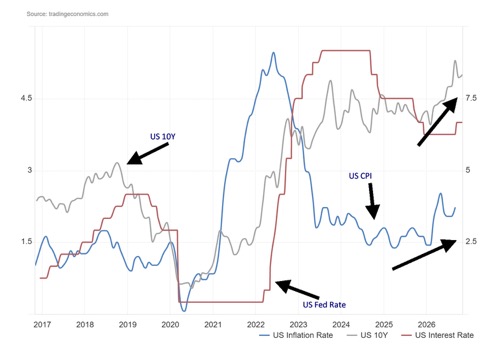
Oh, oh! Inflation again. The U.S. inflation rate came in up 0.4% for October, above the expected 0.3% but below last month’s 0.6% gain. The core inflation rate was up 0.3%, again above the expected 0.2% but in line with the September rate of up 0.3%. What about the year-over-year (y-o-y) inflation? A little problem. October 2025 saw the government shutdown, engineered by the Trump administration. No Consumer Price Index (CPI) was released that month. As a result, they now do not have the y-o-y inflation rate. Expectations were for a rise of 3.9% vs. 3.7% in September. The core inflation rate was expected to rise y-o-y 2.8% vs. the previous month’s 2.6% rise. Inflation is up. Markets didn’t like it, gold didn’t like it, bond yields rose, the US$ Index rose, and expectations that the Fed will hike rates on December 8–9 rose.
The Producer Price Index (PPI) also came out this week. It was up 0.3% vs. a gain of 0.8% in September. It was on forecast. The Bureau of Labour Statistics (BLS) publishes both the CPI and the PPI. Oddly, we have the y-o-y PPI but not the y-o-y CPI. The y-o-y PPI was up 6.5% vs. 6.3% in September and expectations of 6.5%. Market reaction was muted.
Is the post-election situation turning out the way everyone wished? Those expecting a dramatic change are in for disappointment. Rising inflation isn’t going to help them. The parties remain deeply divided. Worse, internally there are deepening divisions within each party making things worse, not better. There are four parties but only two official ones. Dealing with rising inflation is not on their agenda. Nor is dealing with the debt, the rising interest payments on the debt, the wealth disparity, the fractured geopolitical world, the deep divisions over climate change, and the growing discord over AI and technology. Inflation? Pfft! Barely causes a ripple. Unless you’re the Fed.
Ray Dalio, an American billionaire and founder of Bridgewater Associates (www.bridgewater.com), the world’s largest hedge fund, has a thing or two to say about all of this. He has warned that the old-world order is over. It has been replaced by a more dangerous world where the rules-based world order we’ve known since 1945 to roughly 2015 has broken down and, instead, we have the growing potential for the great powers to clash.
We’ve seen this picture before in the lead-up to World War I and World War II. Today? We’re seeing tariffs between the U.S. and just about everyone else (China/U.S. and Canada/U.S. in particular, but others as well), trade restrictions, sanctions on sanctions (Cuba, Russia, North Korea, Iran, Russian-controlled parts of Ukraine), asset freezes (Russia, Iran, China, Iraq, Cuba, Venezuela, and others), oil embargoes or blockages (Iran, Cuba, and others), growing societal divisions, and the rise of extremist political movements at both ends of the spectrum – left and right. All are present today. History tells us this doesn’t end well. Inflation is just a consequence. The central bank has its hands full to control inflation in a deeply divided world.
U.S. Inflation, U.S. 10-year Treasury note, Fed Rate 2016–2026
Source: www.tradingeconomics.com, www.bls.gov, www.federalreserve.gov
Adding to these woes, the next year doesn’t line up very well. Government spending and taxation issues will be in play on December 11, once President Trump’s temporary funding runs out. In March 2027, the federal debt is expected to hit its limit. Then in the fall of 2027 the U.S. Treasury is expected to run out of funding options. With a deeply divided administration, Congress, and Senate, the fight could be brutal and result in a government shutdown.
The longest government shutdown in history occurred between October 1, 2025, and November 12, 2025 (42 days) and ended only when Congress passed stopgap and full-year spending packages signed by the president. There was a partial shutdown in January/February 2026 involving Homeland Security. All were under Donald Trump. Under Trump’s first term, shutdowns of varying degrees occurred in January 2018 and again later in 2018 into early 2019. While most of the shutdowns since 1980 have been under Republican presidents, three did take place under Democrat presidents. However, we note that Congress and the Senate were Republican controlled at the time. The two longest remain under the purview of Donald Trump. Shutdowns can be very confrontational, costly affairs.
But what happens in the markets? During the lengthy October/November 2025 shutdown, not much really happened. Initially stocks fell, but bond prices rose (yields fell), gold rose, and the US$ Index rose. Then stocks rose, bond prices fell (yields rose), gold fell, and the US$ basically flatlined. A shutdown is not an easy affair. There would also be concern about liquidity and credit risks.
The U.S. lost its vaunted AAA credit rating in August 2011 as debts, deficits, and polarization rose. Federal debt was less than half of today’s $40.6 trillion, but the budget deficit was over $1 trillion. This was mainly due to the 2008 financial crisis where the bailouts were set in motion under President George W. Bush. The polarization today is more severe than in 2011. Oddly, the rating agencies still deem the U.S. as stable, so there is no immediate threat of another downgrade.
Rising inflation is persistent and present. It leaves the Fed in a difficult position. Adding to the issue is an economy that continues to function witness the higher than expected job increases in October. The buildup will continue into December 8–9. The last two years of the Trump presidency will not be a picnic and may be more volatile than the first two.
Chart of the week
Source: www.stockcharts.com
Nothing like a good old sex scandal to spark all sorts of pandemonium. Nvidia, the world’s second largest company behind Apple, is the bubble that just burst. In the rush to build the AI world, an old-fashioned sex scandal just got in the way, with co-founder/CEO superstar Jensen Huang in all sorts of muck. Apparently, he has now resigned and there is no clearly designated or obvious successor. Yes, sex scandals have brought down many, with exceptions, but in terms of companies there is only one Nvidia.
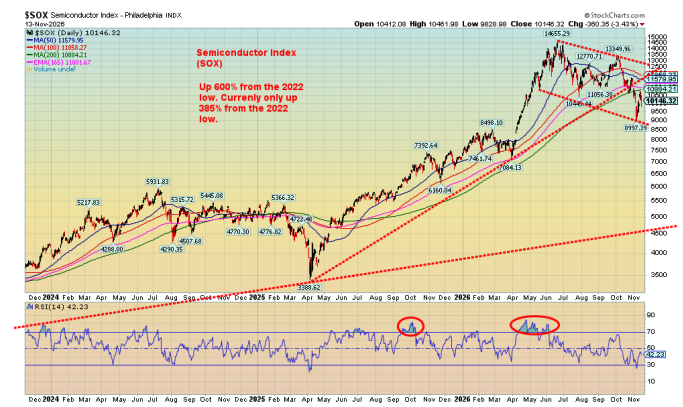
The fallout from the scandal has been bouncy, of course. Once we plunged through that 200-day MA, the roof caved in. Yes, it went below the 200-day before in March and again in July, but volume was not huge, so we bounced back. This time? Not so much. This was a crash. Nvidia is in a bear market, down – depending on the moment – roughly 32% from its all-time high seen in October. Nvidia is a key stock in the S&P 500, the NASDAQ, the Dow Jones Industrials (DJI), plus a few others as well as sector indices like the Semiconductor Index (SOX). Nvidia is also a major component of numerous portfolios, including retirement portfolios. As for the S&P 500, so far, it hasn’t caused much damage as it is down less than 5%. The NASDAQ is down roughly 10% and has been lower. Oh yes, and the Semiconductor Index (SOX)? It’s down 31% from its high.
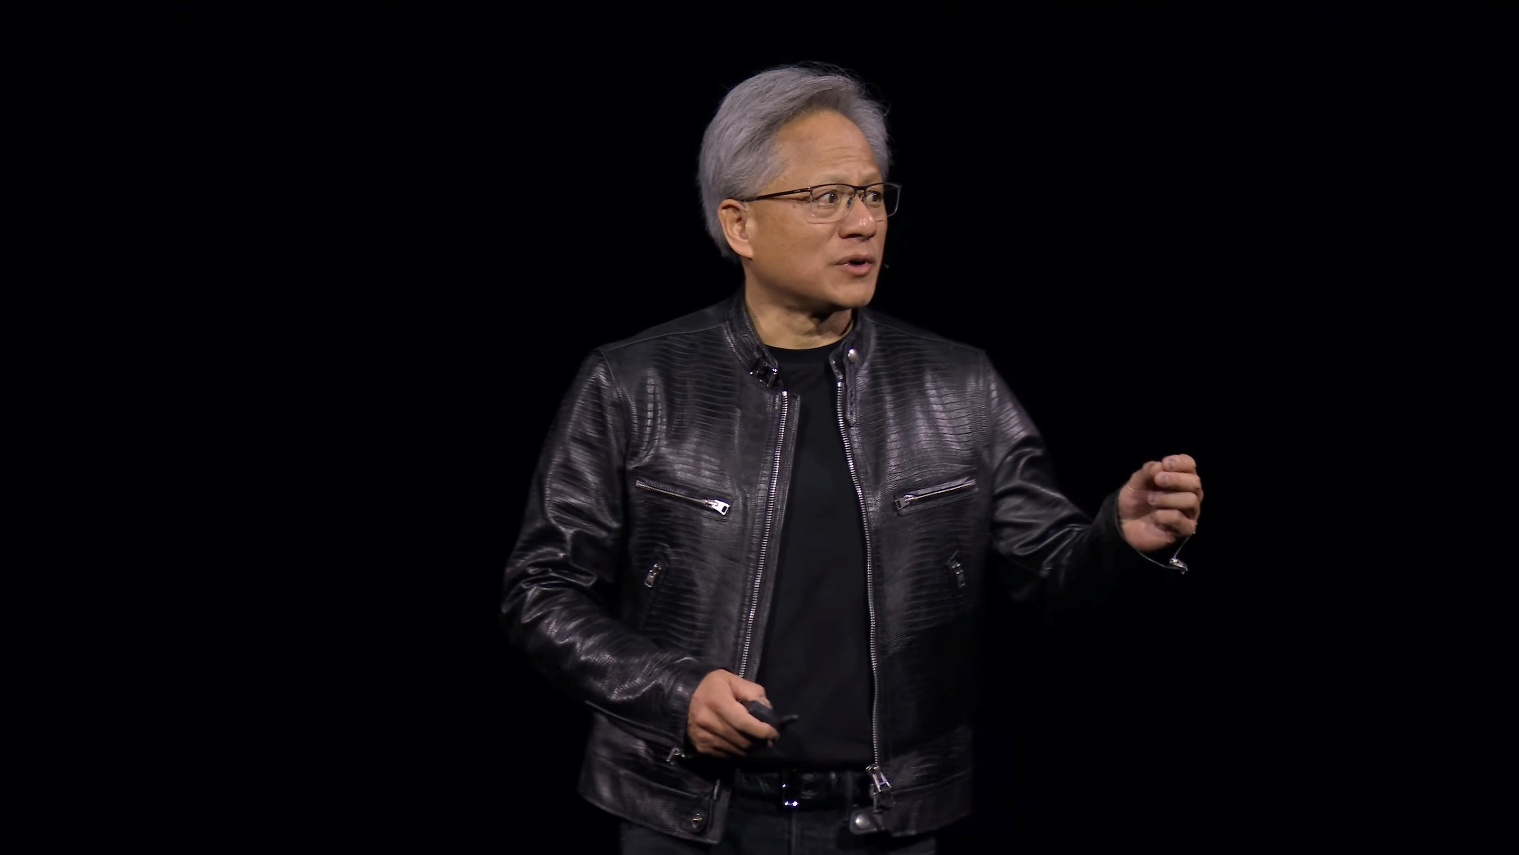
The Leather Jacket - yours for only $9,000, Jensen Huang, CEO Nvidia
Source: www.tomshardware.com
So, what now? Nvidia has been the superstar of the AI world. Can the AI build-out continue, especially when it’s being fought against everywhere? Rising interest rates and crowding out in a saturated market are hurting Nvidia and other AI companies’ ability to raise funds. From that top, upwards of $1.6 trillion in Nvidia market cap has been vaporized.
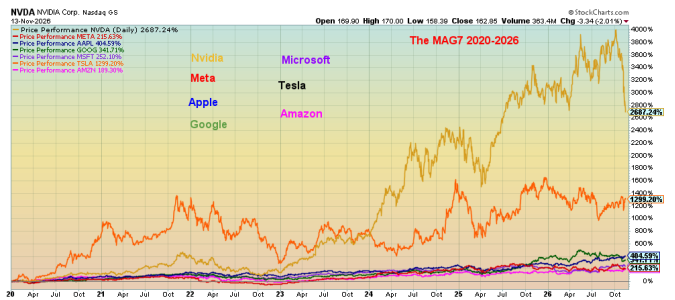
Nvidia dominates the market for chips. It’s global in scope. It finances numerous startups and ongoing AI firms, neocloud operators, data centers, etc. Previously with Huang at the helm, the mere mention of his involvement was enough to get a stock to rise. Nvidia has been by far the star. Since 2020 when things really took off, Nvidia was up some 4,000% at its top. Today? Not so much. Up only about 2,700%. And it’s still number one. According to FactSet, Nvidia from the get-go was up almost 463,000% – a money-making machine turning some into billionaires. According to the Forbes Billionaires List, Huang is estimated to have a net worth of roughly $142 billion, making him the 13th richest person on the planet. He’s influential, often seen with President Trump.
Performance of Nvidia plus other MAG7 Stocks 2020–2026
Source: www.stockcharts.com
Nvidia stock is deeply oversold, so a rebound and test of the 200-day MA wouldn’t be surprising. Many consider Nvidia undervalued here, trading at earnings multiples far below other AI/high-tech stocks. They’ve appointed a temporary CEO, so this may calm some nerves, but the reality is that the Nvidia bull is undoubtedly over, which in turn spills over into the AI sector and the broader stock market. While Nvidia has taken it on the chin, the overall market has not been hit hard. Yes, the NASDAQ is down over 10% from its high but the S&P 500 is down only around 3%. Google, Meta, and Tesla are down 20% or more, so they are in bear markets, but Apple is up during this time. MAGS, the ETF representing the MAG7, is down about 8%.
But the situation does open the door to a lot of unknowns. Huang was a superstar, not just for Nvidia but in the entire AI and high-tech industry. Given his affair was allegedly with what is described as a Chinese intelligence asset, conflict between the U.S. and China could rise. As to calling Alice Huang (no relation) a Chinese asset, we immediately thought of some well-known spy films like the James Bond and Jason Bourne series. Love the analogy. Curiously, Alice Huang is an executive for a private Singapore cloud company called Megaspeed International. Megaspeed was apparently a customer of Nvidia.
There are questions about security breaches that could engulf others. Commerce Secretary Howard Lutnick has been mentioned for his role. Huang is also alleged to have had a relationship with a senior Nvidia executive, plus another employee. It’s a messy affair and so far, the negative impact has fallen mostly on Nvidia. Is there more to come? Stay tuned. This may be just getting underway.
Philadelphia Semiconductor Index (SOX) 2023–2026
Source: www.stockcharts.com
Markets and Trends
|
|
|
|
% Gains (Losses) Trends |
|
||||
|
|
Close Dec 31/25 |
Close Nov 13/26 |
Week |
YTD |
Daily (Short Term) |
Weekly (Intermediate) |
Monthly (Long Term) |
|
|
|
|
|
|
|
|
|
|
|
|
|
|
|
|
|
|
|
||
|
S&P 500 |
6,845.50 |
7,561.64 |
2.5% |
10.5% |
down |
up (weak) |
up |
|
|
Dow Jones Industrials |
48,063.29 |
52,348.03 |
2.1% |
8.9% |
up |
up |
up |
|
|
Dow Jones Transport |
17,357.19 |
20,594.33 |
4.1% |
18.7% |
up |
neutral |
up |
|
|
NASDAQ |
23,241.99 |
25,136.27 |
2.3% |
8.2% |
down |
neutral |
up |
|
|
S&P/TSX Composite |
31,712.76 |
36,105.90 |
0.9% |
13.9% |
up |
up |
up |
|
|
S&P/TSX Venture (CDNX) |
987.74 |
798.46 |
(2.9)% |
(19.2)% |
down |
down |
up`(weak) |
|
|
S&P 600 (small) |
1,467.76 |
1,709.07 |
2.1% |
16.4% |
up |
up (weak) |
up |
|
|
ACWX MSCI World x US |
67.18 |
73.65 |
2.2% |
9.6% |
down |
Neutral |
up |
|
|
Bitcoin |
87,576.98 |
64,710.68 |
(14.7)% |
(26.1)% |
down |
neutral |
neutral |
|
|
|
|
|
|
|
|
|
|
|
|
Gold Mining Stock Indices |
|
|
|
|
|
|
|
|
|
Gold Bugs Index (HUI) |
701.49 |
681.08 |
(7.6)% |
(2.9)% |
down |
down (weak) |
up |
|
|
TSX Gold Index (TGD) |
817.76 |
836.22 |
(5.9)% |
2.3% |
down |
neutral |
up |
|
|
|
|
|
|
|
|
|
|
|
|
Bonds% |
|
|
|
|
|
|
|
|
|
U.S. 10-Year Treasury Bond yield |
4.17% |
5.17% |
6.2% |
24.0% |
|
|
|
|
|
3.3Cdn. 10-Year Bond CGB yield |
3.44% |
3.85% |
5.2% |
11.9% |
|
|
|
|
|
Recession Watch Spreads |
|
|
|
|
|
|
|
|
|
U.S. 2-year 10-year Treasury spread |
0.69% |
0.29% |
(14.7)% |
(59.0)% |
|
|
|
|
|
Cdn 2-year 10-year CGB spread |
0.85% |
0.49% |
(5.8)% |
(48.4)% |
|
|
|
|
|
|
|
|
|
|
|
|
|
|
|
Currencies |
|
|
|
|
|
|
|
|
|
US$ Index |
98.26 |
103.39 (new highs) |
1.1% |
5.2% |
up |
up |
neutral |
|
|
Canadian $ |
72.87 |
70.08 (new lows) |
(1.0)% |
(3.8)% |
down |
down |
down |
|
|
Euro |
117.48 |
110.25 (new lows) |
(1.0)% |
(6.2)% |
down |
down |
neutral |
|
|
Swiss Franc |
126.21 |
119.22 |
(2.2)% |
(5.5)% |
down |
down |
neutral |
|
|
British Pound |
134.78 |
132.17 |
(1.0)% |
(1.9)% |
down |
down |
up (weak) |
|
|
Japanese Yen |
63.83 |
62.64 |
(0.7)% |
(1.9)% |
down |
neutral |
down |
|
|
|
|
|
|
|
|
|
|
|
|
Precious Metals |
|
|
|
|
|
|
|
|
|
Gold |
4,311.97 |
3,876.10 (new lows) |
(4.7)% |
(10.1)% |
down |
down |
up |
|
|
Silver |
71.16 |
48.77 |
(6.1)% |
(31.5)% |
down |
down |
up (weak) |
|
|
Platinum |
2,046.90 |
1,491.20 |
(2.7)% |
(27.2)% |
down |
down |
up (weak) |
|
|
|
|
|
|
|
|
|
|
|
|
Base Metals |
|
|
|
|
|
|
|
|
|
Palladium |
1,619.50 |
1,000.50 |
(2.1)% |
(38.2)% |
down |
down |
down |
|
|
Copper |
5.64 |
6.05 |
(3.0)% |
7.3% |
down |
neutral |
up |
|
|
|
|
|
|
|
|
|
|
|
|
Energy |
|
|
|
|
|
|
|
|
|
WTI Oil |
57.44 |
88.89 |
(1.7)% |
54.9% |
down |
neutral |
up |
|
|
Nat Gas |
3.71 |
3.24 |
9.1% |
(12.7)% |
up |
up |
neutral |
|
Source: www.stockcharts.com
* New All-Time Highs
Note: for an explanation of the trends, refer to the glossary at the end of this article.
New highs/lows refer to new 52-week highs/lows and, in some cases, all-time highs.
Stocks
Source: www.stockcharts.com
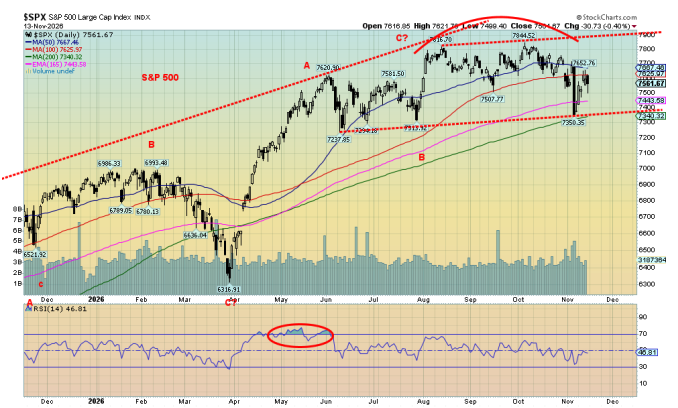
Nvidia is going to crash the market! Arghhhh! Okay, not so much. Nvidia fell 12.8% this past week and is down 12.7% on the year. The S&P 500? It gained 2.5% this past week and is up 10.5% in 2026. That suggests it is a Nvidia problem, not one for the broader market. Nvidia’s problems did knock the markets around this past week, but it was for the most part a problem for Nvidia (and a few others). The Semiconductor Index (SOX) did gain 8.0% this past week. While it’s down 31% from its highs, it’s up 42% on the year. That suggests the AI/Semiconductor bubble has burst but the broader market hasn’t burst – yet.
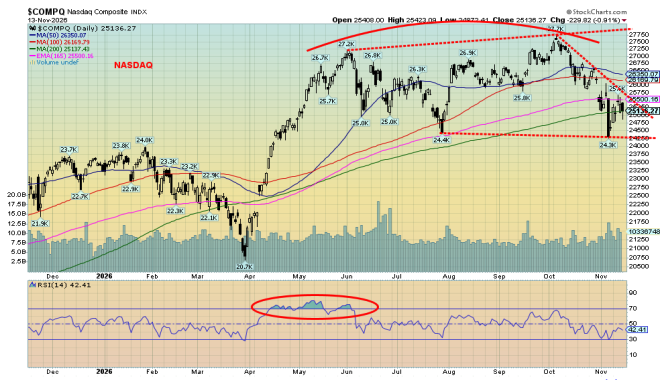
The indices continue to form what looks like topping patterns. The NASDAQ is already in a downtrend but needs to break under 24,000 to really get a down move going. At what level does the market panic? The S&P 500 under 7,300? The Dow Jones Industrials (DJI) under 50,000? However, all the signs continue to point to a lower market, not one going higher. That’s despite weeks like this past one which for the most part are positive.
On the week, the S&P 500 gained 2.5%, the DJI was up 2.1%, the Dow Jones Transportations (DJT) was up 4.1%, and the NASDAQ 2.3%. The S&P 400 (Mid) was up 2.2% and the S&P 600 (Small) up 2.1%. The S&P 500 Equal Weight Index outperformed, up 2.3%. The NY FANG Index rose 3.3%.
Source: www.stockcharts.com
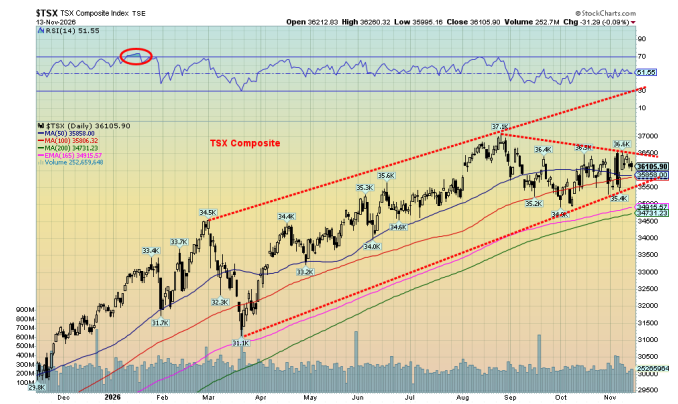
The TSX Composite was up 0.9%, dragged down by the materials sector (golds, metals, materials). The TSX Venture Exchange (CDNX) continued its woes, down 2.9% and down 19.2% on the year. But, as we explain under our commentary on gold, the CDNX is increasingly looking like a buy. In the EU, the London FTSE was up 2.2%, the EuroNext up 2.6%, the Paris CAC 40 up 2.8%, and the German DAX making all-time highs, up 3.6%. In Asia, China’s Shanghai Index (SSEC) was off 0.4%, the Tokyo Nikkei Dow (TKN) gained 6.5%, Hong Kong’s Hang Seng (HSI) fell 3.5% while India’s Nifty Fifty gained 0.5%. Hong Kong was weak because of the semiconductor stocks and the Nvidia fall-out.
Note that the TSX held its gains but not thanks to the materials which were down. Energy (TEN) and Information Technology (TTK) dragged the TSX higher this past week. While stocks were positive earlier in the week, they fell on Friday, dragged down by the chipmakers. Breakdowns lie below.
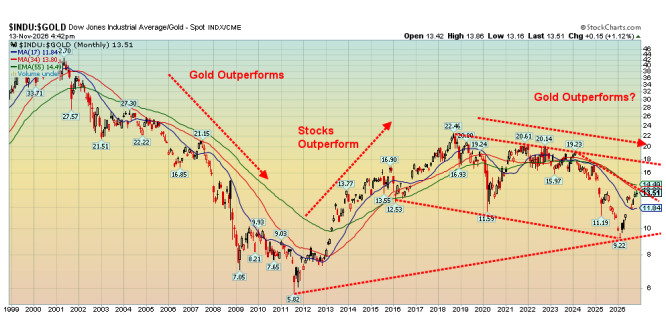
A note on the DJI/Gold ratio shown on the next page. Having fallen considerably from 2023 to early 2026, the ratio has reversed in favour of the DJI over gold. We are now at key resistance for the ratio. If we can get over 14, then it is possible for higher levels in favour of the DJI. But a return under 12 could see us fall further in favour of gold. The ratio has a long history. There was a major high in 1999, followed by the 2000–2011 gold bull. That favoured gold over stocks during that period. The period 2011–2018 favoured stocks. Since then, we have been on a slow, steady decline. The recent rebound for the ratio has favoured stocks, but as we note we are at key resistance.
Source: www.stockcharts.com
Source: www.stockcharts.com
Bitcoin
Source: www.stockcharts.com
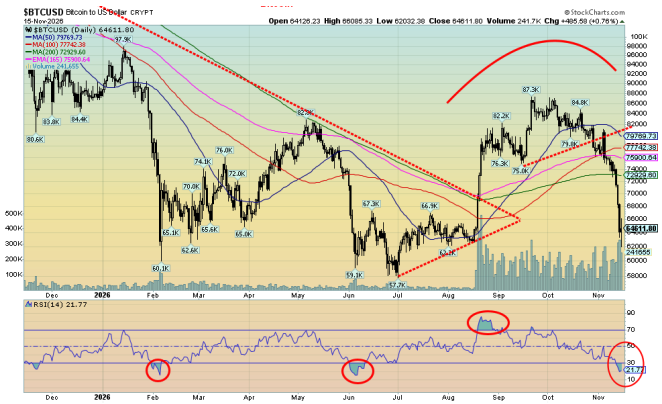
Nvidia wasn’t the only crash this past week. Bitcoin fell 14.7%. There were lots of reasons. The hack at Biance may have been one as confidence in cryptos waned. It was a liquidity event in cryptos as they responded negatively to inflation, the mid-term results, interest rate hike fears. The mid-term results are interesting as the Republicans were viewed as friendlier to crypto. Altogether now Bitcoin is down 49% from its October 2025 record high.
It reminds of other crypto wipeouts seen in 2018 and 2022. During those collapses Bitcoin fell 84% and 77% respectively. We could be headed there once again. The topping pattern suggested a potential drop to at least $67,500. We’ve passed that so the next target is down to $59,900. We’re getting there. Owning crypto is dangerous to your wealth. Except for those that cashed out near the top. We’re oversold now so a bounce might occur. But overall Bitcoin looks lower.
Bonds
Source: www.tradingeconomics.com, www.home.treasury.gov, www.bankofcanada.ca
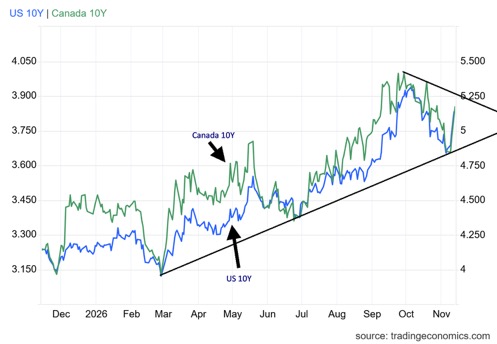
Interest rates surged again this past week, thanks to a continued hot CPI and PPI, the fear of Fed rate hikes at the December 8–9 FOMC, and the threat of the ongoing wars which could push oil prices higher and thus inflation higher. The U.S. 10-year Treasury note jumped to over 5.15%, up from 4.87% the previous week, a leap of 6.2%. The Canadian 10-year Government of Canada bond (CGB) also rose up to 3.85% from 3.66%. What was interesting was that the 2-year–10-year spreads narrowed further. The U.S. 2–10 fell to 29 bp from 34 bp and the Cdn 2–10 dropped to 49 bp from 52 bp.
Some are speculating that the yield curve could go negative, depending on how the short-dated treasury bills and up to the 2-year react to the thoughts of a higher Fed rate. As well, the U.S. debt mountain and budget deficits keep growing. Add in the huge amount of funds that need to be raised, and the pressure is for higher interest rates. The U.S., along with the U.K., have the highest interest rates in the G7.
Pressure remains to the upside. Once the U.S. 10-year is over 5.35%, we could be on the way to 5.50%. Canada needs to get back over 4.00% to suggest higher levels. Higher interest rates are bad for gold. With an ongoing stronger than expected economy, we can’t yet combine a weak economy with higher gold prices. Stronger economy and rising interest rates are deadly for gold. Weak economy and rising interest rates suggest stagflation, which is good for gold.
Gold and silver
Source: www.stockcharts.com
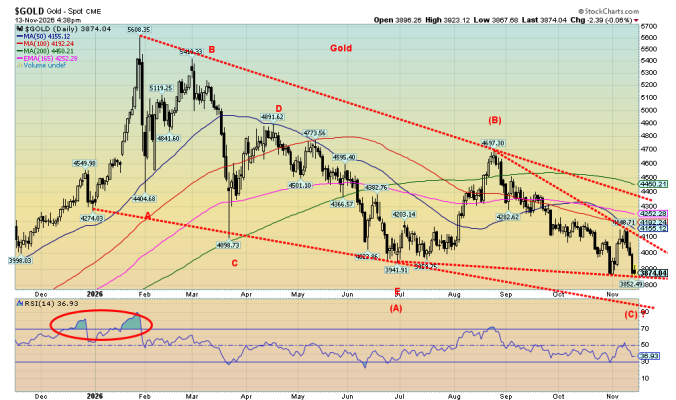
Ouch! Whither gold prices? While we continue to be a bull for gold, some believe that a bigger breakdown is coming before a new bull gets underway. Gold was atrocious again this past week, falling 4.7% and making new 52-week lows. Silver lost 6.1% and closed under $50. Platinum fell 2.7%, palladium dropped 2.1%, and copper was hit because of fears of lower demand due to ongoing protests on new data centers, funding issues in the AI industry, and the Jensen Huang sex scandal. Copper fell 3.0%, closing at $6.05. Naturally, the gold stocks were hit with the Gold Bugs Index (HUI) down 7.6% while the TSX Gold Index (TGD) fell 5.9%.
However, a funny thing happened. Yes, gold made fresh 52-week lows (barely), but silver and platinum did not.
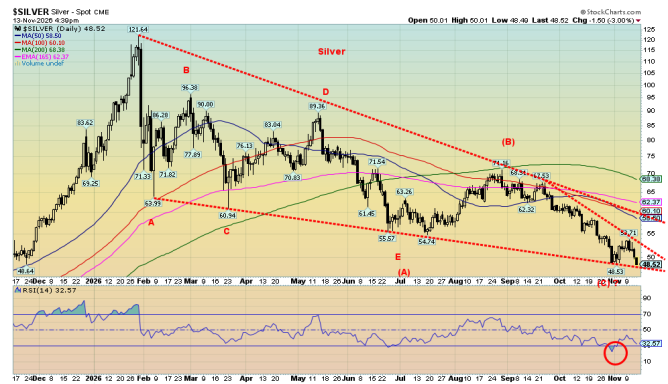
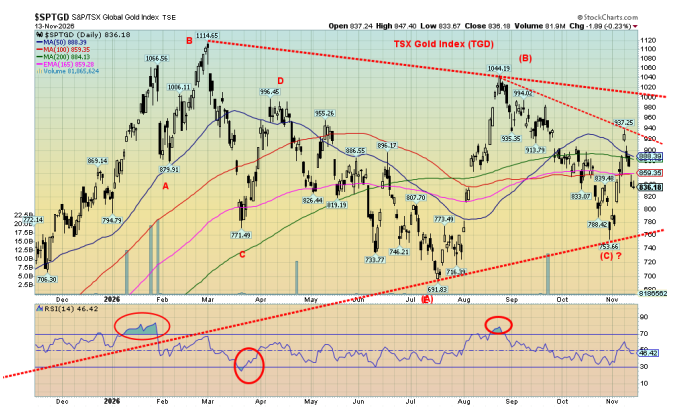
More importantly, the HUI and the TGD remain above the October 30 low and well above the July 17 low. A significant divergence from both gold and silver. What is possible is that gold falls to that lower trend line, currently near 3,600 and possibly down to $3,500. But if silver and the gold stocks hold up making no new lows the divergence continues.
Gold stocks are suggesting that once this mini bear is over, gold will resume its bull market. As well, because of high gold prices and even despite the recent price pullback, gold mining companies are reporting a banner year. As well, drilling and exploration continues. The junior gold and metal mining stocks that reside on the TSX
Venture Exchange (CDNX) have been thoroughly beaten up, with some down over 50% from their recent highs. Many are quite oversold, and yet nothing has changed from when they were at higher prices. No wonder we are seeing buy signals in the junior gold and metal mining stocks. We can’t confirm any bottoms, but the technical signals are there. It’s a question of when, not if.
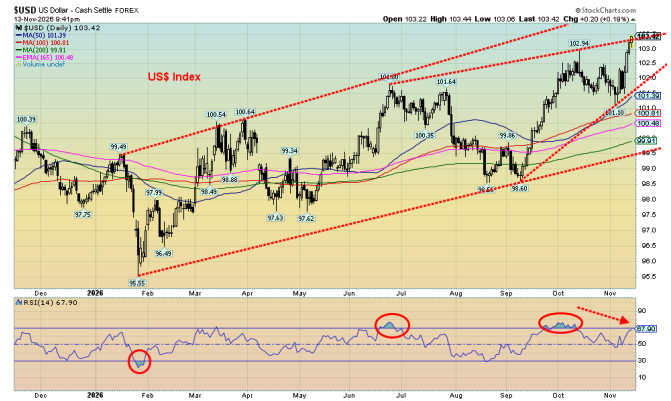
But for gold, the reality is that the US$ Index is making 52-week highs, interest rates have resumed their upward trend with the U.S. 10-year Treasury note leaping back over 5%, inflation continues on an upward path with this week’s release of the CPI and PPI, and the Fed continues to be forecasted to hike the key Fed rate at the December 8–9 FOMC. The wars continue, threatening to push oil prices higher again which in turn increases inflation. The stock market hangs in and the U.S. economy continues to be the best in the G7. All conspire against holding gold.
Source: www.stockcharts.com
Given that gold stopped at that lower trend line this past week, this gives us some hope that we are at or near a bottom. Silver, in particular, is at trend line support. The divergences with silver and the gold stocks are positive, but only if silver, the HUI, and TGD are not making new lows with gold. Silver maybe, but the gold stocks need to continue to hold up.
We remain bullish for gold, silver, and the gold stocks, but the current correction/bear may not be finished yet.
We continue to look at the December 8–9 FOMC as a possible final low for gold. We remember fondly the low gold made in December 2015 at the FOMC. The Fed actually hiked rates, but gold took off instead of falling. 2016 was a banner year for both gold, silver, and the gold stocks.
Source: www.stockcharts.com
We also like the forming bearish wedge triangles we’re seeing for both and silver. Gold begins to realize its breakout over $4,100. But we’d be far more comfortable over $4,500 where a low could be declared. The TGD is forming a symmetrical triangle with the current lower end near 700. That can’t be ruled out. Breakout is over 940, but we’d feel far better over 1,000 again. The July low for the TGD was at 691, so we definitely would want to see that hold. We’re not oversold here, so further down movements can’t be ruled out. Ultimately, the triangle patterns suggest eventually an upside breakout.
The US$ Index is at an interesting juncture. Yes, the index jumped nicely this past week, right up into an upper trendline from the June and October highs. The RSI is not overbought, but it is diverging with the earlier RSI highs, given a higher index but a lower RSI. The formation looks like a bearish wedge triangle. The odds favour a return down for the US$ Index. A close over 104 would, however, suggest higher levels. The US$ Index is important for the price of gold as the two generally move inversely to each other.
Source: www.stockcharts.com
Oil and gas
Source: www.stockcharts.com
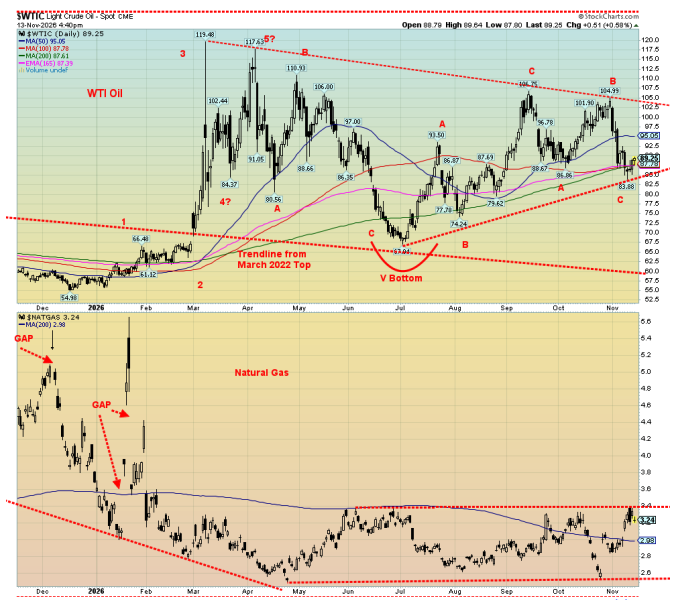
Oil prices sold off again this past week as hints were made that peace was at hand – that the U.S. didn’t need a deal with Iran as they already control Gulf ports and the Strait of Hormuz. Tell that to the Iranians as bombing of ships in the Strait of Hormuz continues. As well, there is growing pressure from Israel to resume the attacks on Iran. President Trump even threatened to nuke them.
WTI oil prices have fallen roughly $8 since the midterms. WTI was down some $21 from the October 30 high to the November 10 low. On the week, WTI continued its fall from the previous week, finishing down 1.7%. Brent crude fell 1.7% on the week. Rising forecasts for colder weather helped push natural gas (NG) up 9.1% on the week to $3.24. Are we finally poised for a breakout from that bottoming sideways pattern? Targets could be over $4. EU NG at the Dutch Hub was also up this past week but not as much, only 2.9%. The real surprise were the energy stocks as the ARCA Oil & Gas Index (XOI) leaped 6.4% and the TSX Energy Index (TEN) jumped 4.1%. Are energy stocks leading the way, projecting that higher oil and gas prices are coming?
WTI oil broke trendline support and the 200-day MA, but follow-through was feeble. By week’s end we were back over the 200-day MA. All this suggests to us that the downside break was what we call a false breakdown. WTI probed lower, but the selling dried up. Probably would take out a few stops. We’ve seen that action before. To confirm that low we need to get back above and close above $95. A return and breakdown under $85 would be negative.
Betting against rising oil prices could be a loser’s game. Pressure is building for a resumption of the U.S./Israel/Iran war. The distraction is useful to both Trump and Netanyahu. The strikes from the Houthis continue as Saudi Arabian pumping stations are hit. The Russia/Ukraine war is nowhere near any peace deal, if one is even possible, as Ukraine keeps hitting Russian oil facilities and Russia retaliates with greater force. All are never-ending wars with occasional pauses. The Russia/Ukraine war is over four years old, although technically it is 12 years old, dating from the overthrow of the Viktor Yanukovych government during the Maidan Revolution in 2014. The U.S./Israel/Iran war is some nine months old. The Saudi/Houthi conflict started back in 2015 but has escalated since the start of the U.S./Israel/Iran war. The Saudi/Houthi conflict compromises Saudi’s oil production, the Red Sea, and the Bab-el-Mandeb Strait. The Houthis are fighting at two levels, one with Saudi Arabia and the other with Yemen.
Despite the recent breakdown for oil prices, the pressure is building for them to start another ascent.
Copyright David Chapman 2026
GLOSSARY
Trends
Daily – Short-term trend (For swing traders)
Weekly – Intermediate-term trend (For long-term trend followers)
Monthly – Long-term secular trend (For long-term trend followers)
Up – The trend is up.
Down – The trend is down
Neutral – Indicators are mostly neutral. A trend change might be in the offing.
Weak – The trend is still up or down but it is weakening. It is also a sign that the trend might change.
Topping – Indicators are suggesting that while the trend remains up there are considerable signs that suggest that the market is topping.
Bottoming – Indicators are suggesting that while the trend is down there are considerable signs that suggest that the market is bottoming.
Disclaimer
David Chapman is not a registered advisory service and is not an exempt market dealer (EMD) nor a licensed financial advisor. He does not and cannot give individualised market advice. David Chapman has worked in the financial industry for over 40 years including large financial corporations, banks, and investment dealers. The information in this newsletter is intended only for informational and educational purposes. It should not be construed as an offer, a solicitation of an offer or sale of any security. Every effort is made to provide accurate and complete information. However, we cannot guarantee that there will be no errors. We make no claims, promises or guarantees about the accuracy, completeness, or adequacy of the contents of this commentary and expressly disclaim liability for errors and omissions in the contents of this commentary. David Chapman will always use his best efforts to ensure the accuracy and timeliness of all information. The reader assumes all risk when trading in securities and David Chapman advises consulting a licensed professional financial advisor or portfolio manager such as Enriched Investing Incorporated before proceeding with any trade or idea presented in this newsletter. David Chapman may own shares in companies mentioned in this newsletter. Before making an investment, prospective investors should review each security’s offering documents which summarize the objectives, fees, expenses and associated risks. Although Artificial Intelligence (AI) may be deployed from time to time, AI output is monitored and adjusted, if necessary, for accuracy. David Chapman shares his ideas and opinions for informational and educational purposes only and expects the reader to perform due diligence before considering a position in any security. That includes consulting with your own licensed professional financial advisor such as Enriched Investing Incorporated. Performance is not guaranteed, values change frequently, and past performance may not be repeated.
About the author


Website: https://www.enrichedinvesting.com
Disclaimer: David Chapman is not a registered advisory service and is not an exempt market dealer (EMD) nor a licensed financial advisor. We do not and cannot give individualised market advice. David Chapman has worked in the financial industry for over 40 years including large financial corporations, banks, and investment dealers. The information in this newsletter is intended only for informational and educational purposes. It should not be considered a solicitation of an offer or sale of any security. The reader assumes all risk when trading in securities and David Chapman advises consulting a licensed professional financial advisor before proceeding with any trade or idea presented in this newsletter. David Chapman may own shares in companies mentioned in this newsletter. We share our ideas and opinions for informational and educational purposes only and expect the reader to perform due diligence before considering a position in any security. That includes consulting with your own licensed professional financial advisor.