
Is France the sick man of Europe? Contagion is underway as the social unrest spreads to other countries. We look at France in seven charts comparing it with the U.S. and the Eurozone. But the malaise is the same everywhere. Too much debt and budget deficits that are too large. Cutbacks bring social unrest.
Since the end of the Great Recession financial crisis in 2009, stocks have been the place to be. Stock markets have been going almost straight up with interruptions such as the 2020 pandemic crash. We are watching the relationship between stocks and bonds. Will bonds soon be a place to be over stocks? We examine this relationship through our chart of the week.
We look at our weekly markets and trends, and a lot of red ink is showing up. Markets are turning down. Some may even be bottoming. Oil is not one of them, as the ongoing conflicts in the Middle East and Russia/Ukraine threaten to push oil prices even higher. Oil stocks are making all-time highs and are leading the way. This also benefits service firms such as CES Energy Solutions Corp., which provides chemical solutions for the oil and natural gas industry, reported increased total revenue and net income, pays a dividend, and is held in the Enriched Capital Conservative Growth Strategy.*
Not so gold and precious metals, which suffered this past week again. But that sector is showing signs of being oversold. Could a turn be coming? Stock markets led by the AI stocks wobbled this past week again. But they haven't yet given off a strong sell signal. However, the signs are not good. Two of the MAG7 are in bear markets.
There's a chill in the air. No wonder the stock market looks shaky.
This week (October 28) we get the Fed's and the Bank of Canada's (BofC) interest rate decisions. Will they hike? The forecast says Canada will hike, but the U.S. won't. The Fed's closely watched PCE prices are out October 29. The forecast is higher.
Elections are looming: Israel on October 27 and the big one in the U.S. on November 3. Volatility is picking up. Both elections are contentious.
Have a great week.
DC
* Reference to the Enriched Capital Conservative Growth Strategy and its investments, celebrating an 8.67 - year history of 195% growth (annual 13.31%) to September 30, strong alpha and ranking amongst the top at www.emergingmanagers.ca, is added by Margaret Samuel, President, CEO and Portfolio Manager of Enriched Investing Incorporated, who can be reached at 416-203-3028 or msamuel@enrichedinvesting.com This information should not be construed as an offer, or a solicitation of an offer or sale of any security. Past performance does not guarantee future returns.
“We must not sacrifice one of our remaining untamed places in reckless pursuit of oil. We know we have to leave oil in the ground, or destructive climate change will become unstoppable. If not in the pristine and vulnerable Arctic Ocean, then where?”
—Frances Bienecke, environmental activist, president of the Natural Resources Defense Council (2006– 2015); b. 1949
No longer should we rely on oil from countries that are not necessarily friendly or democratic.
—Cathy McMorris Rodgers, American politician, served from 2005 to 2025 as the United States representative for Washington's 5th congressional district, Republican, previously served on Washington House of Representatives (2013–2019); b. 1969
“Even if the economy crashes, we will still burn oil.”
—Robert Kioysaki, American businessman, entrepreneur, author, known for the Rich Dad Poor Dad series of personal finance books, founded the Rich Dad Company, which provides personal finance and business education through books and videos; b. 1947
Is France the sick man of Europe? The sick man of the world? As for Europe, yes, with rising debt and deficits, rising interest costs, and rising inflation. As for the world, not so much. Add in political paralysis and severe social unrest, culminating in the recent demonstrations and protests on the street. France, like many of its G7 brethren, has rising fiscal deficits, persistent inflation, and an aging population. And, like so many others claim and divide, an immigration problem. France’s immigrant population is estimated at 14%–17% of the total population, with many from former French colonies in North Africa. In the G7, Canada is the highest, estimated at 23% while Japan is the lowest at around 2.5%–2.8%. Most of the others are bunched around 14%–17% with Italy below at 10%–11%. (Source: UN Population Division, others like Statistics Canada, U.S. Census Bureau, U.K. Office for National Statistics, National Population Registers).
France has a history of social unrest, beginning with the French Revolution in 1789. There were also the uprisings of 1830 and 1848 (leading to Victor Hugo’s book Les Misérables in 1862), followed by the Paris Commune riots of 1871. Fast forward to 1968 and we saw the student uprisings, followed by the unrest after the shooting of teenagers in 2003 and 2023. Unrest in France almost seems like a rite of passage.
We took a look at some economic indicators just to see how France compared to the U.S. and the euro area. Looking at only three on the chart causes less chart congestion than if we compared them to all the G7 countries.
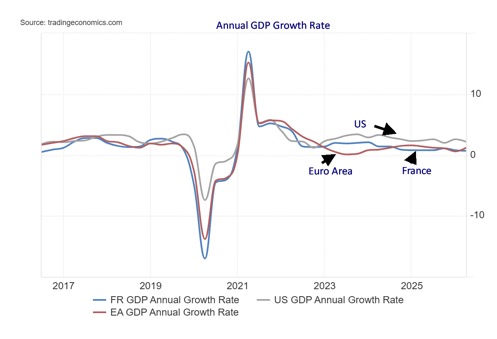
The charts for the three are very similar when it comes to annual GDP growth rates. There, France is the weakest, last at 0.7% in 2025. The U.S. was at 2.2% (highest in the G7) while the euro area was at 1.2%. Despite all the unrest, France is still expected to see growth of at least 0.5% for 2026 (The Economist, October 17, 2026).
This compares to the euro area for growth of 0.9% and the U.S. at 2.3%.
France, U.S., Euro Area Annual GDP Growth Rates 2016–2025
Source: www.tradingeconomics.com, www.insee.fr, www.bea.gov, www.ec.europa.eu
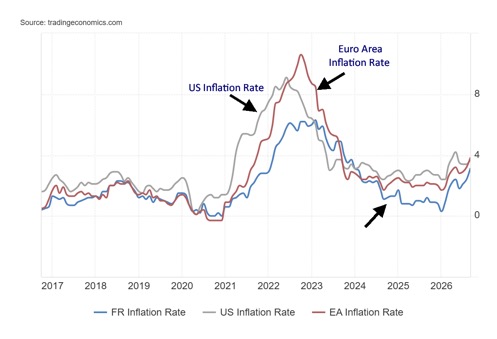
Inflation is a problem, not just in France but in all of the G7 countries. Italy may have the highest at 4.1% and Japan the lowest at 1.9%, but all face the same issues. One of the prime causes is, of course, the ongoing wars in the Middle East and Russia/Ukraine and the upward pressure on energy prices. Energy impacts everything else, so it feeds through the economy. France was last reported at 3.4%, but that’s below the euro area at 3.8% and the U.S. at 3.7%. In all cases, inflation is running faster than the central banks, led by the U.S. Federal Reserve, would prefer.
Inflation France, U.S., Euro Area 2016–2026
Source: www.tradingeconomics.com, www.insee.fr, www.bls.gov, www.ec.europa.eu
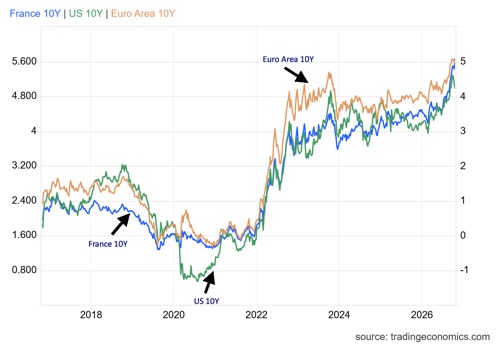
Rising inflation feeds into increases in interest rates. Interest rates have been rising – everywhere. In some countries more than others. France has seen their 10-year government bond rise from 3.61% at the beginning of the year to 5.08% recently, a jump of 148 bp. The U.S. saw its 10-year note rise 78 bp and the euro area 10-year rose 74 bp in the same time period. Higher inflation and, what’s increasingly important, rising demand to finance the deficits are primarily behind the rising interest rates.
Rising interest rates translate into higher interest payments on the debt. At what point do they become unsustainable? Rising interest payments just get added to the budget deficit which in turn feeds into the rising debt to GDP numbers. As we are seeing throughout the G7, rising budget deficits, rising interest payments, and rising debt/GDP have to be met with either spending cuts and/or higher taxes. Spending cuts are being resisted as they increasingly fall on education (students), health care, and even seniors. Raising taxes is anathema to every government. The result is rising protests on the streets and nobody daring to raise taxes. The deficits grow.
Another problem is rising credit default swap (CDS) spreads. France’s CDS spreads have widened considerably over the past year primarily due to rising deficits and political unrest. Other G7 countries have seen little movement in their CDSs.
10-Year Government Bond France, U.S., Euro Area 2016–2026
Source: www.tradingeconomics.com
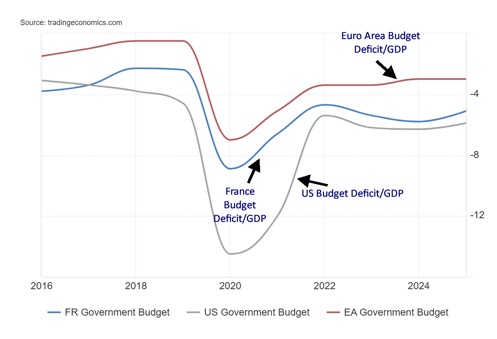
France in 2025 reported that the budget deficit to GDP was 5.1%. It is now 5.4%. Yes, that’s below the U.S.’s 6.5%, but then the U.S. dollar is the world’s reserve currency. France is on the euro and here the central bank is the European Central Bank (ECB). The Bank of France (Banque de France) is part of the Eurosystem of central banks alongside the ECB. Under the EU, countries were to limit their budget deficit to GDP to 3%. The euro area alone is at 3.6%. France is over 5%. In the G7, the U.K. is also over 5.0%. Supposedly, when an EU member exceeds 3%, there is supposed to be an Excessive Deficit Procedure (EDP) to implement fiscal adjustments or face financial sanctions. Besides France, others over 3% include Belgium, Austria, and even Germany. Under the EDP add Bulgaria, Finland, Hungary, Italy, Poland, Romania, and Slovakia. No wonder the EU and eurozone have a debt problem.
Budget Deficit as a Percentage of GDP, France, U.S., Euro Area 2016–2026
Source: www.tradingeconomics.com,www.insee.fr, www.home.treasury.gov, www.ec.europa.eu
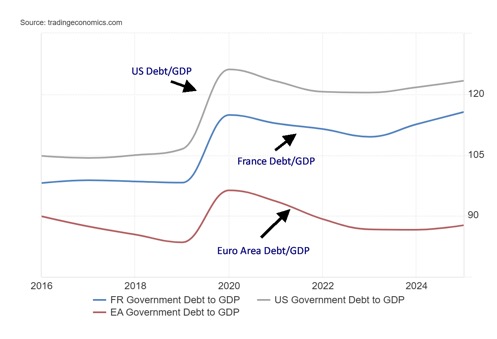
Federal debt to GDP is another area whereby member states are supposed to limit themselves to 60% of GDP. France is at 116%, the second highest of any EU G7 member. In the EU, only Greece (146%) and Italy (137%) are higher. As high as France is, the U.S. is higher at 123%. Canada, for the record, is listed at 114% but that includes both federal and provincial debt. Canada’s federal debt alone is 60%, the lowest in the G7. A rising debt to GDP is a problem for all the G7 nations with Japan the highest at 249%. A debt to GDP ratio over 100% is a problem, given its impact on economic growth, its borrowing costs, and inherent government stability. The euro area has a debt to GDP ratio of 88%.
With governments needing more and more funds, it can lead to crowding out. It also becomes a constraint if they have to fight future financial crises, wars, or pandemics. France has a credit rating of A+, tied with Japan for the second lowest credit rating in the G7. Only Italy at BBB+ is lower. Germany and Canada hold AAA credit ratings. The EU’s and the U.S.’s rating is AA+. The U.K.’s is at AA. All credit ratings are under pressure.
Federal Government Debt as a Percentage of GDP France, U.S., Euro Area 2016–2026
Source: www.tradingeconomics.com, www.insee.fr, www.thewhitehouse.gov, www.ec.europa.eu
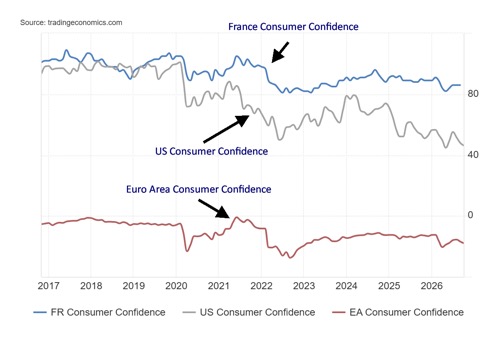
Consumer confidence has been waning everywhere. Unfortunately, comparing different countries’ consumer confidence is difficult because everyone has a different method of measurement. France’s consumer confidence index is last at 86, which is just above its all-time low of 80. Anything under 90 is recording pessimism. They shouldn’t feel lonely as the U.S., as measured by the Michigan Consumer Sentiment Index, was last at 46.3, just above its lowest recorded level of 44.8. The euro area consumer confidence is measured differently and is last at -17.9, not far from its lowest reading of -27.5. It’s negative as their index goes from -100 to +100.
You could say France’s consumer confidence is low, but so it is everywhere else. A malaise, even as consumer spending holds up. But don’t forget consumer spending includes food and energy, necessities. In that respect France is no different. Consumers are negative about their financial situation and their expected financial situation. It’s a malaise everywhere.
Consumer Confidence France, U.S., Euro Area 2016–2026
Source: www.tradingeconomics.com, www.insee.fr, www.umich.edu, www.commission.europa.eu
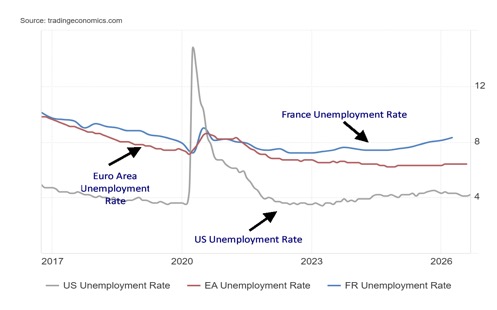
Our final measurement is the unemployment rate. Once again, countries use different methods to calculate unemployment. France last reported its unemployment rate at 8.3%, the highest in the G7. Like the others, this is the headline rate. The actual rate may be higher. It was the highest level since Q3 2020 during the pandemic. Youth unemployment in France is 20.6% and rising. Youths dominate the social unrest on the streets. France’s high unemployment rate is contributing to the unrest, but it is not the sole reason. Budget cuts and more are also contributing, particularly to high school and university education. That’s a fallout from the high debt and high-budget deficits.
Unemployment Rate France, U.S., Euro Area 2016–2026
Source: www.tradingeconomics.com, www.insee.fr, www.bls.gov, www.ec.europa.eu
The malaise in France could be transferred to any G7 country. But so far, unrest has been contained to France, but it is now showing up in other countries starting with Italy. Contagion? The problems are the same everywhere: rising inflation, rising cost of living, economic strain. Adding to the grievances is social division and a move to extremes, either left or right mostly right. France is considered the sick man of the EU, but others are not far behind. All G7 nations suffer from rising inflation, high-budget deficits, rising debt to GDP, rising cost of living, rising unemployment, and sinking consumer confidence. Rising interest rates are just the result.
Stock markets have generally held in so far, hyped higher by AI. But France’s Paris CAC 40 is in correction territory, down 10.8% from its all-time high. By comparison, the S&P 500 is down only 2.3% while the EuroNext is off 7.1%. So, the question is asked: could France trigger a sovereign debt crisis? No, we are not yet at the EU/Greek debt crisis of 2010–2012 that lingered long after. In some ways France is in worse shape than Greece in 2010. No, not near bankruptcy but definitely strained. We suspect a bankruptcy won’t happen, but it doesn’t lessen the current crisis. A stock market crash does not necessarily make a recession possible. But a bond/debt crisis will.
Chart of the week
Source: www.stockcharts.com
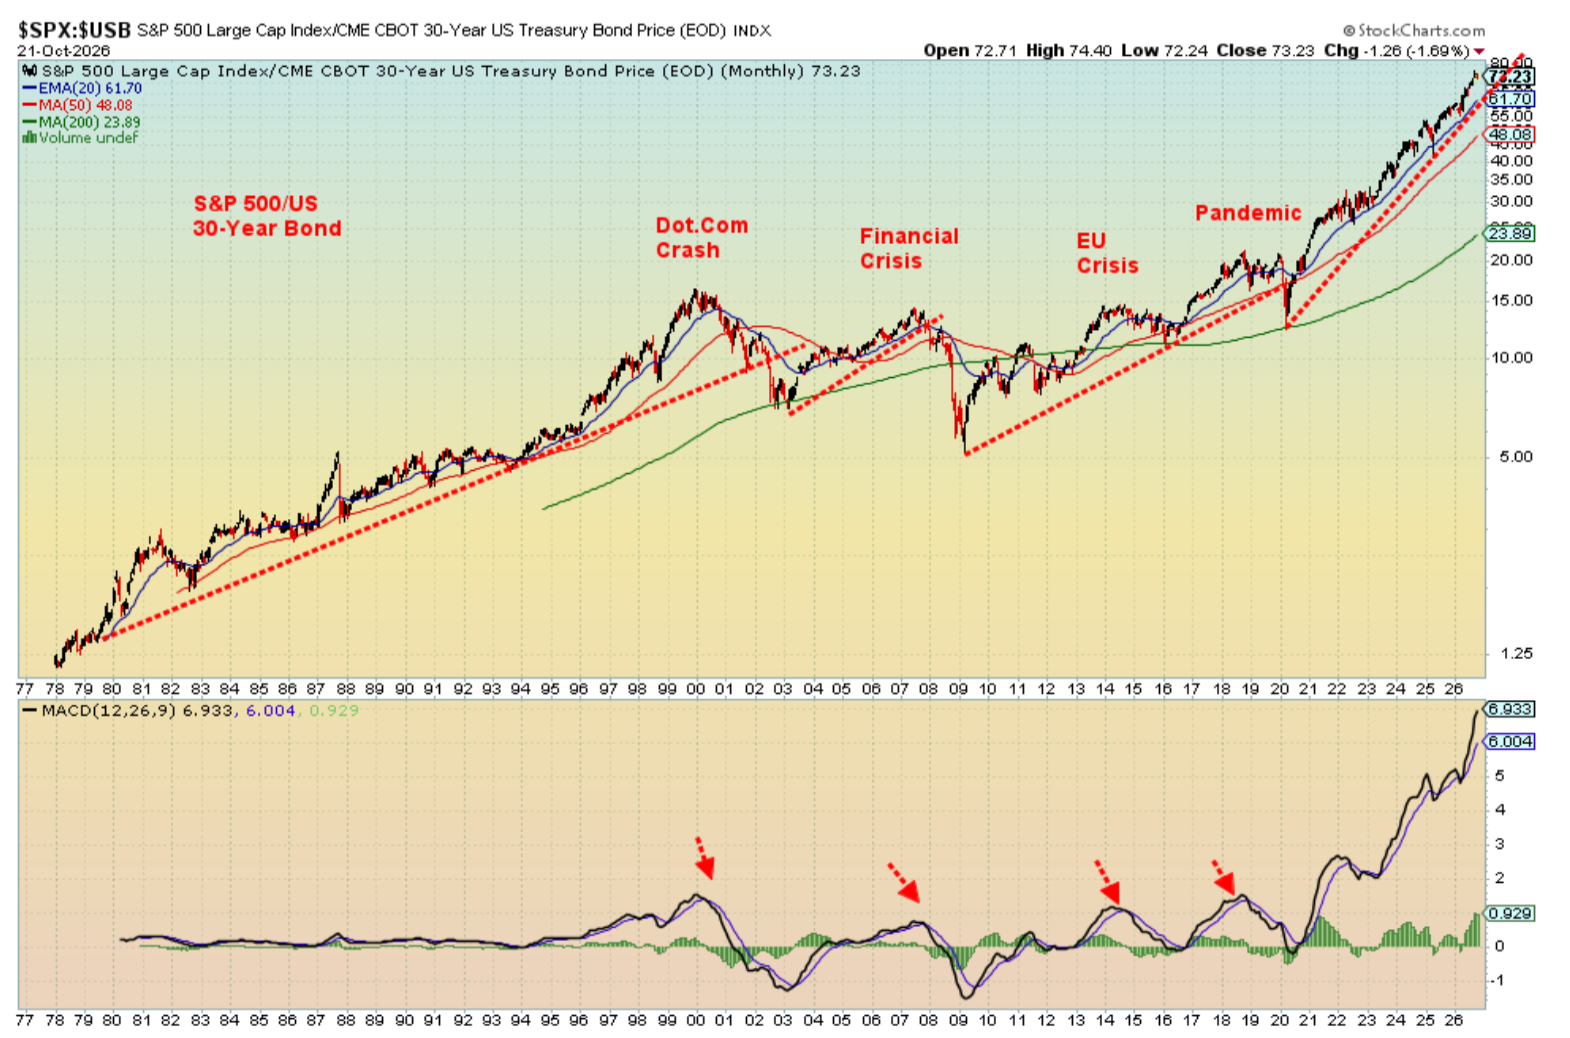
Intermarket analysis can be quite useful. What is intermarket analysis? It uses regular technical analysis to examine the relationship between different asset classes – stocks, bonds, commodities, currencies. One of the best known is the Dow Jones Industrials/Gold ratio. But just about anything can be compared. It could help point out potential trend changes. But, as like anything, you don’t look at one in isolation. See if the others confirm the action.
Above is the S&P 500/U.S. 30-year bond ratio, looking at whether one should hold stocks or hold bonds. Or at least lean in that direction. You can then crosscheck this by looking at, say, the 30-year bond to gold ratio. There are many others.
Since that chart started in 1978, there have been only four occasions where a signal was received to lighten up on stocks and add bonds. Those were: the dot.com/high-tech crash of 2000–2002, the financial crisis of 2007–2009, the EU debt crisis of 2013–2013, and the 2020 pandemic. Making this difficult is that the first two offered distinct advice to sell stocks and buy bonds, while the latter two were less clear or for quite a short period, risking whiplash. What will the next stock/bond switch bring?
Since the pandemic, the trend has been straight-up in favour of stocks over bonds. Since the pandemic, bonds as measured by the U.S. 30-year bond have lost money, down 31.9% (before coupon). Meanwhile, the S&P 500 gained 139.6% and gold was up 171.9%. So, when will bonds bottom (price, yields move inversely to price). There have been no bond events as in a collapse of a major hedge fund that could spark contagion, or a significant sovereign debt crisis. However, both remain a real risk, especially as we watch what is going on in France. When these events occur, it often signals turning points.
Both bonds and stocks remain a key part of portfolios. The old rule of thumb was the 60/40 portfolio; i.e., 60% stocks, 40% bonds. Knowing which way to lean when the tide turns is helpful to all portfolio managers.
Markets and Trends
|
|
|
|
% Gains (Losses) Trends |
|
||||
|
|
Close Dec 31/25 |
Close Oct 23/26 |
Week |
YTD |
Daily (Short Term) |
Weekly (Intermediate) |
Monthly (Long Term) |
|
|
|
|
|
|
|
|
|
|
|
|
|
|
|
|
|
|
|
||
|
S&P 500 |
6,845.50 |
7,623.68 |
(0.5)% |
11.4% |
down |
up |
up |
|
|
Dow Jones Industrials |
48,063.29 |
52,215.16 |
0.4% |
8.6% |
up (weak) |
up |
up |
|
|
Dow Jones Transport |
17,357.19 |
20,041.91 |
0.8% |
15.5% |
neutral |
neutral |
up |
|
|
NASDAQ |
23,241.99 |
25,955.34 |
(0.7)% |
11.7% |
down |
up |
up |
|
|
S&P/TSX Composite |
31,712.76 |
35,788.18 |
(1.1)% |
12.9% |
down (weak) |
up |
up |
|
|
S&P/TSX Venture (CDNX) |
987.74 |
820.95 |
(2.9)% |
(16.9)% |
down |
down |
up`(weak) |
|
|
S&P 600 (small) |
1,467.76 |
1,681.71 |
1.7% |
14.6% |
down (weak) |
neutral |
up |
|
|
ACWX MSCI World x US |
67.18 |
73.47 |
(1.0)% |
9.4% |
down |
up (weak) |
up |
|
|
Bitcoin |
87,576.98 |
81,242.72 |
(0.4)% |
(7.2)% |
down (weak) |
up |
up (weak) |
|
|
|
|
|
|
|
|
|
|
|
|
Gold Mining Stock Indices |
|
|
|
|
|
|
|
|
|
Gold Bugs Index (HUI) |
701.49 |
675.84 |
(8.3)% |
(3.7)% |
down |
down |
up |
|
|
TSX Gold Index (TGD) |
817.76 |
802.42 |
(9.2)% |
(1.9)% |
down |
down |
up |
|
|
|
|
|
|
|
|
|
|
|
|
Bonds% |
|
|
|
|
|
|
|
|
|
U.S. 10-Year Treasury Bond yield |
4.17% |
5.00% |
(1.8)% |
19.9% |
|
|
|
|
|
3.3Cdn. 10-Year Bond CGB yield |
3.44% |
3.85% |
0.5% |
11.9% |
|
|
|
|
|
Recession Watch Spreads |
|
|
|
|
|
|
|
|
|
U.S. 2-year 10-year Treasury spread |
0.69% |
0.30% |
(16.7)% |
(56.5)% |
|
|
|
|
|
Cdn 2-year 10-year CGB spread |
0.85% |
0.49% |
(14.0)% |
(42.4)% |
|
|
|
|
|
|
|
|
|
|
|
|
|
|
|
Currencies |
|
|
|
|
|
|
|
|
|
US$ Index |
98.26 |
101.81 |
flat |
3.6% |
up |
up |
neutral |
|
|
Canadian $ |
72.87 |
71.40 |
1.0% |
(2.0)% |
up (weak) |
down |
down |
|
|
Euro |
117.48 |
111.94 |
(0.4)% |
(4.7)% |
down |
down |
neutral |
|
|
Swiss Franc |
126.21 |
121.18 |
(0.2)% |
(4.0)% |
neutral |
down |
neutral |
|
|
British Pound |
134.78 |
133.71 |
0.3% |
(0.8)% |
neutral |
down |
up (weak) |
|
|
Japanese Yen |
63.83 |
63.76 |
0.7% |
(0.1)% |
up (weak) |
up (weak) |
down |
|
|
|
|
|
|
|
|
|
|
|
|
Precious Metals |
|
|
|
|
|
|
|
|
|
Gold |
4,311.97 |
3,996.90 |
(4.1)% |
(7.3)% |
down |
down |
up |
|
|
Silver |
71.16 |
53.90 |
(5.4)% |
(24.3)% |
down |
down |
up |
|
|
Platinum |
2,046.90 |
1,556.00 |
(5.3)% |
(24.0)% |
down |
down |
up |
|
|
|
|
|
|
|
|
|
|
|
|
Base Metals |
|
|
|
|
|
|
|
|
|
Palladium |
1,619.50 |
1,045.50 |
(6.2)% |
(35.4)% |
down |
down |
neutral |
|
|
Copper |
5.64 |
6.46 |
(0.9)% |
14.5% |
down |
up |
up |
|
|
|
|
|
|
|
|
|
|
|
|
Energy |
|
|
|
|
|
|
|
|
|
WTI Oil |
57.44 |
103.46 |
1.7% |
80.0% |
up |
up |
up |
|
|
Nat Gas |
3.71 |
2.63 |
(15.7)% |
(29.1)% |
down |
down |
neutral |
|
Source: www.stockcharts.com
* New All-Time Highs
Note: for an explanation of the trends, refer to the glossary at the end of this article.
New highs/lows refer to new 52-week highs/lows and, in some cases, all-time highs.
Stocks
Source: www.stockcharts.com
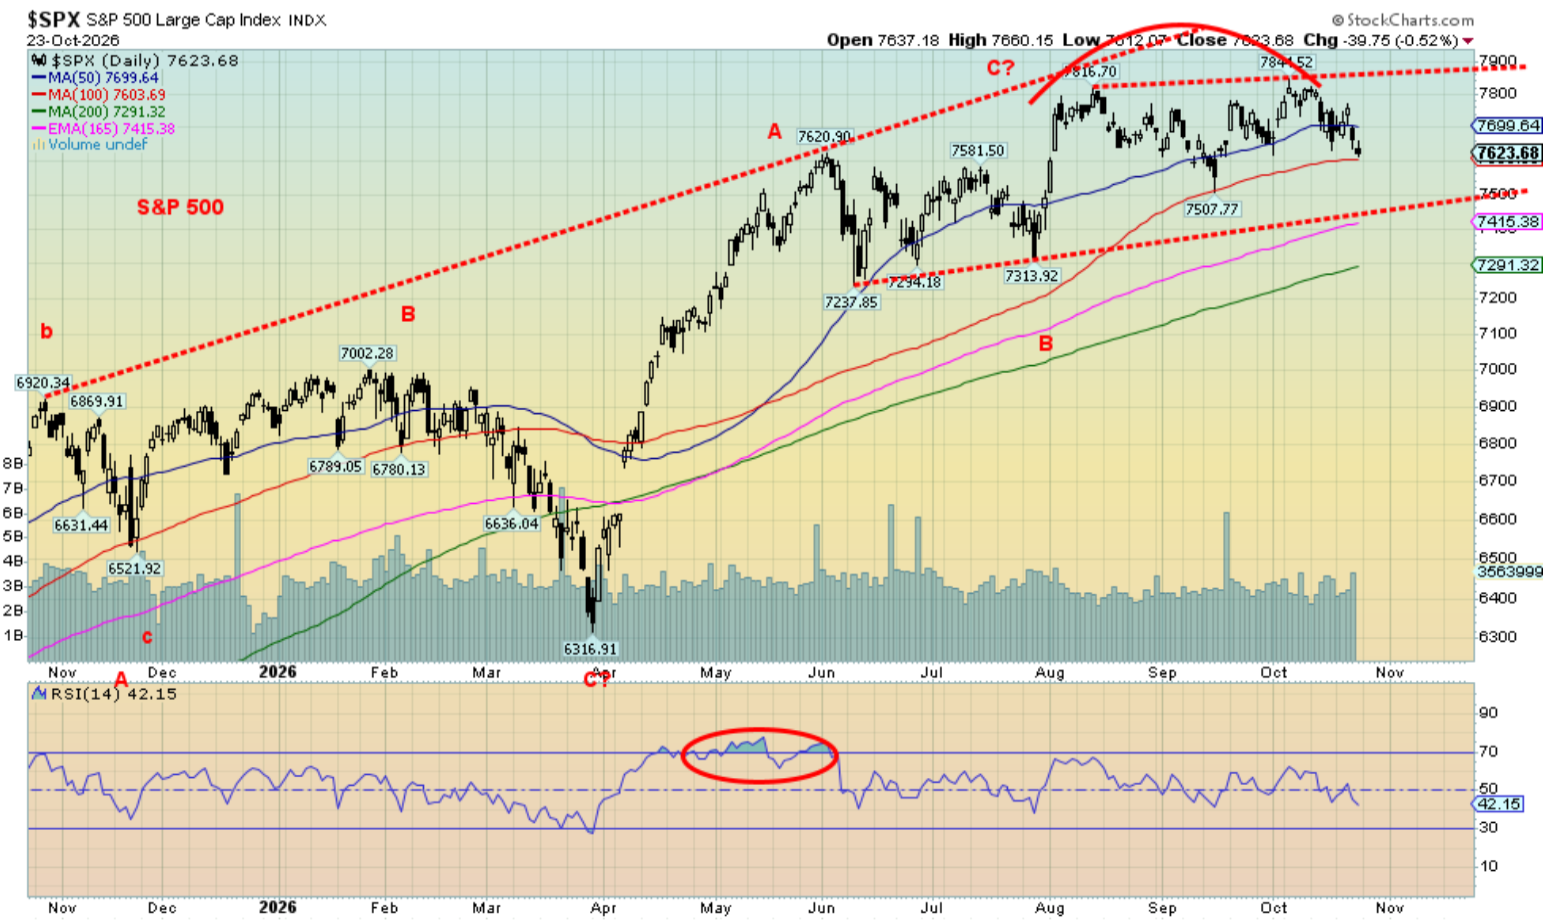
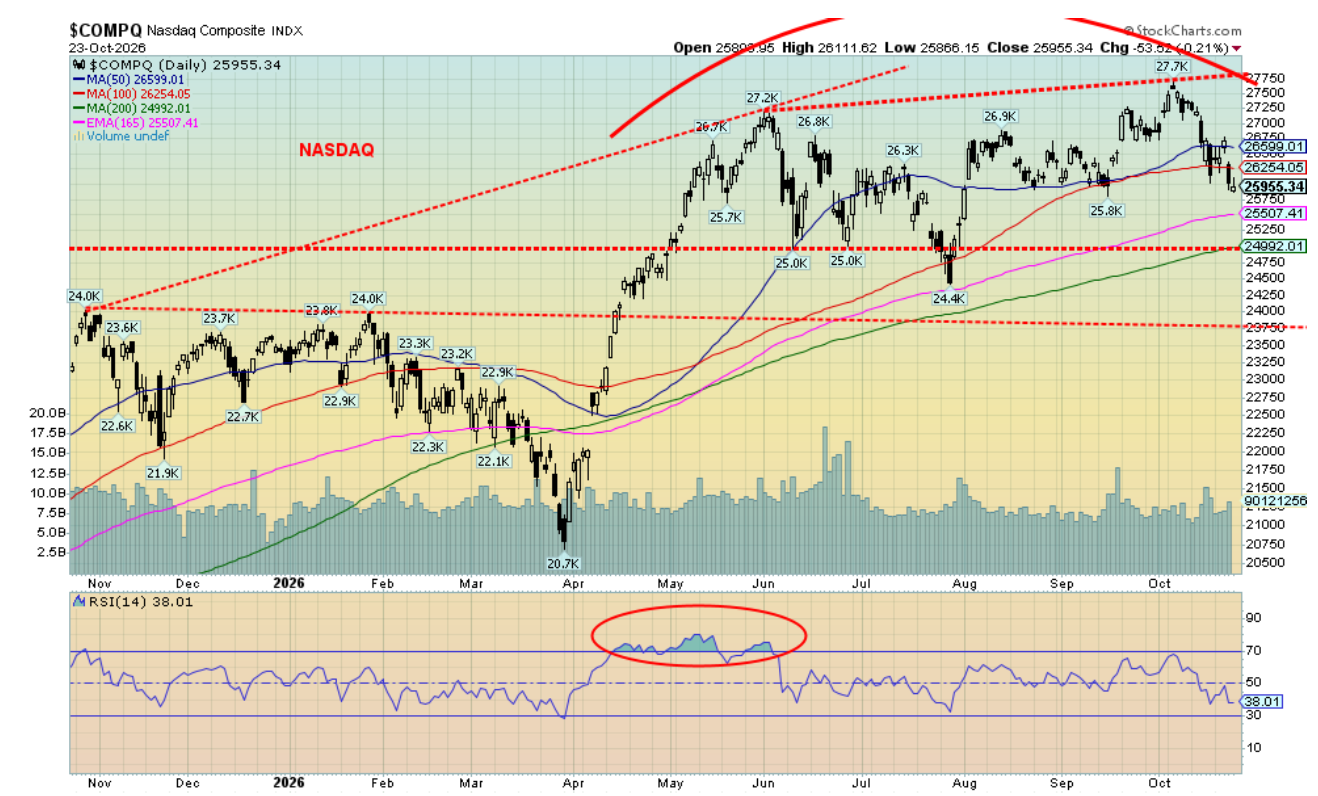
The AI sell-off appears to be underway. This past week the MAG7, represented by the ETF MAGS, fell 1.7%. The NY FANG Index dropped 2.0%. The NASDAQ fell 0.7% while the S&P 500 dropped 0.5%. Their daily short-term trends have turned down. Individually, Meta fell 9.4%, while Google was down 5.8%. Not all of the MAG7 fell as two did go up: Tesla and Apple. Apple made all-time highs. Tesla and Google are in bear markets, down over 20% from their all-time high. Meta, Amazon, and Nvidia are in corrective markets. Microsoft is down but only 5% while Apple is actually up. On another note, we report that Trump Media (DJT) fell another 8.4% to new all-time lows.
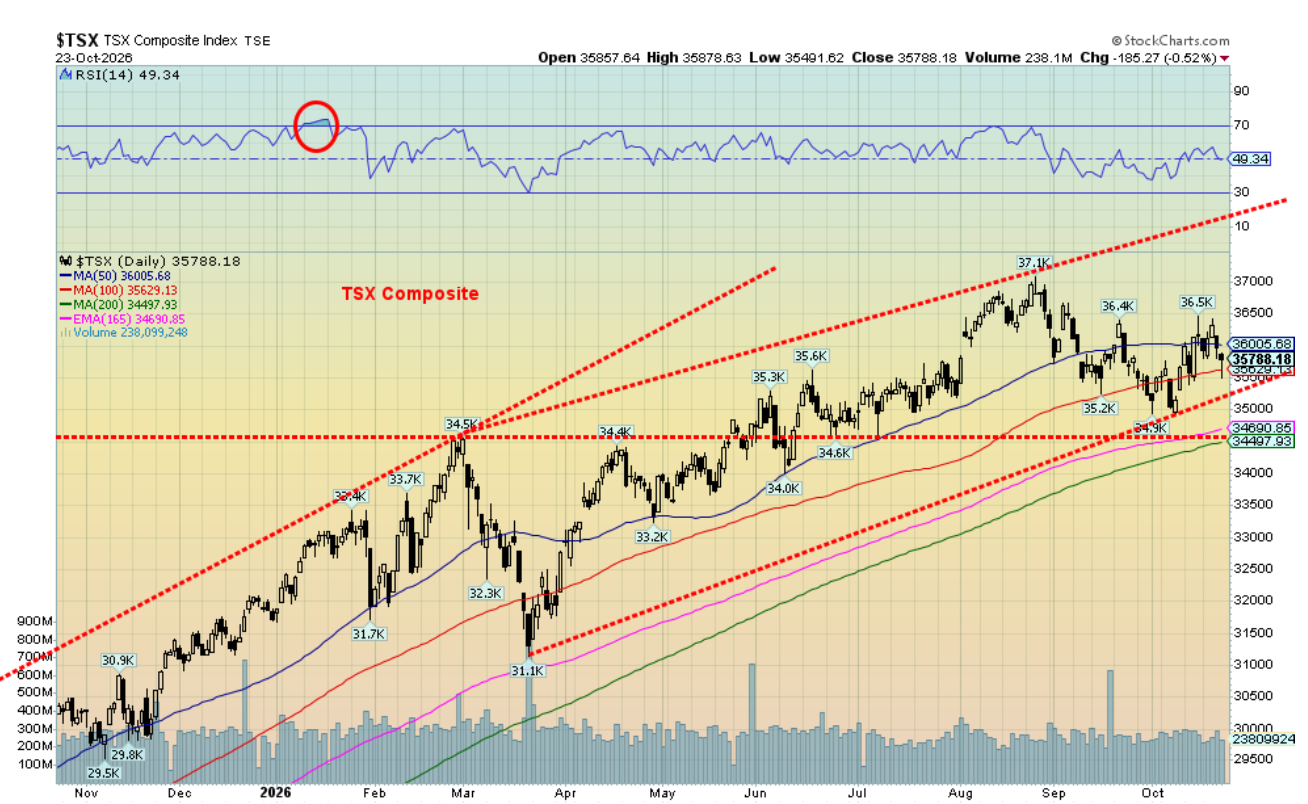
On the week, the S&P 500 fell 0.5% and the NASDAQ was down 0.7%. But the Dow Jones Industrials (DJI) is seeing some flight to safety as it rose 0.4%. The Dow Jones Transportations (DJT) was up 0.8%. The S&P 500 Equal Weight Index defied the weighted S&P 500, rising 1.1%. That tells us that while the big 10 and MAGS are faltering the rest of the market is hanging in or rising. The S&P 400 (Mid) fell 2.7%, but surprisingly the S&P 600 (Small) was up 1.7%. In Canada, the TSX Composite lost 1.1% while the TSX Venture Exchange (CDNX) continues to flounder, down 2.9%.
In the EU, it was negative all around. The London FTSE fell 1.9%, the EuroNext was down 1.6%, the Paris CAC 40 was off 2.2%, and the German DAX was down 1.7%. In Asia, China’s Shanghai Index (SSEC) fell 0.7%, the Tokyo Nikkei Dow (TKN) dropped 4.0%, Hong Kong’s Hang Seng (HSI) fell 4.5%, and India’s Nifty Fifty dropped 2.4%. Again, negative all around. Contagion?
Source: www.stockcharts.com
Stock markets increasingly look like they want to tip over. Yes, both the S&P 500 and the NASDAQ recently reached all-time highs, but it was barely on sharply reduced volume. The S&P 500 breaks down under 7,500 and could project down to 6,900. The NASDAQ breaks down under 25,000 and potentially projects down to 21,700. New highs would end thoughts of a breakdown.
Holding up is the DJI, but even the DJI remains down 4.5% from its all-time high. Friday’s sharp sell-off of over 600 points suggests the next move is down, not up. The DJI and the DJT continue to diverge, another bad sign.
The longer-term trends for the stock market remain up but are looking increasingly shaky. Given we appear to have made a high here in October, we harken back to 2018 when an October high was followed by a 20% drop into December. As well, the final high in 2007 came in October. What followed was a two-year bear market that saw the S&P 500 fall 57%. Beware a high in October.
The TSX Composite (chart next) continues in an uptrend, but it too looks wobbly. A break under 34,400 would end it. This past week eight of 14 sub-indices were up. Energy (TEN) made all-time highs. Of the losers, it was the materials (Gold (TGD), Metals (TGM), and Materials (TMT)) that were the big losers. All fell over 8.5%.
Source: Bonds
Source: www.tradingeconomics.com, www.home.treasury.gov, www.bankofcanada.ca
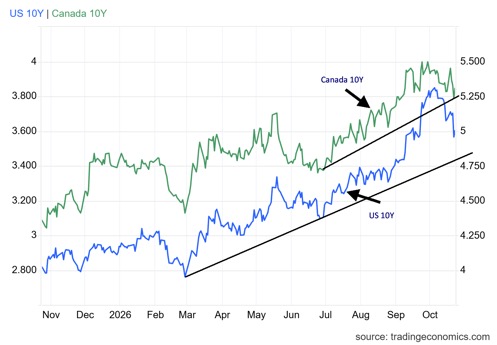
Bond yields fell this past week. That seems unusual, considering oil prices jumped higher again, which could translate into higher inflation. So why did bond yields fall instead? It’s due to capital flows from the EU to the U.S. Given the potential for a growing debt crisis in France and even the U.K., funds are flowing out of the EU, and they find a home in U.S. treasuries. U.S. treasuries are being bought over gold – at least, at the moment. They are considered safe because of the huge liquid U.S. bond market.
Also helping is the sheer size of the needs of the AI companies. A sell-off of the AI companies appears to be underway. No, there is currently no full-blown EU debt crisis. But one is building. Eurozone government spending to GDP is an astounding 49.8% and rising. In the U.S., it is 22.5%. For the record, Canada is at 17.2%. The EU has a debt problem. Investors are getting nervous.
This past week, the U.S. 10-year Treasury note fell to 5% from 5.09%. Canada was more modest and actually rose to 3.85% from 3.83%. Still-rising interest rates are a problem. The U.S. 10-year doesn’t break until under at least 4.75%. Canada is at support. Rising inflation pressures are more likely to keep upward pressure on U.S. bond yields. However, the current exit from the EU to the U.S. is definitely helping.
This week is interest rate week. Canada (BofC) reports in the AM October 28. The expectation is for a 25 bp hike. The Fed reports in the PM. The expectation is unchanged but there are many calling for a rate hike. Wednesday is a big day.
Gold and silver
Source: www.stockcharts.com
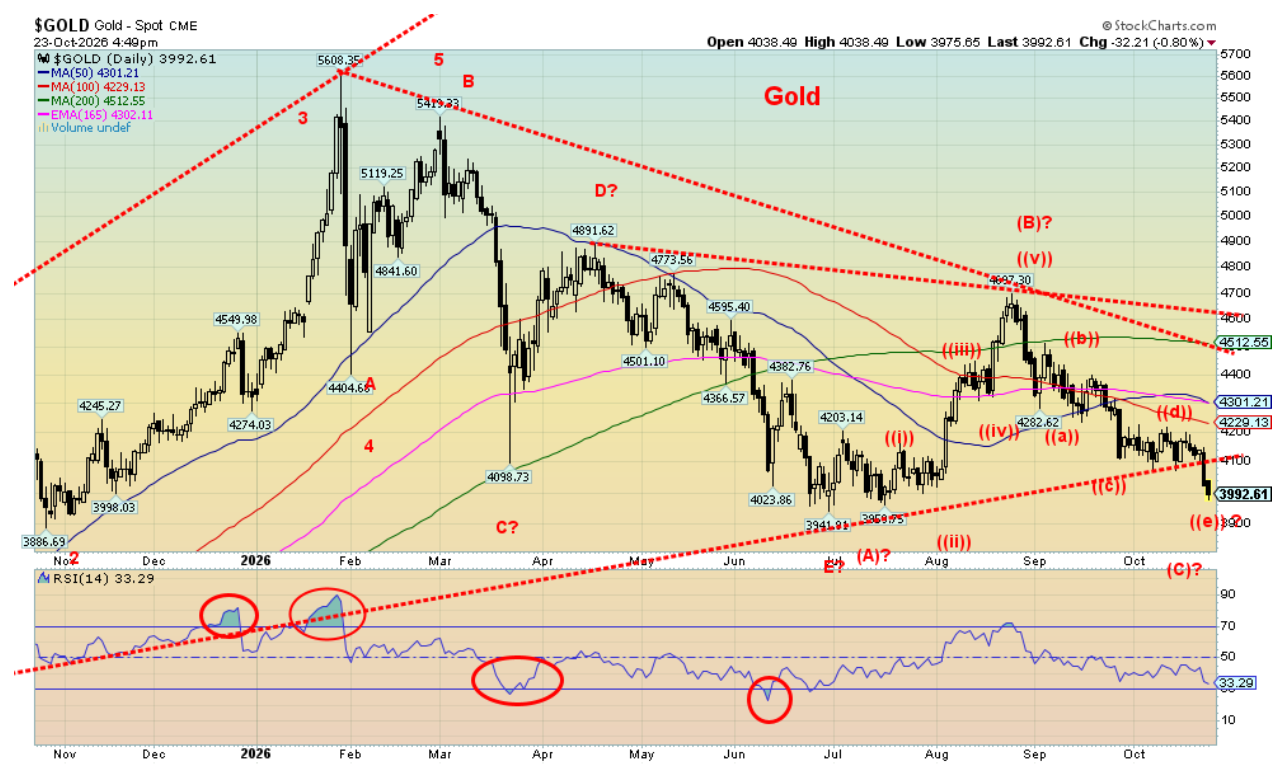
Misery, thy name is gold, silver, and the gold stocks. One would think that with everything going on – the geopolitical tensions, the domestic political tensions, and more – gold would be rising, not tumbling. But tumbling it is. Surging oil prices and rising inflation are hurting gold. The rush to U.S. dollars rather than gold is hurting gold. High interest rates are hurting gold as gold does not pay interest. Margin calls as AI stocks slump are hurting gold as gold stocks get thrown out and sales of gold and silver are needed to raise cash. The Fed is somewhat hawkish, and more interest-rate hikes could be in the offing.
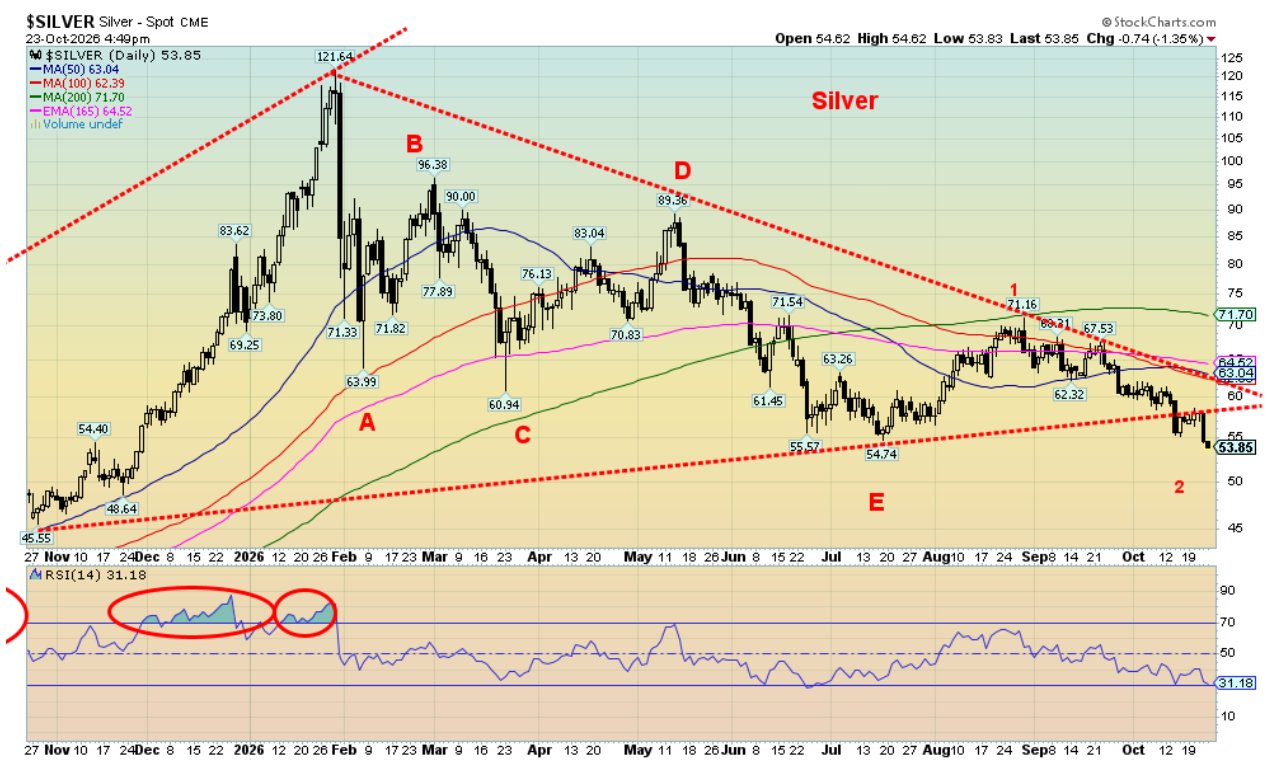
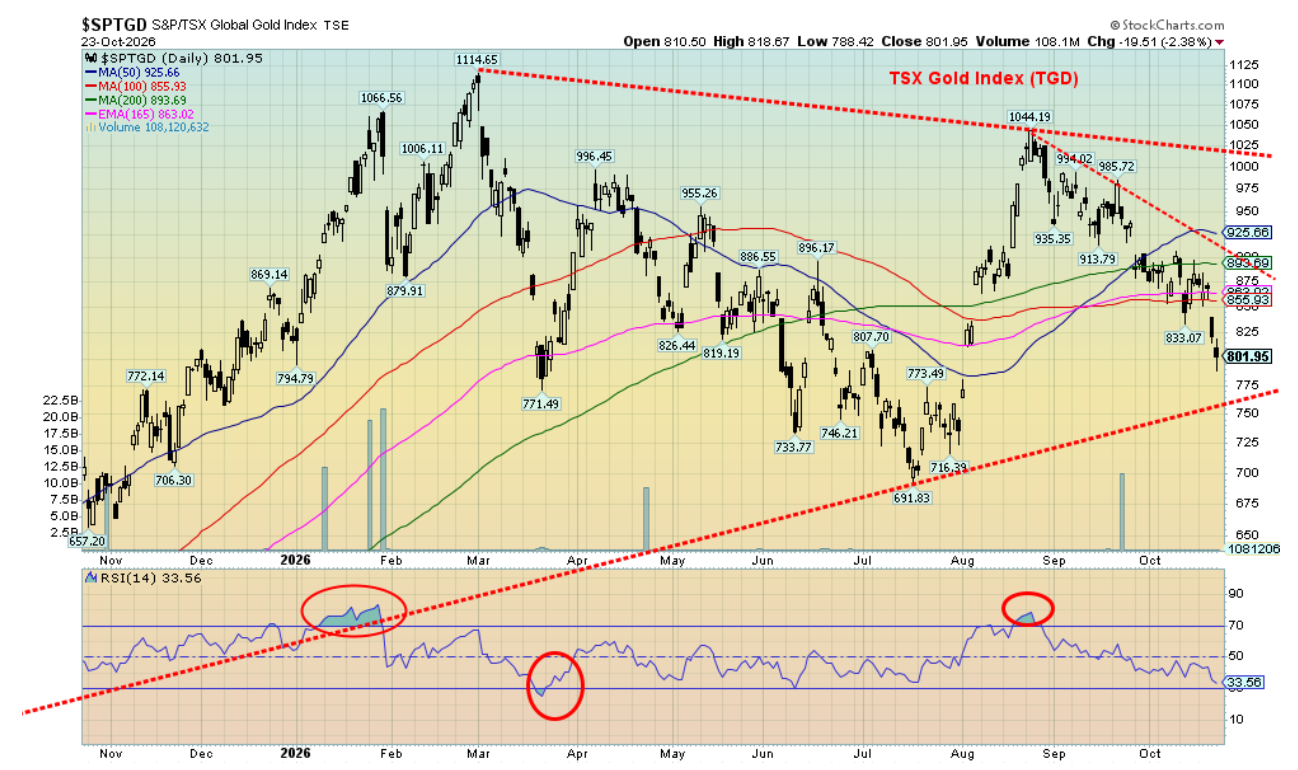
This past week gold fell 4.1%, silver dropped 5.4% and is now down 24% in 2026, and platinum dropped 5.3%. The near precious metals were no better as palladium hit 52-week lows, off 6.2%, and is down 35% in 2026, while copper was off a small 0.9%. The gold stocks were hit as the Gold Bugs Index (HUI) dropped 8.3% and the TSX Gold Index (TGD) fell 9.3%. After holding gains for part of 2026, both the HUI and the TGD are now down on the year 3.7% and 1.9% respectively.
But divergences are present, suggesting that we could be nearing a bottom. Silver made new lows for the move. Gold did not. Not yet anyway. The gold stocks (HUI, TGD) are nowhere near their recent 2026 lows. Despite the hit that gold is taking, we view these divergences as positive. As well, the current sell-off is seeing all reach oversold levels. No, oversold is not a panacea for higher prices, but it is a sign that the sell-off could be waning.
Source: www.stockcharts.com
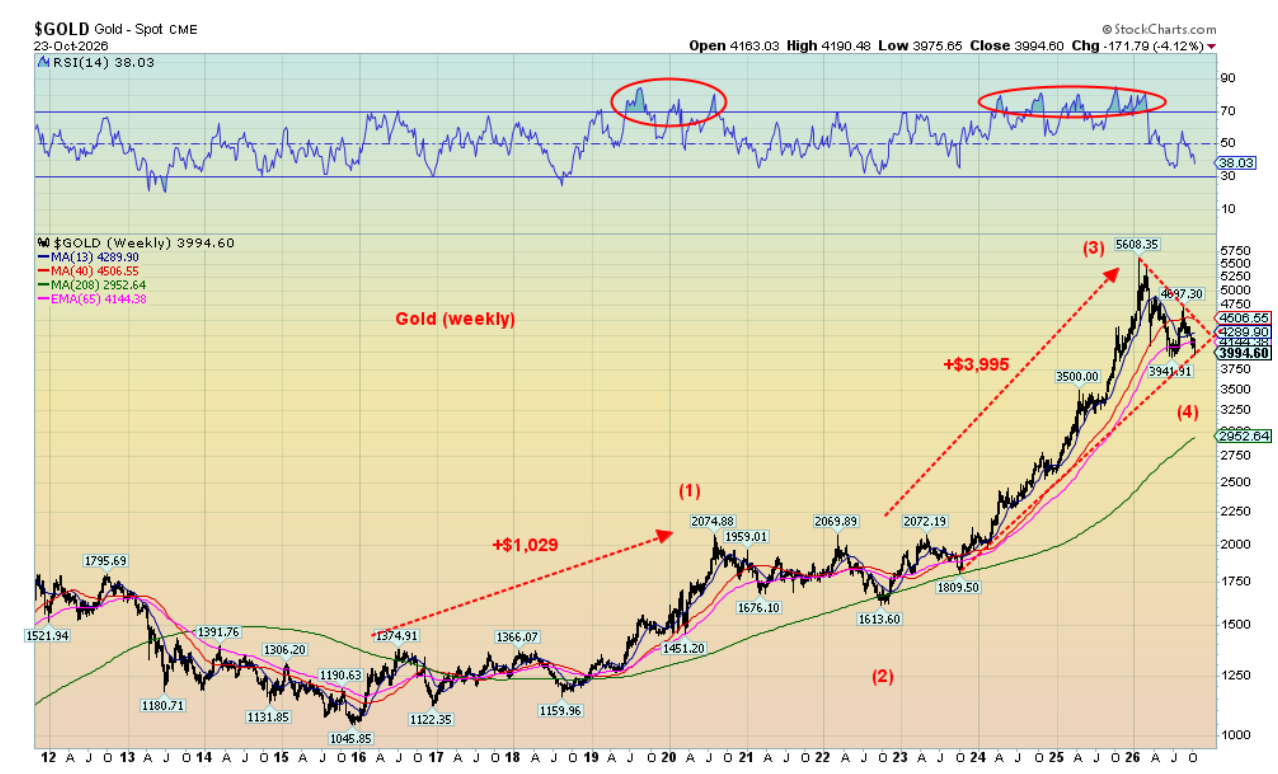
As we can see, both gold and silver broke below their trendlines. If we want to treat the pattern as a descending triangle, gold’s target could be $3,300 and silver $42. However, we view the current sell-off as a culmination of the steep correction (bear market) that started after the January 2026 high. We view this as a steep correction to the rally that started from the 2022 low near $1,613. A normal 38.2% correction is down to $4,082. For a 50% correction, it is $3,600.
Gold’s last major low was December 2015. A well-known 7.8-year cycle saw the next low in September 2022 exactly 7.8 years later. The next major cycle low would be due in 2030 with a range from late-2029 to mid-2031. We see this as a sharp wave 4 correction, up from the December 2015 low. A fifth wave is to come. Targets could be $6,500 to $7,700, although some are predicting even higher with $10,000 for gold mentioned numerous times.
First, however, we have to find the bottom of the current sell-off. The low may not yet be in and could come as late as December. To the upside, a break over $4,600 would be positive. But first we have to regain $4,300. Silver needs to break over $65, then $72 to suggest higher and confirm a low. Silver too appears to be making a wave 4 correction, up from a major low in 2020. If that’s correct, we could eventually see new highs above the January 2026 high of $121.64.
Source: www.stockcharts.com
The TGD closed the week at 802, well above its low of July 2026 at 692. As we noted, we view the strength in the gold stocks as a positive. Normally, when gold and silver are falling 25%, the stocks fall 50%. So far, the TGD is down only 38% at that July low and currently down only 28%. Gold is down 29% from its high and silver is down 56%. Through 900 and especially above 925 would be positive for the TGD.
Despite the steep correction, we remain positive on the sector. We are looking for a low in November. Seasonals are usually positive for gold starting in December to February/March. A catalyst might be the upcoming U.S. mid-terms where the potential for a contested, contentious election is high. Already, we are seeing the DOJ’s attempts to block the results of elections (Alaska). (https://www.nytimes.com/2026/10/23/us/politics/justice-dept-alaska-senate-race-sullivan.html)
Surprisingly the US$ Index has not jumped higher recently despite funds coming in from the EU. The US$ Index was flat this past week. There was no clear-cut winner from the other currencies. All are floundering. Purchasing power in all currencies is falling.
Source: www.stockcharts.com
Oil and gas
Source: www.stockcharts.com
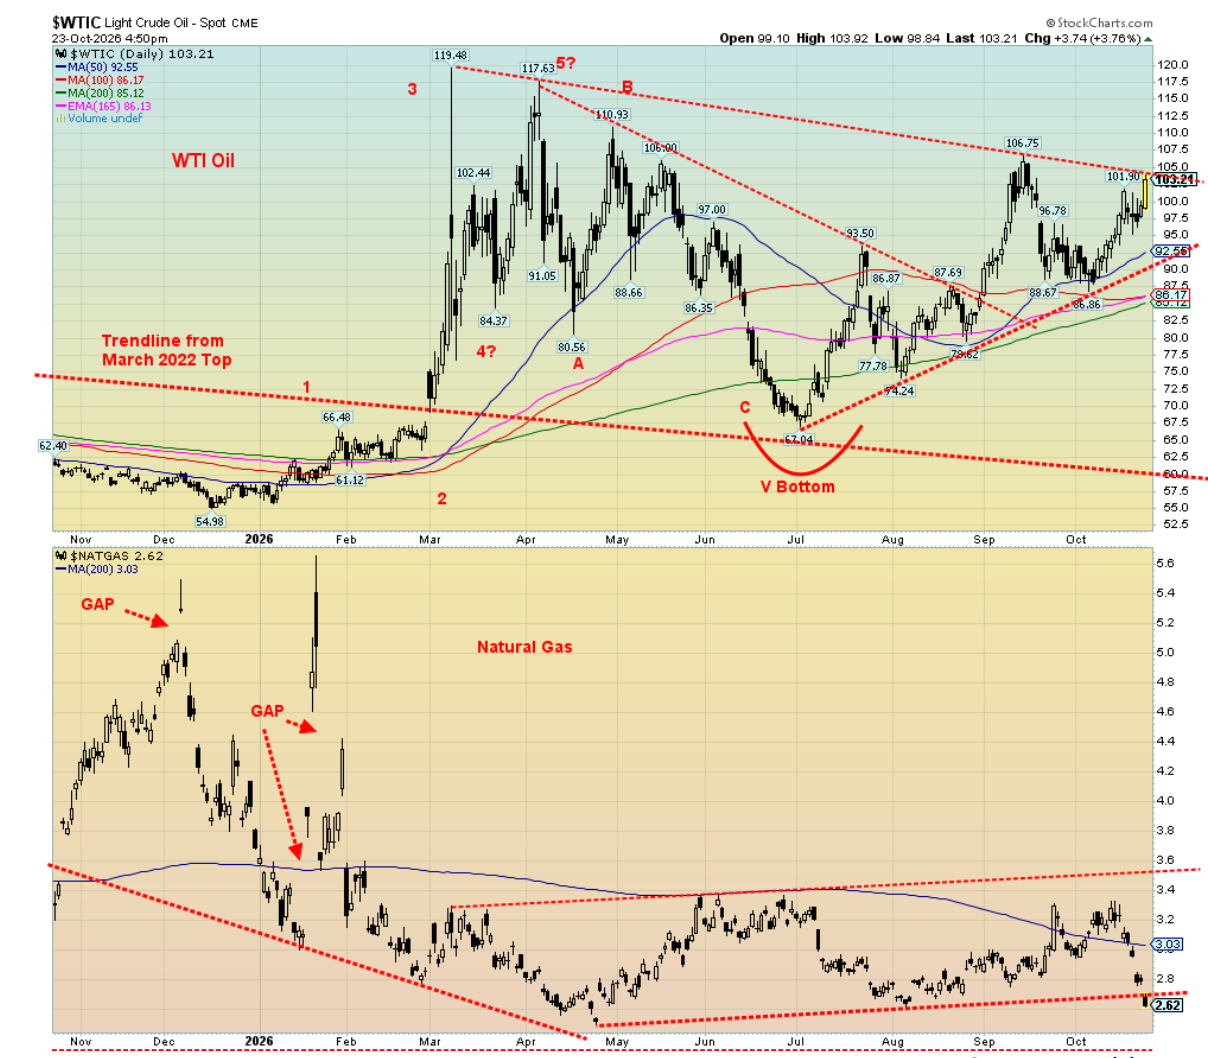
Oil prices are going higher and there is little in the way to stop them. The wars – U.S./Iran/Israel, Saudi Arabia/Houthis, Russia/Ukraine – are nowhere near being resolved and all could deepen. Yes, they ebb and flow, but unless a miracle happens and peace breaks out, the trend is only for them to worsen.
This past week, the conflict between Saudi Arabia and the Houthis helped push WTI oil up 1.7% to over $100.
Further bombing of ships in the Strait of Hormuz also helped with higher prices. President Trump continues to threaten Iran with Armageddon after the mid-terms. Brent crude was up 6.7%, is closing in on $120, and made 52-week highs. WTI closed at $103 and once through $105, if it holds, targets are up to $135/$150.
Natural gas (NG) is another area seeing rising prices – at least in Europe as NG at the Dutch Hub leaped 5.4% to close over $93. Again, Persian Gulf disruptions and signs the U.S. is preparing another assault on Iran helped push the price. Both Europe and Asia get their NG (and oil) predominantly from the Gulf region. The EU has low supplies as they head into winter. At 74.6%, supplies are the lowest since 2009.
While it may seem bizarre, NG at the Henry Hub (North America) actually saw prices fall 15.7% this past week as forecasts of warm weather hit. Supplies rose this past week, even though they remain below long-term averages. For oil, reserves remain well below long-term averages and are trending along five-year lows.
All of this is music for the energy stocks as both the TSX Energy Index (TEN) and the ARCA Oil & Gas Index (XOI) made all-time highs again this past week. The XOI, however, fell 0.5% on the week while the TEN gained 0.6%. Energy stocks remain a buy.
Russian diesel made its way to the U.S. this past week. Further deliveries are expected into November. Nonetheless, rising energy prices are a nightmare as some describe it for President Trump heading into the mid-terms. High energy prices are here to stay, and the expectation is we are going higher.
Copyright David Chapman 2026
GLOSSARY
Trends
Daily – Short-term trend (For swing traders)
Weekly – Intermediate-term trend (For long-term trend followers)
Monthly – Long-term secular trend (For long-term trend followers)
Up – The trend is up.
Down – The trend is down
Neutral – Indicators are mostly neutral. A trend change might be in the offing.
Weak – The trend is still up or down but it is weakening. It is also a sign that the trend might change.
Topping – Indicators are suggesting that while the trend remains up there are considerable signs that suggest that the market is topping.
Bottoming – Indicators are suggesting that while the trend is down there are considerable signs that suggest that the market is bottoming.
Disclaimer
David Chapman is not a registered advisory service and is not an exempt market dealer (EMD) nor a licensed financial advisor. He does not and cannot give individualised market advice. David Chapman has worked in the financial industry for over 40 years including large financial corporations, banks, and investment dealers. The information in this newsletter is intended only for informational and educational purposes. It should not be construed as an offer, a solicitation of an offer or sale of any security. Every effort is made to provide accurate and complete information. However, we cannot guarantee that there will be no errors. We make no claims, promises or guarantees about the accuracy, completeness, or adequacy of the contents of this commentary and expressly disclaim liability for errors and omissions in the contents of this commentary. David Chapman will always use his best efforts to ensure the accuracy and timeliness of all information. The reader assumes all risk when trading in securities and David Chapman advises consulting a licensed professional financial advisor or portfolio manager such as Enriched Investing Incorporated before proceeding with any trade or idea presented in this newsletter. David Chapman may own shares in companies mentioned in this newsletter. Before making an investment, prospective investors should review each security’s offering documents which summarize the objectives, fees, expenses and associated risks. Although Artificial Intelligence (AI) may be deployed from time to time, AI output is monitored and adjusted, if necessary, for accuracy. David Chapman shares his ideas and opinions for informational and educational purposes only and expects the reader to perform due diligence before considering a position in any security. That includes consulting with your own licensed professional financial advisor such as Enriched Investing Incorporated. Performance is not guaranteed, values change frequently, and past performance may not be repeated.
About the author


Website: https://www.enrichedinvesting.com
Disclaimer: David Chapman is not a registered advisory service and is not an exempt market dealer (EMD) nor a licensed financial advisor. We do not and cannot give individualised market advice. David Chapman has worked in the financial industry for over 40 years including large financial corporations, banks, and investment dealers. The information in this newsletter is intended only for informational and educational purposes. It should not be considered a solicitation of an offer or sale of any security. The reader assumes all risk when trading in securities and David Chapman advises consulting a licensed professional financial advisor before proceeding with any trade or idea presented in this newsletter. David Chapman may own shares in companies mentioned in this newsletter. We share our ideas and opinions for informational and educational purposes only and expect the reader to perform due diligence before considering a position in any security. That includes consulting with your own licensed professional financial advisor.