
Inflation continues to raise its head. Result, Fed Chair Kevin Warsh is caught between a rock and a hard place going into the October 27-28 FOMC meeting. Odds have jumped for a rate hike but Warsh is trying to dampen expectations. Bonds reacted positively to this and rallied last week. Stocks wobbled and an AI sell-off may be underway. The MAG7 had a rocky week. But elsewhere other stocks held together as the S&P 500 Equal Weight Index was up this past week but the S&P 500 itself was down.
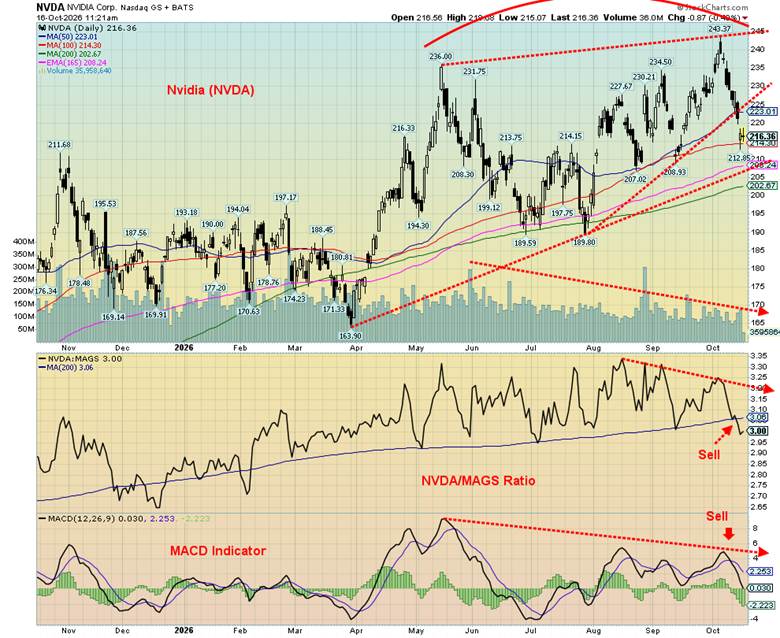
Given the high tech/AI sell-off we focused on Nvidia as the chart of the week below. Nvidia has been the big leader of the AI rally. But is it now showing signs of crumbling? The AI companies have an insatiable demand for money to build data centers. But they are facing opposition and their money demands threaten to crowd out others.
Gold continues to wobble but is holding up. We are seeing some positive signs that if correct could lead to the start of another upleg for the precious metals sector. Central banks continue to add to their gold holdings while shunning U.S. treasuries.
But the big story may still be in the energy market as the wars—Russia/Ukraine, U.S./Iran, and Saudi Arabia/Houthis—take their toll. Oil leaped this past week with WTI oil ending the week over $100. This benefits, for example, Whitecap Resources Inc., that reported higher net income and greater funds flow, pays a dividend, and is held in the Enriched Capital Conservative Growth Strategy.* The U.S. is creating tension with its seeming coziness toward Russia for diesel fuel (a mere pittance) and easing sanctions. At the other end Trump is trying to get Ukraine's Zelensky to cave in.
The U.S. elections are now fast approaching and we continue to see stories suggesting the results and the reaction to it may not be what everyone expects.
This week brings Canada's inflation numbers.
There has been a bit of a chill in the air. Maybe its a sign of the times.
Have a great week.
DC
* Reference to the Enriched Capital Conservative Growth Strategy and its investments, celebrating an 8.67 - year history of 195% growth (annual 13.31%) to September 30, strong alpha and ranking amongst the top at www.emergingmanagers.ca, is added by Margaret Samuel, President, CEO and Portfolio Manager of Enriched Investing Incorporated, who can be reached at 416-203-3028 or msamuel@enrichedinvesting.com This information should not be construed as an offer, or a solicitation of an offer or sale of any security. Past performance does not guarantee future returns.
“When a nation is over-reliant on one or two commodities like oil or precious minerals, corrupt government ministers and their dodgy associates hoard profits and taxes instead of properly allocating them to schools and hospitals.”
—Bono, full-name Paul David Hewson, known by nickname Bono, Irish singer-songwriter and activist, founding member and lead vocalist of rock band U2; b. 1960
“Our dependence on oil and natural gas won't vanish overnight, but America's energy future will shine brighter if we continue to develop wind, solar, nuclear, geothermal, biofuel, hydropower and other clean alternatives and give ourselves time to transition.”
—Nancy Mace, American politician, member Republican Party, has represented South Carolina 1st District since 2021; b. 1977
“Today, we have our own concentrations of economic power. Instead of Standard Oil, U.S. Steel, the Union Pacific Railroad, and J. P. Morgan and Company, we have Amazon, Google, Apple, Facebook, and Microsoft.”
—George Packer, American journalist, novelist, playwright, writes about foreign policy in The New Yorker and The Atlantic, author of The Assassins’ Gate: America in Iraq (2005), plus others; b. 1960
The U.S. is in a pickle. The world is in a pickle. U.S. inflation has raised its head once again. And that’s troublesome. How troublesome? Well, the September Consumer Price Index (CPI) inflation came in at 3.7% year-over-year (y-o-y). Is that bad? Well, the long-term average for the past 100 years (1914–2026) is 3.3%. In June 1920, U.S. inflation hit its highest level over the past century at 23.7%. And talk about inflation. The German Weimar Republic peaked at 29,500% in October 1923. Peanuts. Zimbabwe peaked at – get this – 79.6 billion % in November 2008. Famously, Zimbabwe issued a 100-trillion dollar note. The Weimar Republic used wheelbarrows to deliver money, while Zimbabwe used dump trucks. It was cheaper to burn money than buy logs to stay warm.
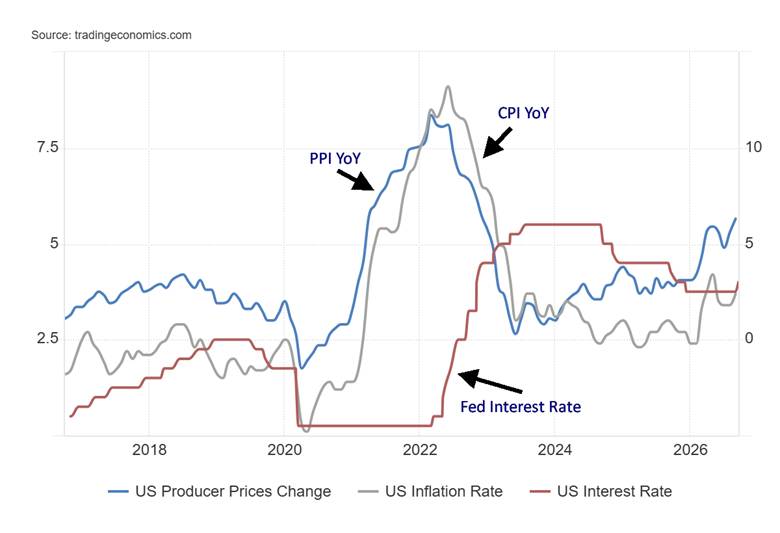
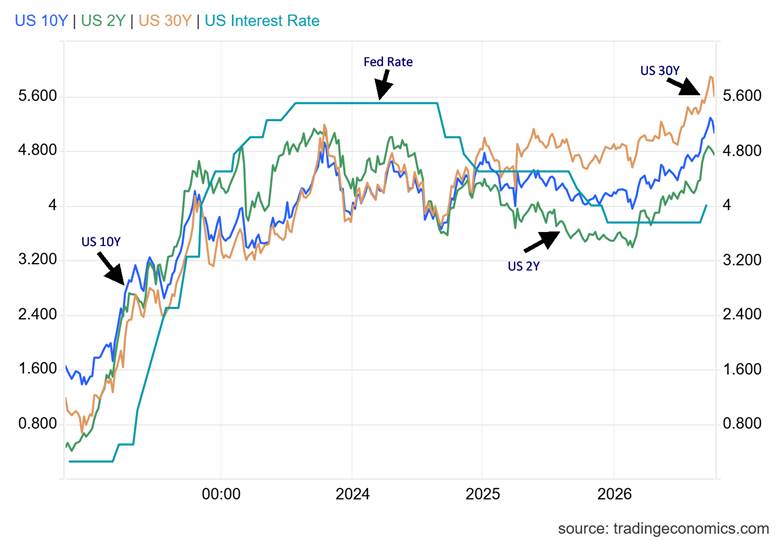
The Fed target is 2%. So, oops! We’re not there yet. At 3.7%, that’s a mere 18 bp below the effective Fed funds rate. The Fed target range is 3.75%–4.00%. The U.S. 10-year note was last at 5.09%, 139 bp higher, the 2-year note at 4.76%, 106 bp higher, and the 30-year at 5.43%, 173 bp higher. Even the 3-month Treasury bill at 4.20% remains 70 bp higher. We have a positive real interest rate. Not negative real interest rates as we experienced for much of the time after the 2008 financial crisis through to the 2020 pandemic. The sharp rise in inflation following the pandemic changed that metric.
But today’s inflation puts the Fed in a pickle. The market expected the September inflation to come in at 3.6% and the August rate was 3.4%. The Producer Price Index (PPI) inflation also disappointed, coming in at 6.3%, above the expected 5.3% and August’s 5.6%. The PPI tends to be a predictor of future inflation. Does the U.S. have an inflation problem? The Fed meets on October 27–28. The odds of the Fed hiking another 25 bp have jumped to 50%. Of course, any hike in interest rates would incur the wrath of Trump who wants lower interest rates. Trump believes they can inflate the debt problem away.
CPI Inflation, PPI Inflation, Fed Rate 2016–2026
Source: www.tradingeconomics.com, www.bls.gov, www.federalreserve.gov
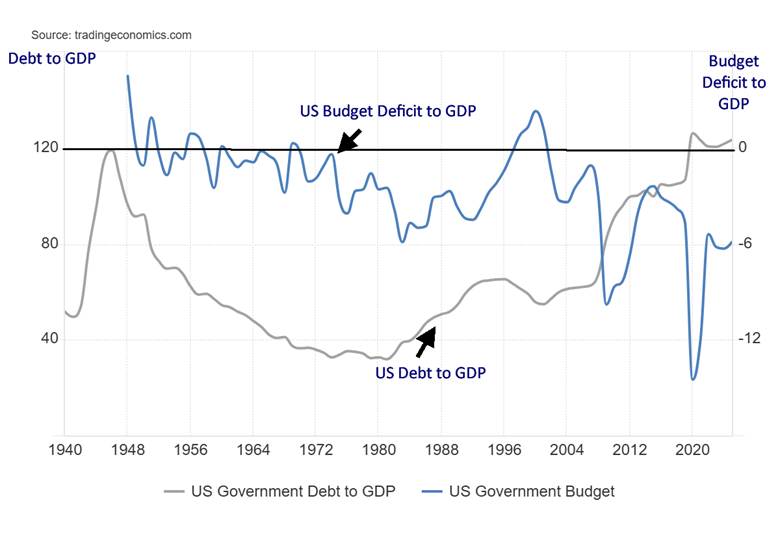
What has probably surprised many is that, despite the higher than expected inflation rate, bonds actually rallied. Why? Bonds tend to rally when the stock market falls. But the question was asked by The Economist: “Will bonds blow up?” (The Economist, October 10–16, 2026). The premise is that rising debts driven by rising spending for an ageing population, plus the ongoing wars (never-ending?) push deficits higher with no corresponding cuts in spending. The U.S. leads the pack with the highest budget deficit to GDP of any G7 country at 6.5%. Looking at the economic and financial indicators provided by The Economist each week, only Brazil at 7.3%, Colombia also at 7.3%, and Saudi Arabia at 7.2% are higher. However, as we have previously noted, all the G7 countries have high-budget deficits to GDP with Japan the lowest at 1.8%.
US 10-Year, 2-Year, 30-Year, Fed Rate 2021–2026
Source: www.tradingeconomics.com, www.federalreserve.gov
With interest rates at least easing as the stock market wobbles, where is the selling occurring? AI stocks led the market up. Will they lead the market down? Amazon, Google, and Nvidia are already in correction territory. Tesla is in a bear market. The others, including MAGS (the MAG7 ETF), are barely off their highs. AI stocks remain the talk of the town. Banks, the rock of the financial system, are struggling. Bank of America (BAC), Goldman Sacs (GS), and Morgan Stanley (MS) are in bear markets. Yet the S&P 500 holds up, down just over 1% from its all-time high. Two sectors performing better are Consumer Staples and Health Care. We look elsewhere and we see EU exchanges coming off their highs as well as the major Asian stock indices. In Canada, the TSX Venture Exchange (CDNX) is in a bear market. As to gold? Meh.
As to the economy, job creation is struggling as noted by the recent nonfarm payrolls and consumer confidence is sinking, but other areas such as the manufacturing indices and profits remain firm. The weekly jobless claims remain low.
But as they say, it’s the debt and the U.S. is insatiable in adding to the debt. But so is everyone else to different degrees. Could the U.S. have a debt crisis? The U.S. dollar is the world’s reserve currency and that gives the U.S. an advantage no other country has. If there is a danger zone, it’s the EU led by France and followed by the U.K. Both have budget deficits to GDP over 5%, and both have debt to GDP levels over 100%. Both have ageing populations and neither the pound sterling nor the euro are the world’s reserve currency. The U.K. has the highest interest rate levels while French interest rates have been rising as the spread between France and Germany (which has the best credit) widens. France is gripped in riots potentially sparking an economic crisis.
US Debt to GDP, US Budget Deficit to GDP 1940–2026
Source: www.tradingeconomics.com, www.home.treasury.gov, www.whitehouse.gov
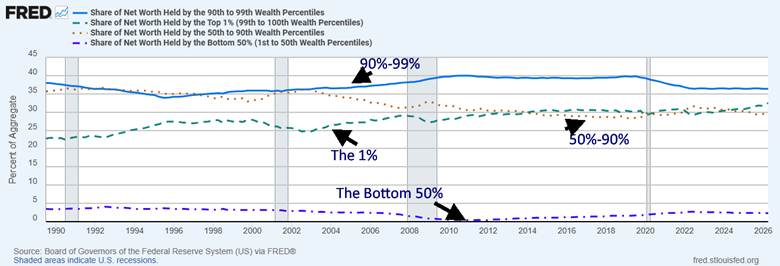
Continuing to be a problem, particularly in the U.S., is the growing wealth disparity. The 1% in the U.S. hold some 32.5% of assets. The 90–99th percentile hold 36.4%, so the top 10% hold an astounding 68.9% of all wealth. The bottom 50% hold a paltry 2.3%. In the U.S., the wealth of the 1% surpasses the peak of the Gilded Age of the late 19th–early 20th century. According to the latest at Forbes World’s Billionaires list, one man, Elon Musk, has a net worth of $920 billion, making Musk the 23rd largest economy in the world. That’s also about 3% of the U.S. GDP. Five other U.S. billionaires have a net worth over $200 billion.
Notably it is not just wealth that divides it is also income. The share of income for the 1% has been steadily rising since the early 1980’s. It’s now at levels last see during the “Roaring Twenties”. At the other end labour’s share has been falling. See article from Paul Krugman titled - AI, Rising Inequality and Rising Oligarchy https://paulkrugman.substack.com/p/ai-rising-inequality-and-rising-oligarchy.
Share of Net Worth Held By – 1990–2026
Source: www.stlouisfed.org
The U.S.’s Gini coefficient, a measurement of income inequality (100 is absolute inequality, while 0 is absolute equality) had the U.S. last reported at 41.8 (2023). It could well be higher today. That put the U.S. ranking in the top 20% in the world, along with Latin American countries and African dictatorships. No G7 country is close to the U.S., with the next one being Italy at 34.3. Both China (26) and Russia (33) have a lower Gini coefficient than the U.S.
Inflation is most likely headed higher. Tariffs and war will do that to you. The rich get richer. As for everyone else? Meh! Kevin Warsh is in a pickle. What does he do at the October 27–28 FOMC? According to the market, the odds are rising that the Fed will hike. Warsh is indicating “hold.” Trump will claim inflation is falling.
Chart of the week
Source: www.stockcharts.com
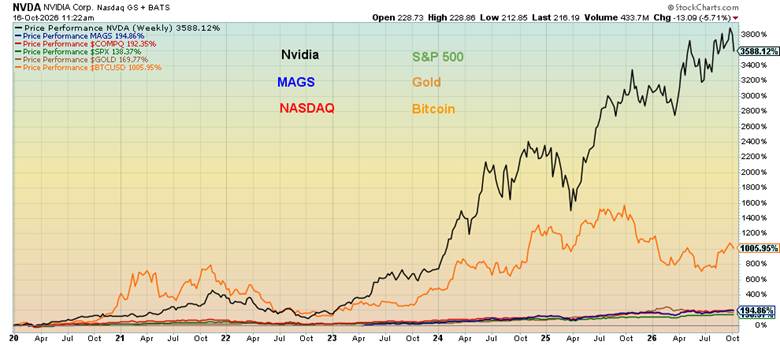
We thought we’d have another look at Nvidia (NVDA). It’s the key bellwether stock for AI (Artificial Intelligence) stock, the broader technology-driven market, and for the stock market itself. Like an old saying, “If it’s good for Nvidia, it’s good for everyone.” Quite simply, since the start of 2020 and the pandemic, Nvidia has outperformed anybody in its way. Yes, Nvidia has outperformed its MAG7 brethren. We didn’t include the other six in the performance chart that follows, but, given the performance of MAGS, the ETF that represents the MAG7, a return of 3,588% vs. a return of 195% for MAGS outpaces the pack.
Nvidia has outperformed everyone – the NASDAQ, the S&P 500, gold, Bitcoin, you name it. It drags everyone up with it. Okay, not gold or Bitcoin. Nvidia and Bitcoin stand out on the chart, given Nvidia is the best performer by far, but a distant second is Bitcoin (+1,006%). Then there are the rest, all bunched together. MAGS is up 195%, the NASDAQ +192%, the S&P 500 +138%, and gold up 170%. The question, of course, is where everyone else would be without Nvidia. Nvidia makes up over 20% of the MAG7 by market cap. Nvidia’s market cap is $5.4 trillion. If they were a country, they’d rank fourth, barely behind Germany. They are so big in their industry they have upwards of 90% of the data centre AI chip market.
Source: www.stockcharts.com
They are also hugely profitable. Based on net profit margin, Nvidia ranks as number one. They are number two behind Google for earnings. They are ranked anywhere from hold, to buy, to strong buy by many analysts. They pay a small dividend of $1, equal to a yield of 0.45%. So, what’s the issue? From a technical perspective, we look at things differently. What we see is that Nvidia spiked to a new all-time high in October but was only 3% above the May high. We notice that the recent run-up to new highs was on reduced volume. Not a positive sign. That suggests falling momentum. We also see what appears to be the formation of a wedge triangle. Wedge triangles are normally bearish. If that’s correct, then we are now breaking down from the triangle. Targets could be down to at least $190. No, it doesn’t tell us when it will break, but under $210 would most likely break things further.
We can see that for the most part Nvidia has been rising with regard to its ratio with the MAG7 ETF MAGS into that October high. But now MAGS is outperforming. The ratio is breaking down under the 200-day MA. Also, we see a divergence between rising highs for Nvidia and falling peaks for the NVDA/MAGS ratio. The MACD (Moving Average Convergence Divergence) average is giving a sell signal. Again, as Nvidia made new highs, the MACD indicator highs were lower. Another divergence.
The next support level is close at $210. A break of $210 would be a sell signal. Then under $208 things get dicier. Nvidia has been the leader on the way up. Will it still lead on the way down? Nvidia is now down 11% from its all-time high. Correction territory. The bigger they are, the harder they fall!
Markets and Trends
|
Market |
Close Dec. 31/25 |
Close Oct. 16/26 |
Week |
YTD |
Daily (Short Term) |
Weekly (Intermediate) |
Monthly (Long Term) |
|
S&P 500 |
6,845.50 |
7,659.44 |
(2.0)% |
11.9% |
up (weak) |
up |
up |
|
Dow Jones Industrials |
48,063.29 |
51,002.41 |
0.7% |
8.2% |
neutral |
up |
up |
|
Dow Jones Transport |
17,357.19 |
19,879.83 |
0.4% |
14.5% |
neutral |
neutral |
up |
|
NASDAQ |
23,241.99 |
26,140.03 |
(4.5)% |
12.5% |
down (weak) |
up |
up |
|
S&P/TSX Composite |
31,712.76 |
36,176.55 |
1.4% |
14.1% |
up |
up |
up |
|
S&P/TSX Venture (CDNX) |
987.74 |
845.30 |
(3.3)% |
(14.4)% |
down |
down |
up |
|
S&P 600 (small) |
1,467.76 |
1,653.50 |
(1.2)% |
12.7% |
down |
neutral |
up |
|
ACWX MSCI World x US |
67.18 |
74.21 |
(1.7)% |
10.5% |
down |
up (weak) |
up |
|
Bitcoin |
87,576.98 |
81,581.15 |
(0.9)% |
(6.9)% |
neutral |
up |
up (weak) |
|
Gold Mining Stock Indices |
|
|
|
|
|
|
|
|
Gold Bugs Index (HUI) |
701.49 |
737.19 |
(1.8)% |
5.1% |
down |
down (weak) |
up |
|
TSX Gold Index (TGD) |
817.76 |
883.23 |
(2.0)% |
8.0% |
down |
neutral |
up |
|
Bonds |
|
|
|
|
|
|
|
|
U.S. 10-Year Treasury Bond yield |
4.17% |
5.09% |
(3.1)% |
22.1% |
|
|
|
|
Cdn. 10-Year Bond CGB yield |
3.44% |
3.83% |
(1.3)% |
11.3% |
|
|
|
|
Recession Watch Spreads |
|
|
|
|
|
|
|
|
U.S. 2-year 10-year Treasury spread |
0.69% |
0.36% |
(20.0)% |
(47.8)% |
|
|
|
|
Cdn 2-year 10-year CGB spread |
0.85% |
0.57% |
(17.4)% |
(32.9)% |
|
|
|
|
Currencies |
|
|
|
|
|
|
|
|
US$ Index |
98.26 |
101.78 (new highs) |
(0.4)% |
3.6% |
up |
up |
neutral |
|
Canadian $ |
72.87 |
70.70 |
0.8% |
(3.0)% |
down |
down |
down |
|
Euro |
117.48 |
112.39 |
0.3% |
(4.3)% |
down |
down |
neutral |
|
Swiss Franc |
126.21 |
121.40 |
0.8% |
(3.8)% |
neutral |
down |
neutral |
|
British Pound |
134.78 |
133.29 |
0.7% |
(1.1)% |
neutral |
down |
up (weak) |
|
Japanese Yen |
63.83 |
63.30 |
0.2% |
(0.8)% |
down (weak) |
neutral |
down |
|
Precious Metals |
|
|
|
|
|
|
|
|
Gold |
4,311.97 |
4,167.02 |
(0.7)% |
(3.4)% |
down |
down |
up |
|
Silver |
71.16 |
56.99 |
(6.2)% |
(19.9)% |
down |
down |
up |
|
Platinum |
2,046.90 |
1,642.40 |
(3.1)% |
(19.8)% |
down |
down |
up |
|
Base Metals |
|
|
|
|
|
|
|
|
Palladium |
1,619.50 |
1,114.50 |
(3.0)% |
(31.2)% |
down |
down |
neutral |
|
Copper |
5.64 |
6.52 |
(2.1)% |
15.6% |
neutral |
up |
up |
|
Energy |
|
|
|
|
|
|
|
|
WTI Oil |
57.44 |
101.71 |
11.0% |
77.1% |
up |
up |
up |
|
Nat Gas |
3.71 |
3.12 |
(2.5)% |
(15.9)% |
up |
up (weak) |
neutral |
Source: www.stockcharts.com
* New All-Time Highs
Note: for an explanation of the trends, refer to the glossary at the end of this article.
New highs/lows refer to new 52-week highs/lows and, in some cases, all-time highs.
Stocks
Source: www.stockcharts.com
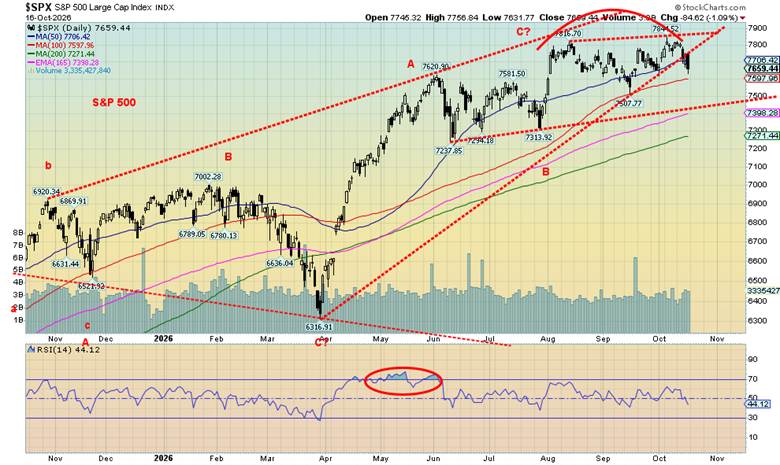
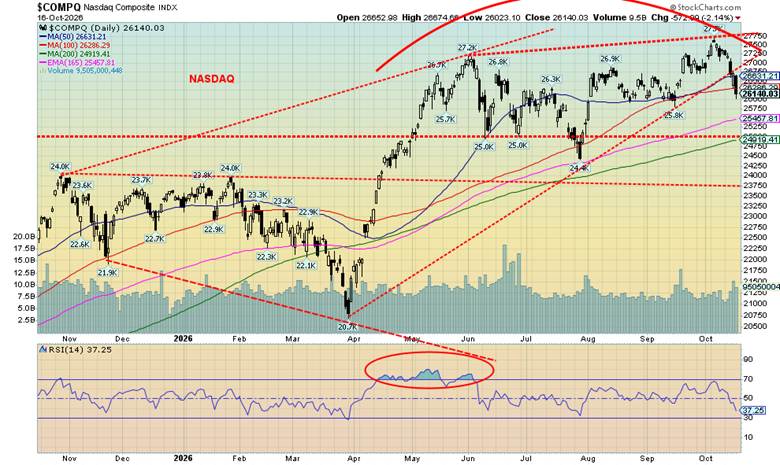
Is the party really over this time? The MAG7 wobbled this past week, resulting in losses for the S&P 500, down 2%, and the NASDAQ, off 4.5%. But the blue chips rebounded as the Dow Jones Industrials (DJI) was up 0.7%. The Dow Jones Transportations (DJT) rebounded too, up 0.4%. But it was the tech sell-off that caught our attention. The NY FANG Index fell 5.2%. Notably, the S&P 500 Equal Weight Index rose 0.5%. Weighted index down, everyone weighted the same up. It tells us that while the AI/high-tech stocks suffered, the rest of the market wasn’t bad. Better performing sectors include Health Care and Consumer Staples. Fears of how to finance the insatiable demands of AI stocks plus the higher than expected CPI and PPI rattled the market.
Speaking of AI financing, a company called CoreWeave (CRWV) saw its bonds fall sharply and its 5-year CDS (credit default swap) spreads explode over financing and credit risk. Its stocks fell 25.2%. CoreWeave is a cloud computing company that rents out clusters of high-performance Nvidia graphics processing units and AI infrastructure to AI labs in enterprise companies like OpenAI, Microsoft, and Meta. No it’s not the biggest or the best known but its fall could an ominous forecast.
The MAG7? Not so magnificent as six of the seven were down on the week. MAGS, the MAG7 ETF, lost 3.4%. The big losers were Tesla, down 7.3%, followed by Nvidia, featured in our chart of the week, down 6.6%. Only Apple rose, up 2.1%. Apple also made an all-time high. So did Microsoft, but then it turned tail and closed down 1.1%. There were some significant double-digit losses, including Micron, down 14.6%, Advanced Micro (AMD), off 13.1%, and Palantir, down 11.0%. Oh, and for Donald Trump lovers, Trump Media (DJT), fell 13.8% to new all-time lows.
The S&P 500 broke trendline support and the 50-day MA. Some support at 7,600 but under 7,500 a bigger breakdown could be underway. The NASDAQ gives off a sell signal under 25,800 but the big support is 25,000.
Once that goes, a more prolonged drop could get underway. Naturally, the caveat is new highs for both indices. However, that doesn’t seem likely right now. That 2018 top was early October and after that the S&P 500 fell 20% into December.
Source: www.stockcharts.com
Other indices fell as well. The S&P 400 (Mid) dropped 1.5% and the S&P 600 (Small) was off 1.2%. Even the vaunted Russell indices fell with the 1000 down 2.0%, the 2000 down 3.1%, and the 3000 off 2.1%.
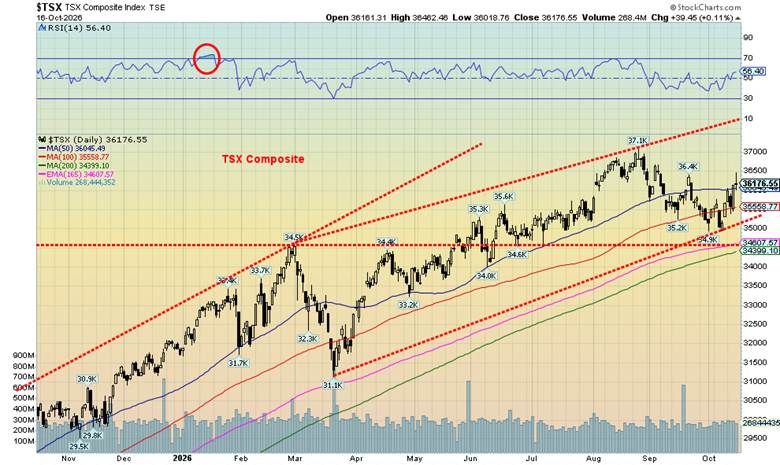
Over in Canada, the TSX rose 1.1%. Nine of the 14 sub-indices were up, five down. It was the Materials (Gold, Metals, Materials) that fell, while interest-sensitive stocks (Income Trusts, Real Estate, Telecommunications, Utilities) all rose. The big winner was Energy (TEN), up 6.3% to new all-time highs. Consumer Staples led the way, up almost 8.0%. The junior TSX Venture Exchange (CDNX) didn’t fare so well, falling 3.3%. The TSX hit resistance this past week near the 50-day MA. The major breakdowns gets underway under 35,250 and more so under 34,000.
In the EU, the London FTSE rose 3.0%, the EuroNext was up 0.8%, the Paris CAC 40 gained 2.0%, while the German DAX was up 2.1%. Despite France being the sick man of the EU, the region’s stock markets fared well. In Asia, China’s Shanghai Index (SSEC) fell 2.6%, the Tokyo Nikkei Dow (TKN) fell 5.4%, Hong Kong’s Hang Seng (HSI) was off a small 0.1%, and India’s Nifty Fifty rose 2.8%.
However, the big story of the week was the sudden down sweep of the AI stocks. No wonder we query as to whether the party is over. Naturally, we want to see follow-through this coming week. That will help convince us that a sell-off could be underway. It’s overdue. Negative signs have been building for weeks.
Source: www.stockcharts.com
Bonds
Source: www.tradingeconomics.com, www.home.treasury.gov, www.bankofcanada.ca
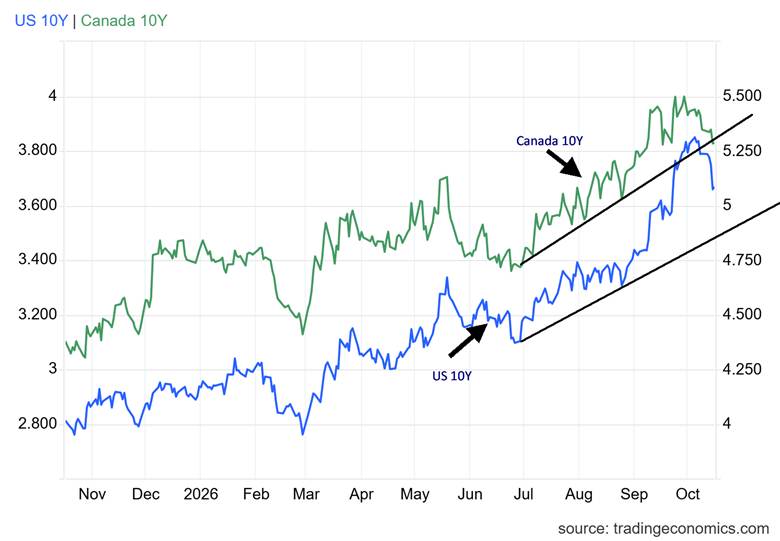
With a hot CPI and PPI, one would have expected bond yields to go up. They did, briefly. Then they turned tail and fell as buyers came into the market. A catalyst, we suspect, was Fed Chair Kevin Warsh who presented dovish statements following the inflation numbers. The odds had gone up that the Fed would hike rates again at the October 28–29 Fed meeting. Warsh poured some cold water on the idea. That prompted the bond speculators to jump in and in no time flat bond yields fell. The U.S. 10-year Treasury note closed down at 5.09% after being at 5.25% the previous week. The 30-year fell even more from 5.60% to 5.43%.
So, is this the start of a down move? Or a knee-jerk reaction sparking a stampede on Warsh’s dovish statements? The Canadian 10-year Government of Canada bond (CGB) fell to 3.83% from 3.88%. It’s just one week and it all needs to be determined as to whether this has more downside legs. A move through 5.00% and 3.80% could send yields lower. For Canada, an uptrend support line is here. For the U.S. 10-year, support could go down to 4.80%. Bond yields have improved before during the February–October run, only to regroup and start rising again. We are already experiencing an historic bond bear, so we don’t want to declare it over yet. But any easing is obviously welcome, temporary as it may be. That we haven’t had a crisis yet suggests that we may not have topped (yield) yet, either.
Gold and silver
Source: www.stockcharts.com
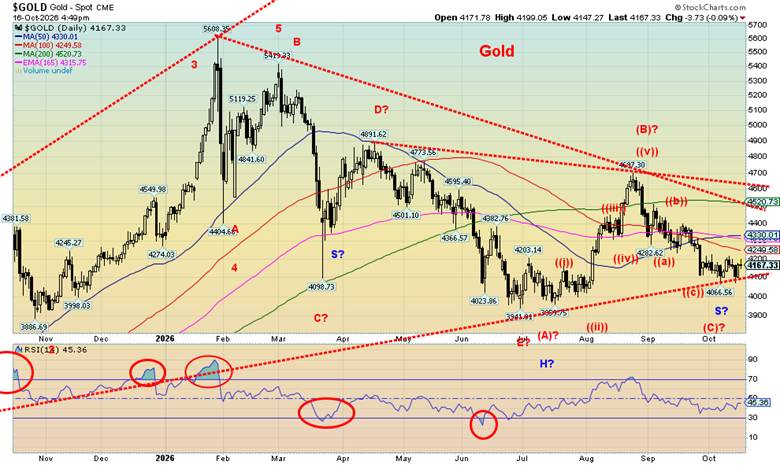
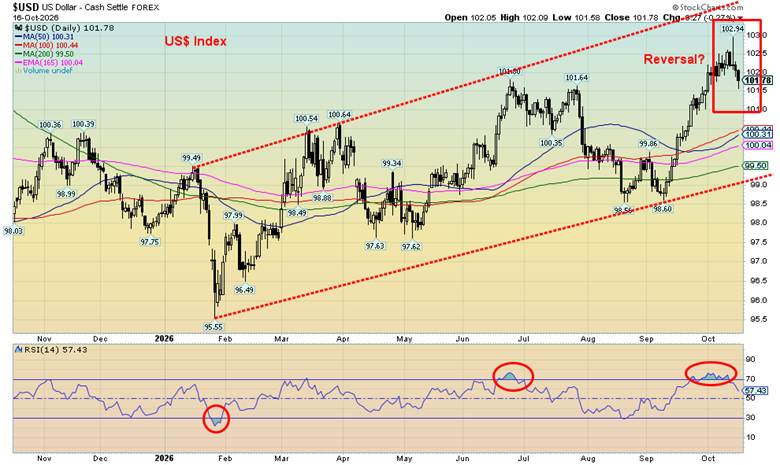
Gold hates higher interest rates, higher oil prices, and rising inflation. At least, until they don’t. Gold had a knee-jerk reaction to the hotter than expected CPI and PPI this past week, plunging over 1% after the release. But gold came back the next day. It may fall, but it quickly finds its footing. It helped that there were some sudden unexpected reversals this past week. The first was the drop in bond yields as that market turned suddenly bullish, bonds rallied, and yields that move inversely to price, fell. The US$ Index also suddenly reversed and then fell, closing down 0.3% on the week. Both helped gold.
We see something else that is potentially positive: the formation of what might be a head-and-shoulders inverse pattern. The right shoulder is in March at $4,098, the head formed in June/July with a low of $3,941, and we may now be in the process of forming the right shoulder with, so far, a low of $4,066. Obviously, that needs to hold if the pattern is to be realized, but even more is that the left shoulder at $4,099 needs to hold. We’re optimistic about that.
To the upside gold must take out and hold above $4,600 to suggest higher. Through $4,700, things should be looking up.
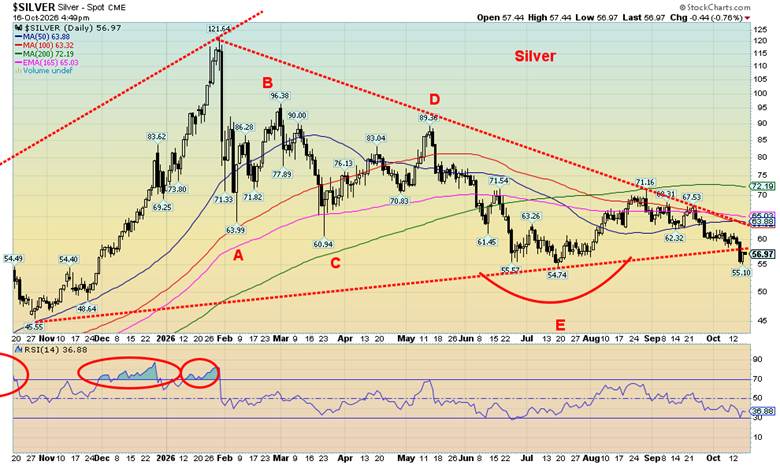
Silver also could be showing a double bottom, but that’s too close to call. We might see new lows for silver, but not gold. Silver did break that trend line, signaling lower prices. That would be a positive divergence.
The gold stocks have performed remarkably well during this period on a relative basis, outperforming the commodities themselves.
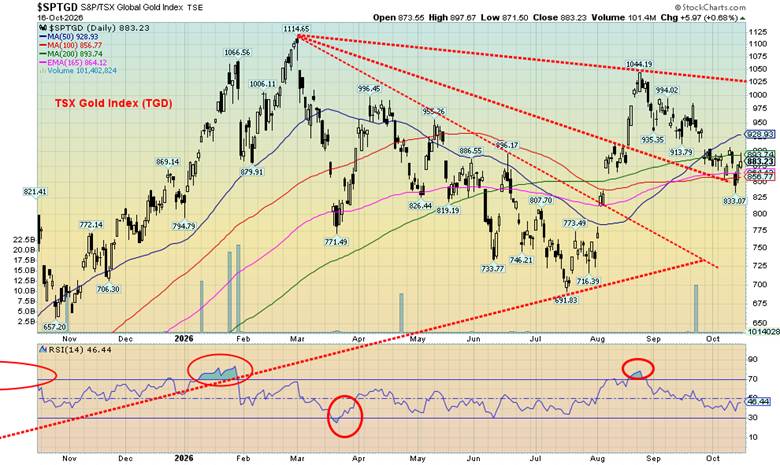
On the week, gold fell 0.7%, silver was down 6.2%, and platinum was off 3.1%. Palladium also fell 3.0% and copper took the week off, down 2.0%. The gold stocks saw the Gold Bugs Index (HUI) lose 1.8% and the TSX Gold Index (TGD) off 2.0%. But, surprisingly, both indices remain up on the year. However, not gold and silver.
Source: www.stockcharts.com
The TGD may have found support here. We need to regain over 930 to suggest a low. Under 800 does not look good. The junior exploration stocks continue to flounder. Witness the TSX Venture Exchange (CDNX) down 3.3% on the week and off 14.4% on the year.
Will the causes that sparked gold’s sell-off abate? Well, the wars will continue, sometimes sporadically. Inflation remains sticky, but if energy prices eased the CPI might too. We are reminded that inflation spiked higher in the 1970s on two occasions. Both times gold had a big up move with inflation. And the U.S. dollar was crashing during the 1970s. Will the US$ Index reverse down now as well? This past week was an interesting start, given that we spiked to a new 52-week high at 102.94 and then reversed down closing at 101.78 down 0.4% on the week. If we break 101, we should be on our way down.
The precious metals market remains bullish. Can’t rule out new lows for silver, but gold and the gold stocks appeared poised to go higher.
Source: www.stockcharts.com
Oil and gas
Source: www.stockcharts.com
The endless wars. Oh yes, and some hurricanes too. The wars: Russia/Ukraine, U.S./Iran, Saudi Arabia/Houthis. We should add Israel/Gaza/Hezbollah, but then there is no oil there. The hurricanes? They disrupt production, resulting in shutdown of rigs in the Gulf of Mexico. Yes, that may be only temporary until the hurricanes clear up. But the wars? Ongoing or should it be “never ending”.
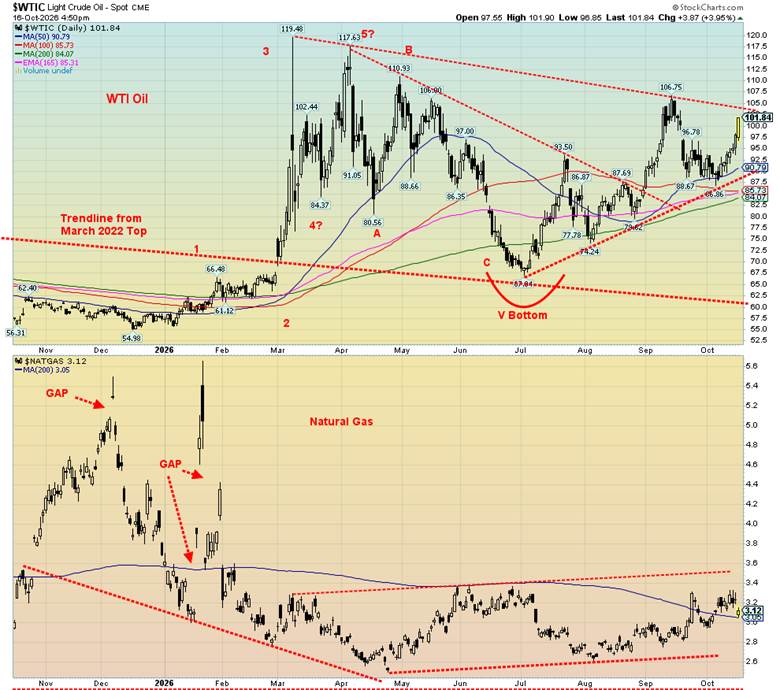
Despite all the reasons behind oil prices, our focus is on what oil prices did. Well, they leaped, and it was WTI oil that had the biggest move, up 11.0% on the week to close out at $101.71. Brent crude jumped to almost $110 and was up a lesser 5.3%. Natural gas was mixed with NG at the Henry Hub down 2.5% but the EU NG at the Duch Hub jumping 10.3%. The stocks loved it as both indices hit all-time highs with the ARCA Oil & Gas Index (XOI) up 5.8% and the TSX Energy Index (TEN) up 6.3%. They both remain buys.
That breakout point at $105 has suddenly gotten a lot closer. If we can successfully break through, targets could go to $135/$140. That’s assuming the wars just keep getting worse, which, unfortunately, appears to be the case. The so-called, short-lived energy truce between Russia and Ukraine lasted about a nano-second, and then serious bombing started again, targeting Russian refineries and attacks on energy and water facilities in the Ukraine. The U.S. has eased sanctions against Russia thus causing all sorts of consternation for all involved. In Saudi Arabia, the Houthis have successfully attacked Saudi airports, pipelines, and more. Saudi Arabia is the world’s third largest oil producer and holds the world’s second largest reserves. As to NG, Saudi is only the ninth largest producer and holds the sixth largest reserves. The U.S./Iran war continues to see ships hit in the Strait of Hormuz.
Both charts of WTI oil and NG continue to look bullish with breakouts needed to suggest higher levels. The charts show little to no downside risk with strong support below for both. The wars march on. And reserves in both the U.S. and the EU are low.
Copyright David Chapman 2026
Glossary
Trends
Daily - Short-term trend (for swing traders)
Weekly - Intermediate-term trend (for long-term trend followers)
Monthly - Long-term secular trend (for long-term trend followers)
Up - The trend is up.
Down - The trend is down.
Neutral - Indicators are mostly neutral. A trend change might be in the offing.
Weak - The trend is still up or down, but it is weakening. It is also a sign that the trend might change.
Topping - Indicators suggest that, while the trend remains up, the market may be topping.
Bottoming - Indicators suggest that, while the trend remains down, the market may be bottoming.
Disclaimer
David Chapman is not a registered advisory service and is not an exempt market dealer (EMD) nor a licensed financial advisor. He does not and cannot give individualised market advice. David Chapman has worked in the financial industry for over 40 years including large financial corporations, banks, and investment dealers. The information in this newsletter is intended only for informational and educational purposes. It should not be construed as an offer, a solicitation of an offer or sale of any security. Every effort is made to provide accurate and complete information. However, we cannot guarantee that there will be no errors. We make no claims, promises or guarantees about the accuracy, completeness, or adequacy of the contents of this commentary and expressly disclaim liability for errors and omissions in the contents of this commentary. David Chapman will always use his best efforts to ensure the accuracy and timeliness of all information. The reader assumes all risk when trading in securities and David Chapman advises consulting a licensed professional financial advisor or portfolio manager such as Enriched Investing Incorporated before proceeding with any trade or idea presented in this newsletter. David Chapman may own shares in companies mentioned in this newsletter. Before making an investment, prospective investors should review each security’s offering documents which summarize the objectives, fees, expenses and associated risks. Although Artificial Intelligence (AI) may be deployed from time to time, AI output is monitored and adjusted, if necessary, for accuracy. David Chapman shares his ideas and opinions for informational and educational purposes only and expects the reader to perform due diligence before considering a position in any security. That includes consulting with your own licensed professional financial advisor such as Enriched Investing Incorporated. Performance is not guaranteed, values change frequently, and past performance may not be repeated.
About the author


Website: https://www.enrichedinvesting.com
Disclaimer: David Chapman is not a registered advisory service and is not an exempt market dealer (EMD) nor a licensed financial advisor. We do not and cannot give individualised market advice. David Chapman has worked in the financial industry for over 40 years including large financial corporations, banks, and investment dealers. The information in this newsletter is intended only for informational and educational purposes. It should not be considered a solicitation of an offer or sale of any security. The reader assumes all risk when trading in securities and David Chapman advises consulting a licensed professional financial advisor before proceeding with any trade or idea presented in this newsletter. David Chapman may own shares in companies mentioned in this newsletter. We share our ideas and opinions for informational and educational purposes only and expect the reader to perform due diligence before considering a position in any security. That includes consulting with your own licensed professional financial advisor.