
This week's major event is the Jackson Hole Symposium, August 27–29, held in Jackson Hole, Wyoming, where central bankers, economists and others gather to discuss global and monetary affairs. The featured speaker is Fed Chair Kevin Warsh, marking his first Jackson Hole Symposium.
We also have the release of 2nd preliminary Q2 GDP along with July PCE prices. All this is against the backdrop of last week's Operation Twist Redux being carried out by the U.S. Treasury, whereby they buy long-dated U.S. treasuries and sell short-dated U.S. treasuries in order to try and dampen long-dated interest rates. How did that go? Well, it was pretty temporary. The dollar weakened, and gold and Bitcoin soared. It reinforced a debasement trade against the backdrop of rising U.S. deficits, U.S. debt that has soared past $40 trillion, and deteriorating global monetary conditions. They'll have a lot to talk about at Jackson Hole.
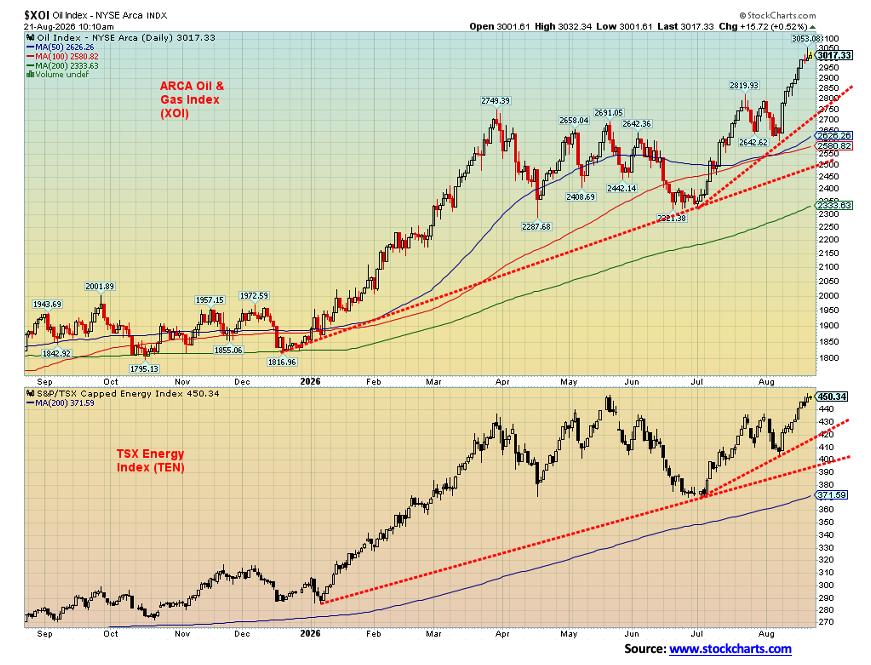
Oil prices are perking up again against the backdrop of deteriorating conditions in the Mid-East with proposed economic armageddon against Iran and the ongoing war between Russia and Ukraine that continues to threaten to expand. Energy stocks appear to be anticipating higher oil prices, as the XOI and the TEN soared to new all-time highs this past week. Energy stocks are the topic of our chart of the week.
This past week, the stock market wobbled, while gold and oil soared. The US$ Index plummeted. Once again, the talk is whether the stock market has topped. So far inconclusive. Gold broke out, joining the gold stocks, while oil is on the cusp of breaking out. This is likely to benefit companies that energy services companies such as Secure Waste Infrastructure Corp. that reported increased revenue, stronger net income, and expanded discretionary free cash flow, pays a dividend, and is held in the Enriched Capital Conservative Growth Strategy.*
While not a topic for the Scoop, trade talks between Canada and the U.S. broke down. Prepare for higher tariffs as the economic war expands.
It'll soon be labour day marking a period when activity picks up in the stock market. September is the dreaded month, known for being the weakest month of the year for the stock market.
Have a great week!
DC
* Reference to the Enriched Capital Conservative Growth Strategy and its investments, celebrating an
8.5 - year history of 208% growth (annual 14.16%) strong alpha and top July ranking at www.emergingmanagers.ca, is added by Margaret Samuel, President, CEO and Portfolio Manager of Enriched Investing Incorporated, who can be reached at 416-203-3028 or msamuel@enrichedinvesting.com This information should not be construed as an offer, or a solicitation of an offer or sale of any security. Past performance does not guarantee future returns.
“Our country is always willing to lend a hand to the helpless, as long as they lend us a hand when we need to fill up our gas tanks.”
—Thor Benson, independent journalist, has written for The Verge, Rolling Stone, The Atlantic, Slate, and others; b. 1990
“But if arming Iran to support Israel was insane, the flip side of the policy, in the long run at least, was truly demented: Weinberger and Shultz favored defending Saudi Arabia and the enormous U.S. oil interests there by secretly bolstering the brutal Iraqi dictator Saddam Hussein. As a result of their efforts, billions of dollars in aid and weapons were funneled to Saddam's regime.”
—Craig Unger, American journalist and writer, author of House of Bush, House of Saud, has written for The New Yorker, Esquire, Vanity Fair, amongst others; b. 1949
“If oil prices will go too high, it will slow down the world economy and would trigger a global recession.”
—Khalid A. Al-Falih, Saudi businessman, minister of state and member of Council of Ministers of Saudi Arabia, served as minister of investment of Saudi Arabia (2020–2026), minister of energy (2016–2019), chairman Saudi Aramco (2015–2019), president CEO Saudi Aramco (2009–2015); b. 1960
Operation Twist redux?
Danger lurks in global markets in the form of falling bond markets (rising yields). The U.S. has $40 trillion in debt and the interest costs on the debt now exceed $1.1 trillion annually. Japan has debt of some $11.4 trillion and a debt-to-GDP ratio over 256%, the highest in the world. China has $21.5 trillion of debt and even its debt- to-GDP ratio exceeds 107%. That most of Japan’s and China’s debt is held domestically doesn’t lessen the dangers that lurk behind. The world has a debt problem.
All G7 nations are burdened with too much debt. The best is Germany with $3.7 trillion in debt and a debt-to- GDP ratio of 72%. Canada has the lowest debt at $3 trillion, but that includes the provinces. Their debt-to-GDP is 127%. The world’s total debt is estimated at $353 trillion (governments, corporations, and consumers). In 2008, the world’s total debt was estimated at $173 trillion. Since then, we have more than doubled thanks primarily to the 2008 financial crisis and the 2020 pandemic.
Rising interest rates are a threat to all debt, given it makes the cost of carry (interest) a lot higher. Long-dated debt is used to determine the cost of funds for corporations, financial institutions, and the consumer (mortgages, car loans, credit cards, etc.). It can even impact on the cost of debt for other sovereign nations. If government debt yields go up, so does everything else. Interest on the debt could threaten other needs as it is crowding out, meaning more and more funds are needed to service the debt at the expense of other needs. In 2008, interest on the U.S. federal debt was $251 billion or roughly 8.5% of the U.S. official budget. Today at $1.1 trillion it is roughly 15.0% of the U.S. official budget. Almost double. Total U.S. federal debt has exploded by $29.4 trillion or 280% since 2008. Is it sustainable? Probably not. For others such as Japan even less so.
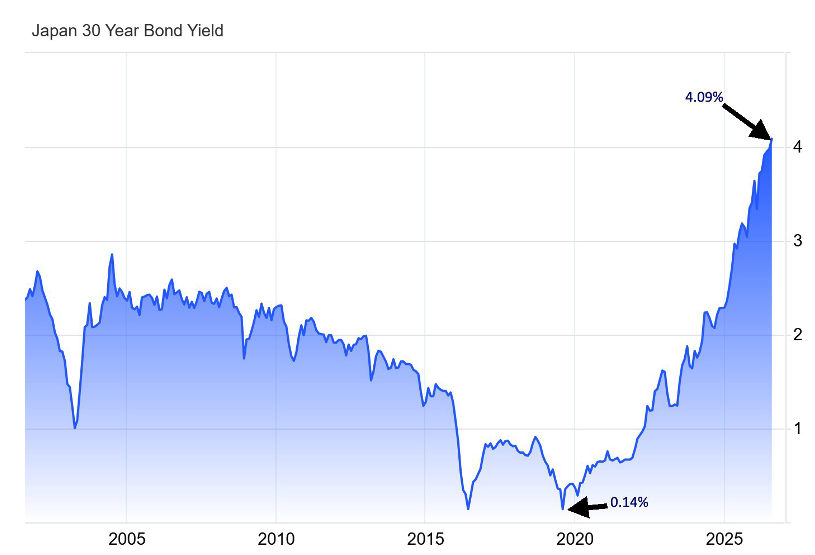
Our chart of Japan’s 30-year bond yield highlights the problem. Effectively, it has gone parabolic since that low in 2019/2020. It has gone up by over 2,800%.
Japan 30-Year Bond Yield 2001–2026
Source: www.tradingeconomics.com,
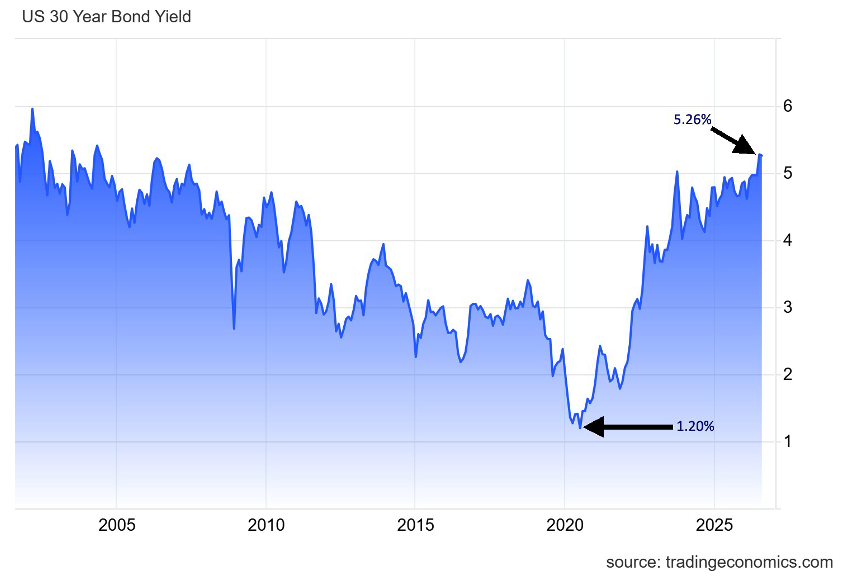
Japan isn’t alone. The U.S. 30-year bond yield leaped from 1.20% in 2020 to 5.25% today, an increase of 338%. All that translates into higher costs for everything, from mortgages to car loans. Not good. We discovered that foreign holding of U.S. treasuries fell $72.1 billion from May to June 2026. The three largest holders all reduced their holdings: Japan down $26.4 billion, U.K. down $8.7 billion, and China down $25.9 billion. Is this a trend? Not yet, but it’s not a very good sign. When you run an almost $2 trillion budget deficit every year (some 6.5% of the budget), you need to raise funds and foreign buyers are an important source. It puts further pressure on domestic buyers, including the Fed itself. No wonder the Fed balance sheet is growing. That’s at odds with Fed Chair Kevin Warsh’s desire to lower the Fed’s balance sheet.
More intriguing is that the U.S. treasury is embarking on a buyback program of long-dated U.S. treasuries and selling short-dated U.S. treasuries in order to help bring down the cost (yield) of treasuries at the long end of the curve, predominantly 10–30 years. That reminds us of Operation Twist carried out by the Federal Reserve in 2011, following the years of quantitative easing (QE) after the 2008 financial crisis. How’s that going? It has become a topic of conversation. Upon announcement, the 30-year fell from 5.30% to 5.20%. It dropped the 10-year treasury note to 4.66% from 4.72%. It’s a band-aid solution for a bigger problem. Gold exploded to the upside, stocks rallied, and the US$ Index fell sharply. We suspect the odds of this holding rates down will soon dissipate.
U.S. 30-Year Bond Yield 2001–2026
Source: www.tradingeconomics.com,
Add this to the U.S. Treasury’s intervention in the Japanese yen market along with the BOJ in an attempt to push up the value of the yen vs. the U.S. dollar. It helped temporarily before the yen started falling again.
The U.S. Treasury used euros to buy yen in an effort to help yields on U.S. treasuries and hopefully prevent Japan from selling off more its holdings of U.S. treasuries. They also set up a repo facility at the Fed whereby they could go in and borrow U.S. dollars, then back the loan with U.S. treasuries as collateral. Instead of having to sell U.S. treasuries to raise funds they can use the repo facility.
There has been the fear that if Japan needs funds to buy yen, they will sell more U.S. treasuries, thus helping to push up the yield. As well, the yen carry trade is vulnerable with both rising interest rates and a rising yen if attempts to push the yen higher are successful. The yen carry trade is estimated at over $10 trillion so an unwinding could prove to be very stressful for markets.
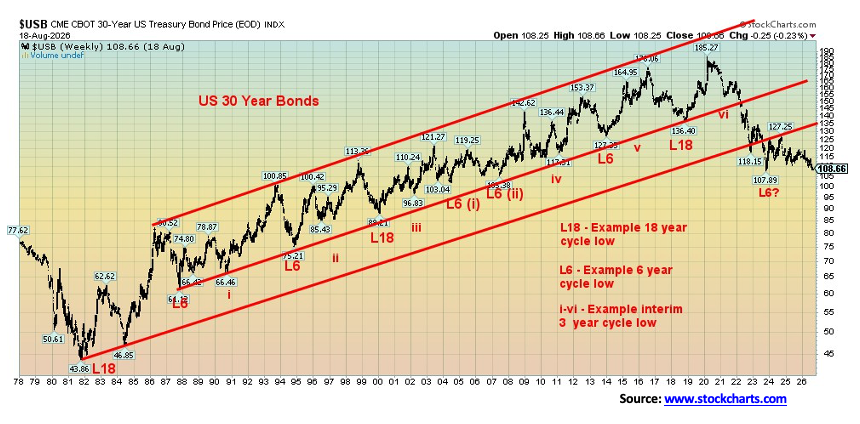
We have often noted the long-term cycles for bonds. Ray Merriman of MMA Cycles (www.mmacycles.com) has noted that bonds have a history of an 18-year cycle. That cycle is in turn broken down into three cycles of six years or two cycles of nine years. The 6-year cycle dominates. The 6-year in turn can be broken down into either two 3-year cycles or three 2-year cycles. Our long-term chart of the U.S. 30-year follows. The last 18-year cycle recorded is 2018, marking the next 18-year cycle to be centred around 2036.
The first 6-year cycle of the current 18-year cycle appears to have occurred in late 2023. The next one is due in 2029. The current 30-year bond price at 108.66 is still above the last low seen at 107.89. However, it is threatening to break that low. Once it does, it tells us that we should go much lower (higher in yield). When you have $40 trillion in debt, that’s not what you want to hear. We are in a bear market for bonds and it appears it has further to go.
U.S. 30-year bonds 1978–2026 (price)
Source: www.stockcharts.com
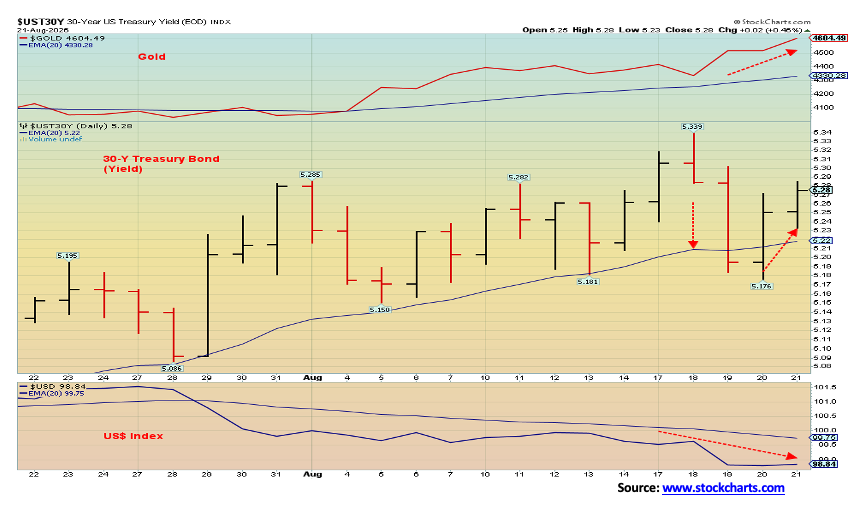
Is this buyback program working? Initially, the 30-year U.S. Treasury bond fell from 5.30% to 5.20%. It’s now back up to 5.25%. The 10-year U.S. Treasury note initially fell to 4.65% from 4.73%. It’s now back up to 4.71%. Of course, the hope is that the buyback program would boost liquidity in the long end of the market. The
program’s success is in doubt. No matter what, $40 trillion in debt just doesn’t disappear. They would have to increase their sales of short treasuries; i.e., three months to five years. At best, this is just a short-term fix, a band aid solution that could backfire big time as other holders of long-dated treasuries get nervous and sell. The U.S. has enough problems with its huge deficits, inflation from the ongoing war with Iran, and the borrowing requirements of AI companies, which keep rising.
It’s not as if this doesn’t impact other markets. The U.S. treasury is the biggest most liquid market in the world. The rest of the world also largely prices its bonds in relation to the U.S. market. If U.S. yields rise, so does (mostly) everything else. The stock market doesn’t like rising rates. But gold (and Bitcoin) soared on the news and the US$ Index fell sharply. Since this program is being carried out by the U.S. Treasury, the move complicates monetary policy for the Fed.
This is at best a temporary fix that is more likely to make investors nervous than confident. Foreign holders are already dumping U.S. treasuries. Are more to follow? And if so, who is going to buy them all? A crisis is brewing. When does this debt all become unsustainable? We suspect this won’t end well.
30-year U.S. treasury bond, gold, US$ Index (One month)
Source: www.stockcharts.com
Chart of the week
ARCA Oil & Gas Index (XOI), TSX Energy Index (TEN)
Source: www.stockcharts.com
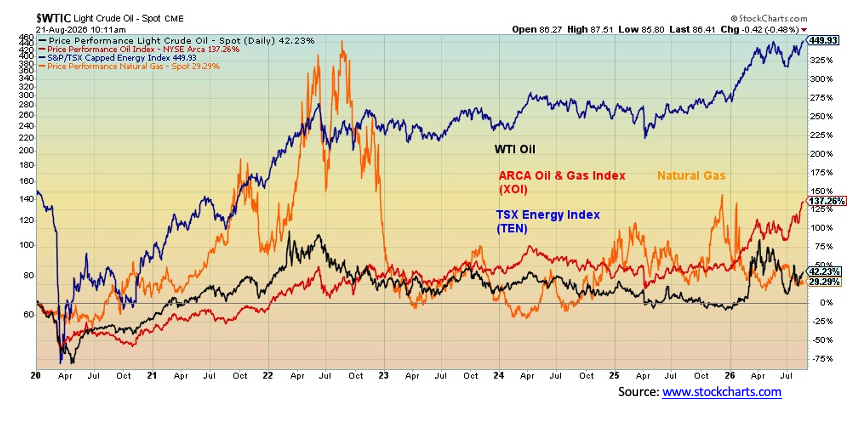
Oil prices have been soaring, thanks to the on-again, off-again U.S. war with Iran. So, it is not surprising to see the energy stocks perk up and rally as well. And well they are doing, as now both the ARCA Oil & Gas Index (XOI) and the TSX Energy Index (TEN) are making all-time highs. The stocks are outperforming the commodity. As we can observe from our performance chart, WTI oil is up a paltry 42% since 2020. But the XOI is up 139%, and the real star has been the TEN, up 450%. For the record, natural gas (NG) at the U.S. Henry Hub is up 28% but it was up a lot more when the Russia/Ukraine war broke out in 2022. At the same time, NG at the EU Dutch Hub is up 445% as it is more sensitive to the ongoing situation in the Persian Gulf than is North American NG. NG, unlike oil, is more localized and it is not priced globally as is oil. Brent crude is up 44% in line with WTI.
That the energy stocks are outperforming and leading is a positive sign, if one is to believe that oil prices have further to rise. Oil prices are being battered because of the on-again, off-again nature of the war with Iran. The energy stocks are telling us that inevitably oil prices are going to go higher, possibly a lot higher. The threats of economic armageddon against Iran is liable to bring a negative response from not just Iran but also the countries threatened with sanctions if they dare deal with Iran. That is particularly the case with China. All this will inevitably put further upward pressure on oil prices.
WTI Oil, XOI, TEN, NG – Performance 2020–2026
Source: www.stockcharts.com
|
|
|
|
% Gains (Losses) Trends |
|
||||
|
|
Close Dec 31/25 |
Close Aug 21/26 |
Week |
YTD |
Daily (Short Term) |
Weekly (Intermediate) |
Monthly (Long Term) |
|
|
|
|
|
|
|
|
|
||
|
S&P 500 |
6,845.50 |
7,674.30 |
(1.4)% |
12.1% |
up |
up |
up |
|
|
Dow Jones Industrials |
48,063.29 |
53,276.81 |
(0.9)% |
10.9% |
up (weak) |
up |
up |
|
|
Dow Jones Transport |
17,357.19 |
21,570.22 |
(1.0)% |
24.3% |
down |
up |
up |
|
|
NASDAQ |
23,241.99 |
26,180.46 |
(2.1)% |
12.6% |
up |
up |
up |
|
|
S&P/TSX Composite |
31,712.76 |
36,620.23 |
(0.3)% |
15.5% |
up |
up |
up |
|
|
S&P/TSX Venture (CDNX) |
987.74 |
988.37 |
1.9% |
0.1% |
up |
neutral |
up |
|
|
S&P 600 (small) |
1,467.76 |
1,789.39 |
(2.1)% |
21.9% |
neutral |
up |
up |
|
|
ACWX MSCI World x US |
67.18 |
77.90 |
flat |
15.9% |
up |
up |
up |
|
|
Bitcoin |
87,576.98 |
77,046.29 |
22.5% |
(12.1)% |
up |
neutral |
neutral |
|
|
|
|
|
|
|
|
|
|
|
|
Gold Mining Stock Indices |
|
|
|
|
|
|
|
|
|
Gold Bugs Index (HUI) |
701.49 |
863.76 |
12.6% |
23.1% |
up |
up |
up |
|
|
TSX Gold Index (TGD) |
817.76 |
1,010.26 |
13.7% |
23.5% |
up |
up |
up |
|
|
|
|
|
|
|
|
|
|
|
|
Bonds% |
|
|
|
|
|
|
|
|
|
U.S. 10-Year Treasury Bond yield |
4.17% |
4.74% |
1.1% |
13.7% |
|
|
|
|
|
3.3Cdn. 10-Year Bond CGB yield |
3.44% |
3.76% |
2.2% |
9.3% |
|
|
|
|
|
Recession Watch Spreads |
|
|
|
|
|
|
|
|
|
U.S. 2-year 10-year Treasury spread |
0.69% |
0.50% |
(2.0)% |
(27.5)% |
|
|
|
|
|
Cdn 2-year 10-year CGB spread |
0.85% |
0.72% |
flat |
(15.3)% |
|
|
|
|
|
|
|
|
|
|
|
|
|
|
|
Currencies |
|
|
|
|
|
|
|
|
|
US$ Index |
98.26 |
98.83 |
(0.8)% |
0.6% |
down |
neutral |
neutral |
|
|
Canadian $ |
72.87 |
72.62 |
0.8% |
(0.3)% |
up |
up |
down (weak) |
|
|
Euro |
117.48 |
116.78 |
1.0% |
(0.6)% |
up |
neutral |
up |
|
|
Swiss Franc |
126.21 |
124.84 |
1.6% |
(1.1)% |
up |
down |
up |
|
|
British Pound |
134.78 |
136.46 |
0.8% |
1.3% |
up |
up |
up |
|
|
Japanese Yen |
63.83 |
62.89 |
0.2% |
(1.5)% |
up |
down (weak) |
down |
|
|
|
|
|
|
|
|
|
|
|
|
Precious Metals |
|
|
|
|
|
|
|
|
|
Gold |
4,311.97 |
4,617.12 |
5.6% |
7.1% |
up |
neutral |
up |
|
|
Silver |
71.16 |
69.36 |
7.2% |
(2.5)% |
up |
down (weak) |
up |
|
|
Platinum |
2,046.90 |
1,894.10 |
7.8% |
(7.5)% |
up |
down (weak) |
up |
|
|
|
|
|
|
|
|
|
|
|
|
Base Metals |
|
|
|
|
|
|
|
|
|
Palladium |
1,619.50 |
1,351.00 |
2.5% |
(16.6)% |
up |
down (weak) |
up (weak) |
|
|
Copper |
5.64 |
6.57 |
(0.4)% |
16.5% |
up |
up |
up |
|
|
|
|
|
|
|
|
|
|
|
|
Energy |
|
|
|
|
|
|
|
|
|
WTI Oil |
57.44 |
86.65 |
5.3% |
50.9% |
up |
up (weak) |
up |
|
|
Nat Gas |
3.71 |
2.75 |
1.1% |
(25.9)% |
down |
down |
down (weak) |
|
Source: www.stockcharts.com
* New All-Time Highs
Note: for an explanation of the trends, see the glossary at the end of this article.
New highs/lows refer to new 52-week highs/lows and, in some cases, all-time highs.
Stocks
Source: www.stockcharts.com
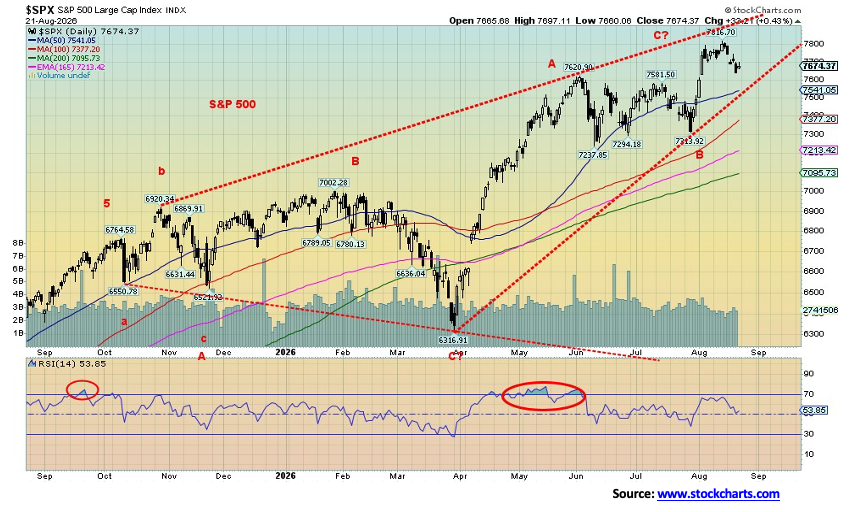
Is it over? So many have called for the end of the bull market that we wonder whether any shorts are still solvent. But once again markets wobbled this past week. Seems logical with the ongoing conflicts in the Middle East between the U.S. and Iran and the Russia/Ukraine conflict. They all threaten to expand further, drawing more players into the fray. As well, is the AI bubble over? Many have called for its demise, only to see prices continue onward and upward. Notably, however, we find the MAGS and FAANGs wobbling. No one seems to be making new highs these days. Occasional bursts from a few. But a look at the MAG7 and the MAGS reveals they are mostly rolling over. What nobody has done is actually break down – yet.
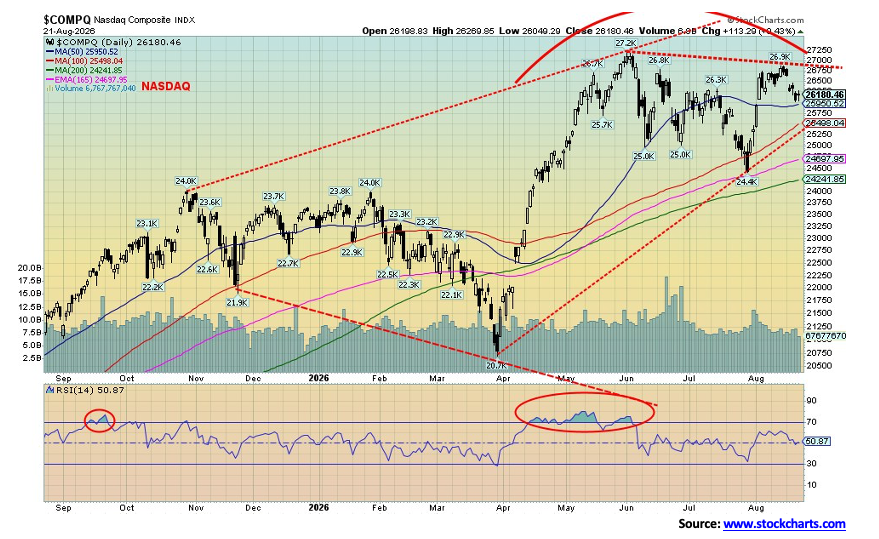
We’ve seen this pattern before: a consolidation followed by a burst to new highs, and then a retreat. That 7,313 low seen on the daily chart of the S&P 500 is now our break point. Below that we confirm a high. Yes, we wobbled this past week as the S&P 500 fell 1.4%, the Dow Jones Industrials (DJI) dropped 0.9%, the Dow Jones Transportations (DJT) were off 1.0%, while the NASDAQ fell 2.1%. The S&P 500 Equal Weight Index did make new all-time highs, then closed down 0.5%. The S&P 400 (Mid) fell 2.5% and the S&P 600 (Small) dropped 2.1%. The NY FANG Index fell 1.5% while the MAG7 proxy, MAGS, fell 1.4%.
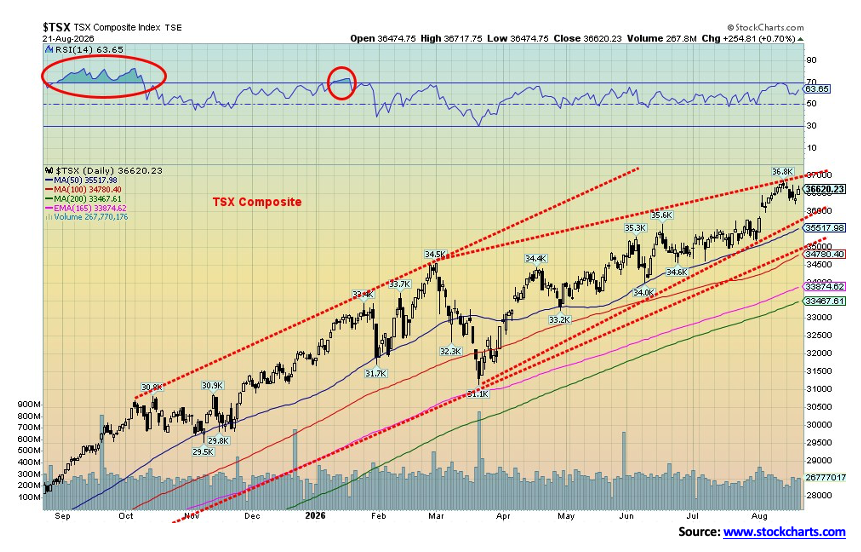
Canada wasn’t spared. The TSX Composite fell 0.3% while the TSX Venture Exchange (CDNX) continues to show some life, up 1.9%. The TSX can thank the golds, metals, and materials for its recent lift.
In the EU, the London FTSE rose 0.5%, the EuroNext fell 1.6%, the Paris CAC 40 was off 1.8%, and the German DAX dropped 1.2%. The EU is wobbling as well. In Asia, China’s Shanghai Index (SSEC) fell 0.6%, the Tokyo Nikkei Dow (TKN) fell 3.9%, Hong Kong’s Hang Seng (HSI) was actually up 3.6% while India’s Nifty Fifty fell 0.5%. Wobbling (mostly) all around. The MSCI ex USA World Index ETF was flat on the week after making new all-time highs.
Source: www.stockcharts.com
As noted, the MAG7 wobbled. We note that Meta fell 6.7%, Amazon was down 1.5%, Google was off 0.5%, Microsoft was down 2.4%, Nvidia was down 4.6%, while Tesla jumped 6.1%. The big loser on the week was CrowdStrike, down 11.4%. But the surprise was Trump Media (DJT), up 10%. Baidu fell 10% and Advanced Micro (AMD) dropped 7.9%.
In Canada, nine of the 14 sub-indices fell on the week led by Information Technology (TTK), down 4.6%. More than offsetting the losers were Golds (TGD), up 13.7%, Metals (TGM), up 11.4%, and Materials (TMT), gaining 11.5%.
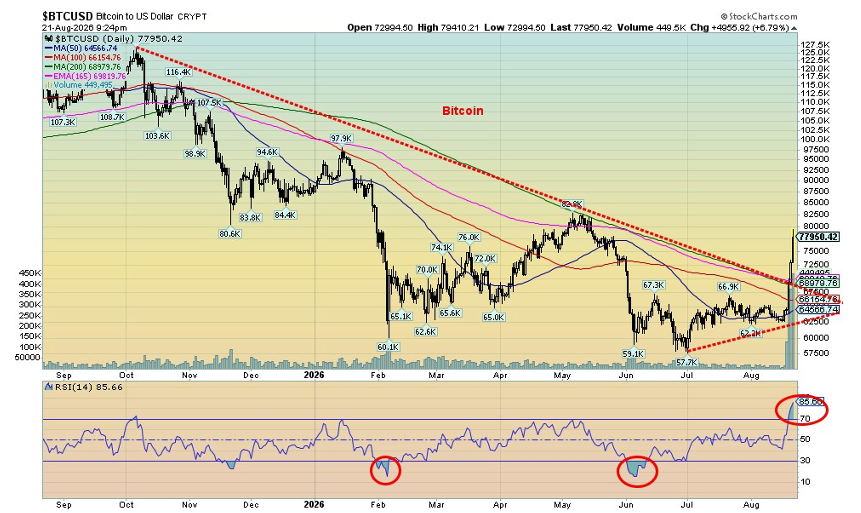
Bitcoin followed gold to the upside. We wonder why Bitcoin is viewed as a safe haven, given the recent hack that made off with $140 million of coins. Nonetheless, investors flocked to Bitcoin as a safe haven as it gained 22.5% on the week, surpassing gold’s gain of 5.6%. A reminder - gold is real; Bitcoin is virtual.
Source: www.stockcharts.com
The S&P 500 shows signs of trouble under 7,600. Under 7,300 it’s breaking down. The NASDAQ is already vulnerable, given it is making what appears to us as a double top. The neckline is around 25,000 and under 24,500 a more serious drop could get underway. The TSX continues to be held up by the Materials sector so should continue to outperform. The TSX breaks under 35,500 and under 34,500 we should be breaking down. The other sub-indices led by Financials (TFS) would have to lead. But, overall, the Materials group should keep things somewhat steady.
September is a notably bad month for stocks. Sell after Labour Day.
Source: www.stockcharts.com
Bonds
Source: www.tradingeconomics.com, www.home.treasury.gov, www.bankofcanada.ca
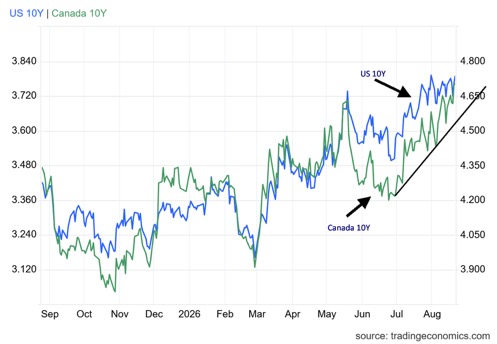
There is little to add to our opening about the goings-on in the U.S. treasury market. Intervention on the part of the U.S. Treasury only highlights what we already knew. U.S. $40 trillion in debt poses a huge risk, not just to the U.S. but the entire world. Long-dated interest rates are rising everywhere. It’s even attracted the attention of The Globe and Mail. Ian McGuigan’s article “For the first time in decades, you might want to buy government bonds” (The Globe and Mail, August 22, 2026), is informative (www.theglobeandmail.com/investing/markets/inside-the-market/article-government-bonds-long-term-yields-financial-crisis-investing/). However, we’d be cautious about buying bonds as the trend is pointed to even higher yields. Canadian 30-year bonds are last at 4.17% with inflation at 3%. In the U.S., the 30-year Treasury bond is at 5.27% with inflation at 3.4%. Inflation erodes bond prices. We’ve already broken down and the U.S. treasury market is taking on the look of the late 1970s, a period when bond yields and inflation soared.
On the week, the U.S. 10-year Treasury note initially fell from 4.74% to 4.65%. However, by the week’s end it was back up to 4.74%, a gain of 5 bp on the week. The story was the same in Canada as the 10-year Government of Canada bond (CGB) initially fell from 3.72% to 3.70%, but again by the week’s end closed at 3.76%, a gain of 8 bp on the week. We suspect that the collapse of trade talks between the U.S. and Canada could put further upward pressure on the 10-year. The 2–10 spreads remain mostly unchanged.
This week sees the Q2 GDP growth number expected to rise 1.5%. The previous preliminary report saw GDP up 2.1%. PCE prices for July are also out. Last month it was 3.7%, not a level the Fed wants to see. But the big story for the week is probably the annual Jackson Hole, Wyoming symposium hosted by the Fed on August 27–29, 2026. Fed Chair Kevin Warsh will give us his first Jackson Hole speech. Jackson Hole is a big deal, so it’s worth paying attention to. The symposium hosts a huge array of central bankers, policy makers, academics, and economists from around the world.
Jackson Lake Lodge, Grand Tetons, Wyoming

Source: www.nps.gov
Gold and silver
Source: www.stockcharts.com
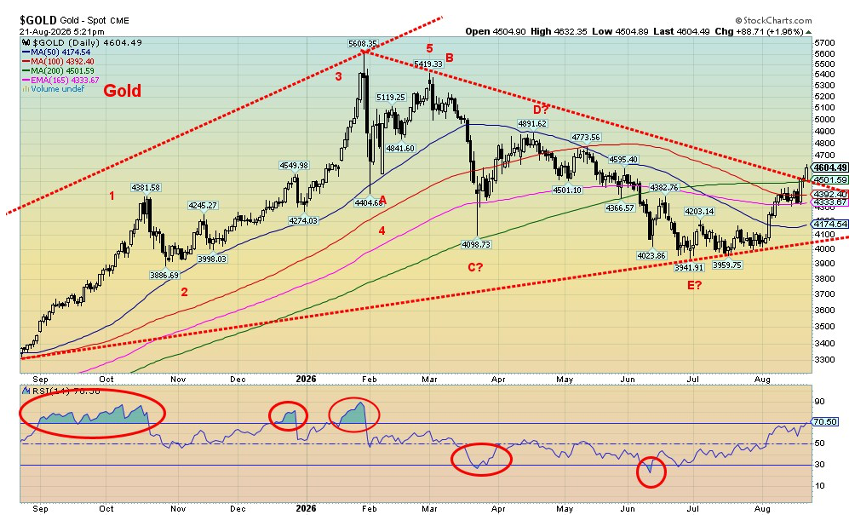
The precious metals market wishes to thank U.S. Treasury Secretary Scott Bessent for his intervention in the bond market. It has sparked a big rally for gold, silver, and the gold stocks. Rather than view the U.S. Treasury’s intervention in the bond market (Operation Twist redux) as a positive, it instead views it as a sign of weakness and stress. As a result, the U.S. dollar sold off, and gold exploded to the upside. Bitcoin soared as well.
The background here is not forgiving and gold is, rightly, responding positively to the stress. Initially, long-dated U.S. treasuries saw yields fall. By the week’s end, they were mostly back up again from where they started. It also raises inflation concerns. None of this is good.
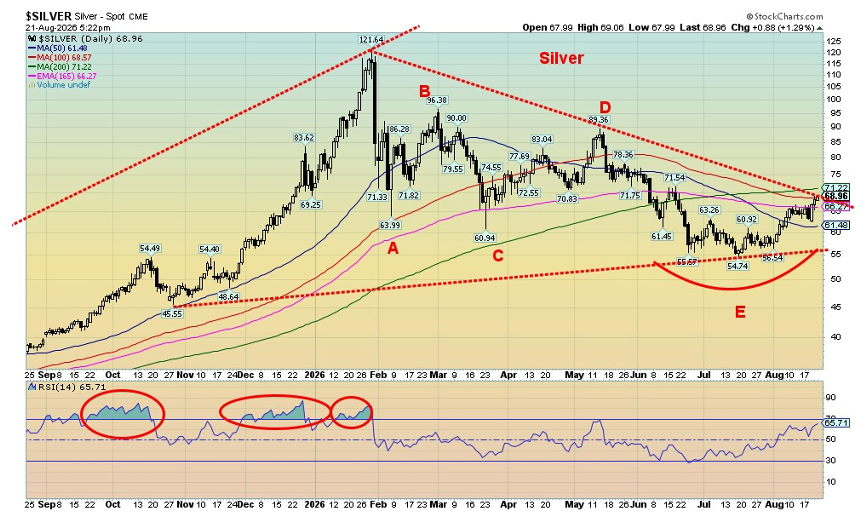
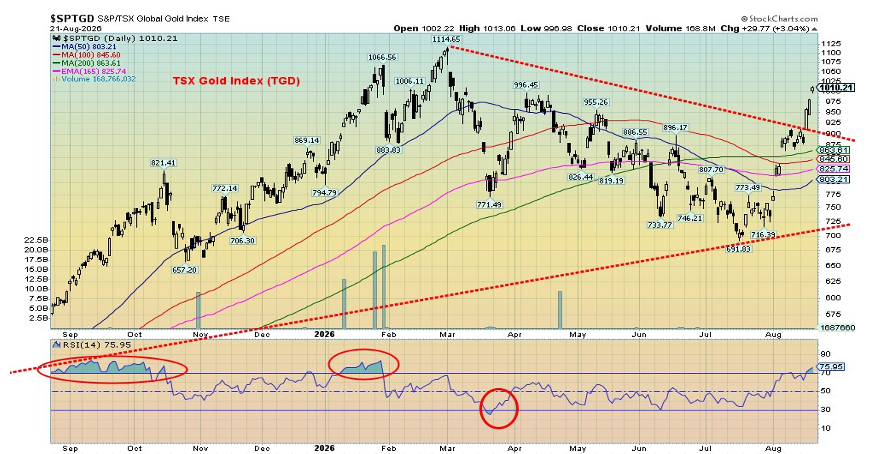
Gold rose 5.6% this past week to its best levels since May. We broke out over $4,500 and appear to be holding above, thus confirming the recent low at $3,941. Targets in a best-case scenario could be up to $6,200. Gold bugs will be elated. Silver also jumped up 7.2% but remains below breakout points at $71/$72. Our expectations are that silver should break out. Not to be left behind, platinum jumped 7.8%, while the near precious metals were also up, with palladium gaining 2.5% while copper consolidated recent gains, off a small 0.4%. The gold stocks, which have already broken out, saw the Gold Bugs Index (HUI) jump 12.6% and the TSX Gold Index (TGD) up 13.7%. The gold/silver ratio moved down to 66.59, off 1.5% in favour of silver. The situation for silver and the gold stocks is positive. The gold stocks have quickly gone from down on the year to up on the year with the HUI now ahead 23.1% and the TGD up 23.5%. Thank you, Scott Bessent.
Source: www.stockcharts.com
Silver looks good and is poised to break higher. Once successfully through $71/$72, targets could be up to $138. The gold stocks have already broken out. The HUI’s targets could be up to 1,080 and the TGD up to 1,225. That’s not that far away so there could be higher targets. Either way, gold stocks appear poised to move higher. Things are also stirring in the junior gold developers’ market. They primarily trade on the TSX Venture Exchange (CDNX). They should start to move after Labour Day.
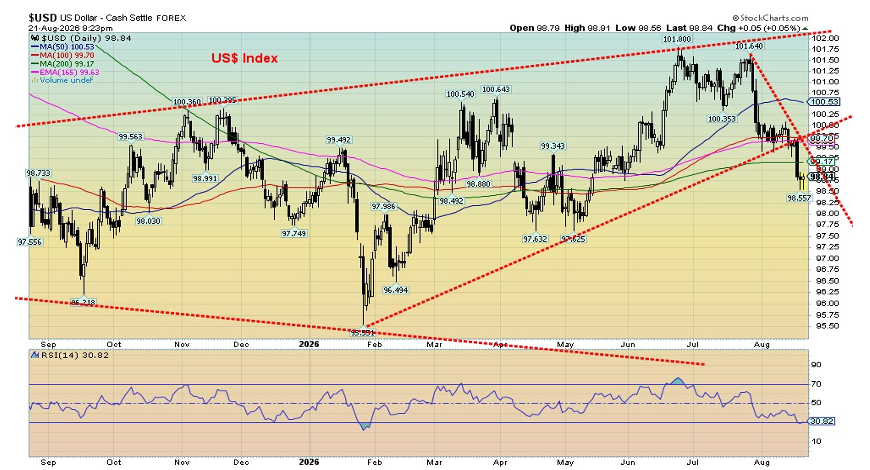
The US$ Index has broken down once under 99.50. Targets appear to be down to 95. It should be a steady decline, not a crash, although the initial reaction following the U.S. Treasury’s move was a swift decline.
Again, we should thank Scott Bessent for pointing out what many of us already knew. There is a big problem in the $40 trillion U.S. treasury market.
Source: www.stockcharts.com
Source: www.stockcharts.com
Oil and gas
Source: www.stockcharts.com
The Middle East continues to deteriorate. Transits through the Strait of Hormuz are in single digits for the week. And now we have an announcement from Trump of an economic D-Day with Iran that would see sanctions put on any country that dares to deal with Iran. No surprise, China has already said no. Iran has promised to up the stakes by attacking U.S. bases in the Middle East once again or, for that matter, any country in the region that continues to support the U.S. Economic warfare is a tit-for-tat game and there are never any winners, just losers all around.
We learn as well that ships trying to get through the Strait of Hormuz, that remains effectively closed, turn off their transponders so as not to be detected. The trouble is that increases risks of collisions. Already there have been some oil spills in the Persian Gulf and the Strait of Hormuz that threatens a sensitive environment already under pressure.
The Strait of Hormuz is closed by Iran and as well by the U.S. with an embargo on Iranian ports. Are there alternatives? Yes, but the pipelines do not have sufficient capacity to replace what normally goes through the Strait of Hormuz. Many of those pipelines go to the Red Sea where Saudi ships are already under attack by the Houthis of Yemen who have effectively closed the Bab el-Mandeb Strait between the Red Sea and the Gulf of Aden. Other pipelines are not operative. Using the Suez Canal means having to go through the Mediterranean, then around the Cape of Good Hope to Asia. That’s a long journey adding days (months?) to transit as well as cost. More pipelines could be built but that takes time and money. As well, they are easy targets.
The war between Russia/Ukraine appears to be escalating, threatening oil refineries in Russia and the ability for Ukraine to deliver its agricultural products that normally would go through the Black Sea. That could have negative impacts on oil prices as well as food prices. The relationship between the U.S. and South Korea is also in question as the U.S. scales back military manoeuvres with South Korea because they won’t help the U.S. against Iran.
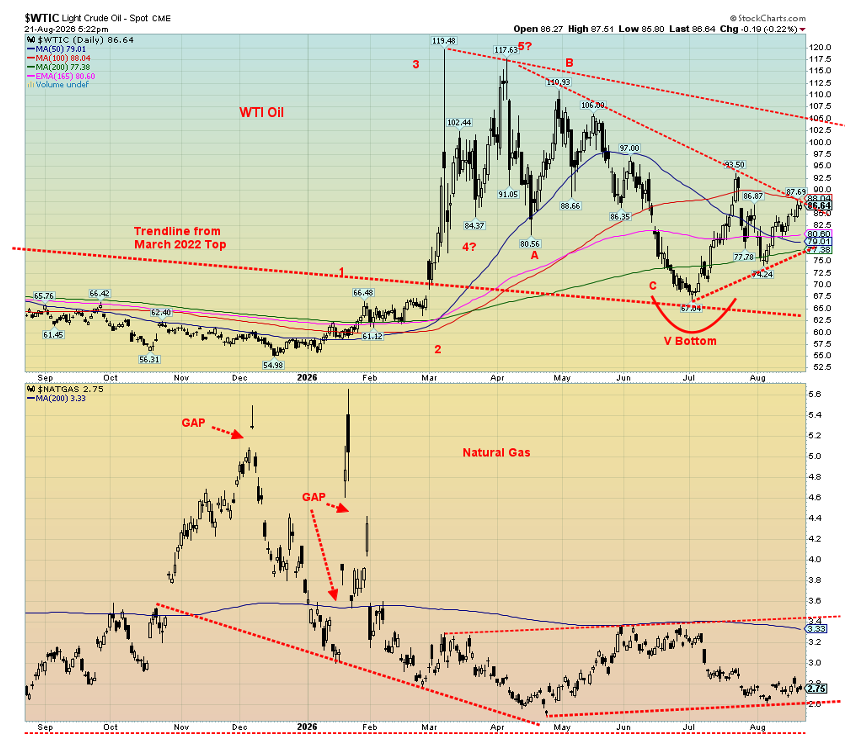
No wonder WTI oil rose 5.3% this past week. Brent crude was up 6.2%. Natural gas (NG) wasn’t spared as NG at the EU Dutch Hub rose 9.1%, even as NG at the U.S. Henry Hub rose only 1.1%. Unlike oil, NG is priced separately, given the Henry Hub is North America while the Dutch Hub receives its supplies through the Gulf and the Strait of Hormuz. Energy stocks responded with both the ARCA Oil & Gas Index (XOI) and the TSX Energy Index (TEN) leaping to new all-time highs this past week. The XOI was up 4.1%, the TEN up 4.5%. The message? Own oil stocks.
U.S. commercial stocks of oil remain near 5-year lows and need replenishing. We’re not sure how China stands as it has been utilizing its commercial stocks as well in order to replace blocked oil from Iran. China gets upwards of 90% of its oil from Iran. China is forging more relationships with Saudi Arabia for oil.
WTI oil is on the verge of breaking out to higher prices once again. Once over $88/$90, targets are up to $115. Once over $105, targets could be up to $155/$160. The chart remains bullish. Energy stocks are leading, as indicated on the Chart of the Week. NG continues to base. Over $3.50 targets could be up to $4.50. NG at the Dutch Hub is already pointed higher. Rising energy prices feed inflation. Only the complete end of hostilities could change this negative picture. However, the odds of that happening are next to zero.
Copyright David Chapman 2026
GLOSSARY
Trends
Daily – Short-term trend (For swing traders)
Weekly – Intermediate-term trend (For long-term trend followers)
Monthly – Long-term secular trend (For long-term trend followers)
Up – The trend is up.
Down – The trend is down
Neutral – Indicators are mostly neutral. A trend change might be in the offing.
Weak – The trend is still up or down but it is weakening. It is also a sign that the trend might change.
Topping – Indicators are suggesting that while the trend remains up there are considerable signs that suggest that the market is topping.
Bottoming – Indicators are suggesting that while the trend is down there are considerable signs that suggest that the market is bottoming.
Disclaimer
David Chapman is not a registered advisory service and is not an exempt market dealer (EMD) nor a licensed financial advisor. He does not and cannot give individualised market advice. David Chapman has worked in the financial industry for over 40 years including large financial corporations, banks, and investment dealers. The information in this newsletter is intended only for informational and educational purposes. It should not be construed as an offer, a solicitation of an offer or sale of any security. Every effort is made to provide accurate and completeinformation. However, we cannot guarantee that there will be no errors. We make no claims, promises or guarantees about the accuracy, completeness, or adequacy of the contents of this commentary and expressly disclaim liability for errors and omissions in the contents of this commentary. David Chapman will always use his best efforts to ensure the accuracy and timeliness of all information. The reader assumes all risk when trading in securities and David Chapman advises consulting a licensed professional financial advisor or portfolio manager such as Enriched Investing Incorporated before proceeding with any trade or idea presented in this newsletter. David Chapman may own shares in companies mentioned in this newsletter.Before making an investment, prospective investors should review each security’s offering documents which summarize the objectives, fees, expenses and associated risks. Although Artificial Intelligence (AI) may be deployed from time to time, AI output is monitored and adjusted, if necessary, for accuracy. David Chapman shares his ideas and opinions for informational and educational purposes only and expects the reader to perform due diligence before considering a position in any security. That includes consulting with your own licensed professional financial advisor such as Enriched Investing Incorporated. Performance is not guaranteed, values change frequently, and past performance may not be repeated.
About the author


Website: https://www.enrichedinvesting.com
Disclaimer: David Chapman is not a registered advisory service and is not an exempt market dealer (EMD) nor a licensed financial advisor. We do not and cannot give individualised market advice. David Chapman has worked in the financial industry for over 40 years including large financial corporations, banks, and investment dealers. The information in this newsletter is intended only for informational and educational purposes. It should not be considered a solicitation of an offer or sale of any security. The reader assumes all risk when trading in securities and David Chapman advises consulting a licensed professional financial advisor before proceeding with any trade or idea presented in this newsletter. David Chapman may own shares in companies mentioned in this newsletter. We share our ideas and opinions for informational and educational purposes only and expect the reader to perform due diligence before considering a position in any security. That includes consulting with your own licensed professional financial advisor.