
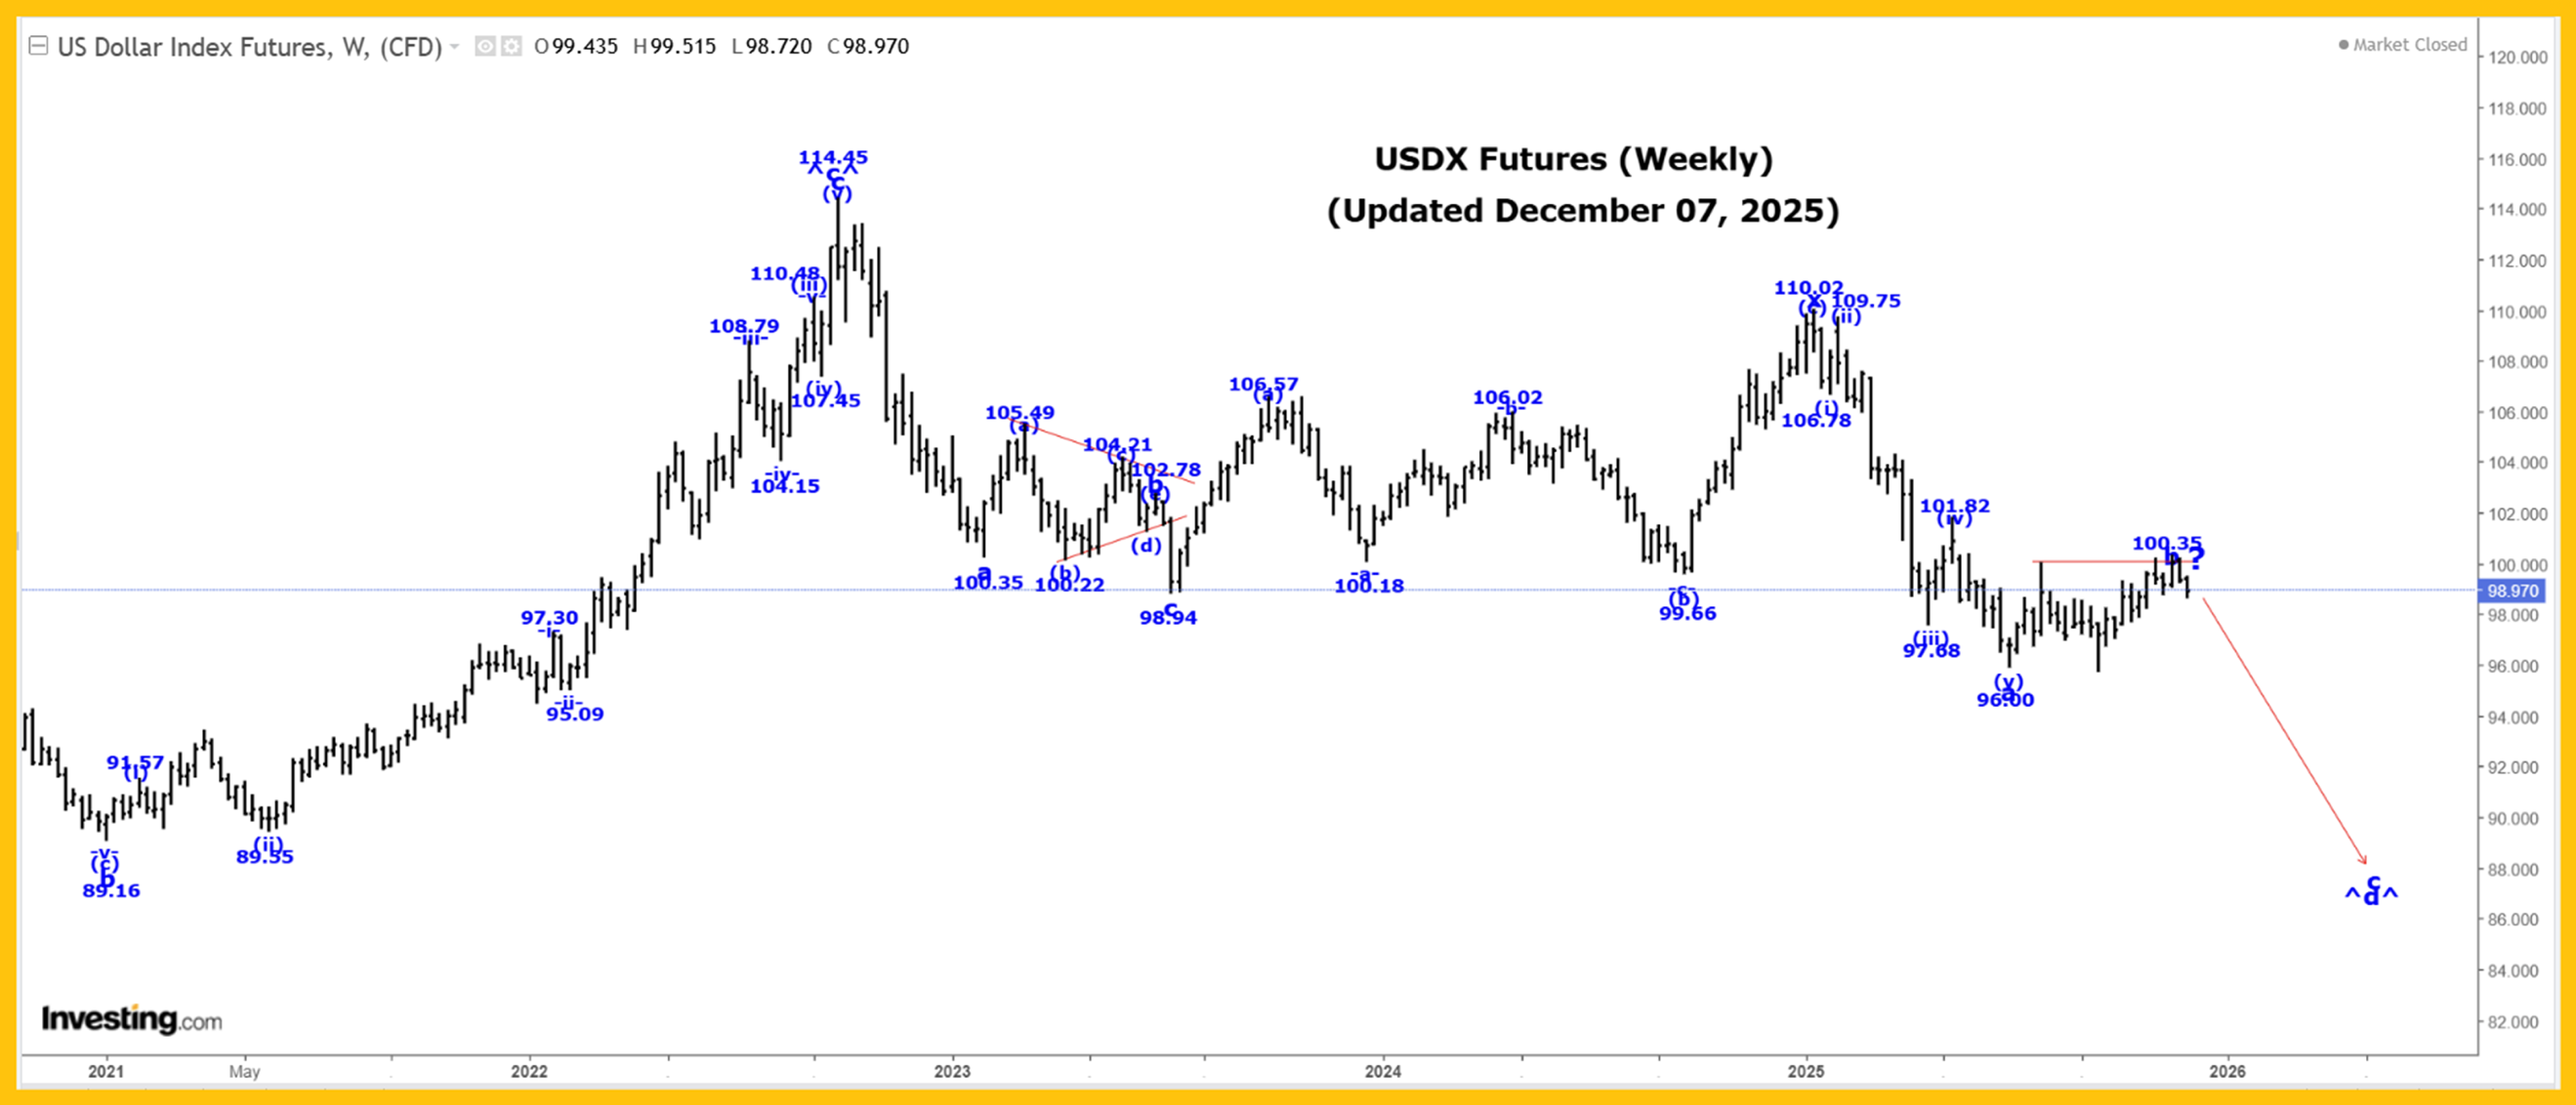
 The Captain’s weekly US dollar chart.
Analysis:
Long Term Update:
We continue to work on a very large wave B bearish triangle, and within that triangle, all of wave ^c^ ended at the 114.75 high.
We are now falling in wave ^d^.
Wave ^d^ cannot fall below the wave ^b^ low of 71.46 for this triangle formation to remain valid.
It needs to consist of at least one abc pattern, but can have up to three.
We have made a major revision to the internal wave structure of wave ^d^ and now believe that it will consist of at least 2 three-wave patterns as follows:
a = 100.35.
b triangle = 102.78.
c = 98.94.
x = 110.02
a = 96.00
b= 100.35, if complete.
c drop after wave b ends.
After second wave b ends, we expect another drop in second wave c.
Active Positions: Short, risking to 105.00!
Oil:
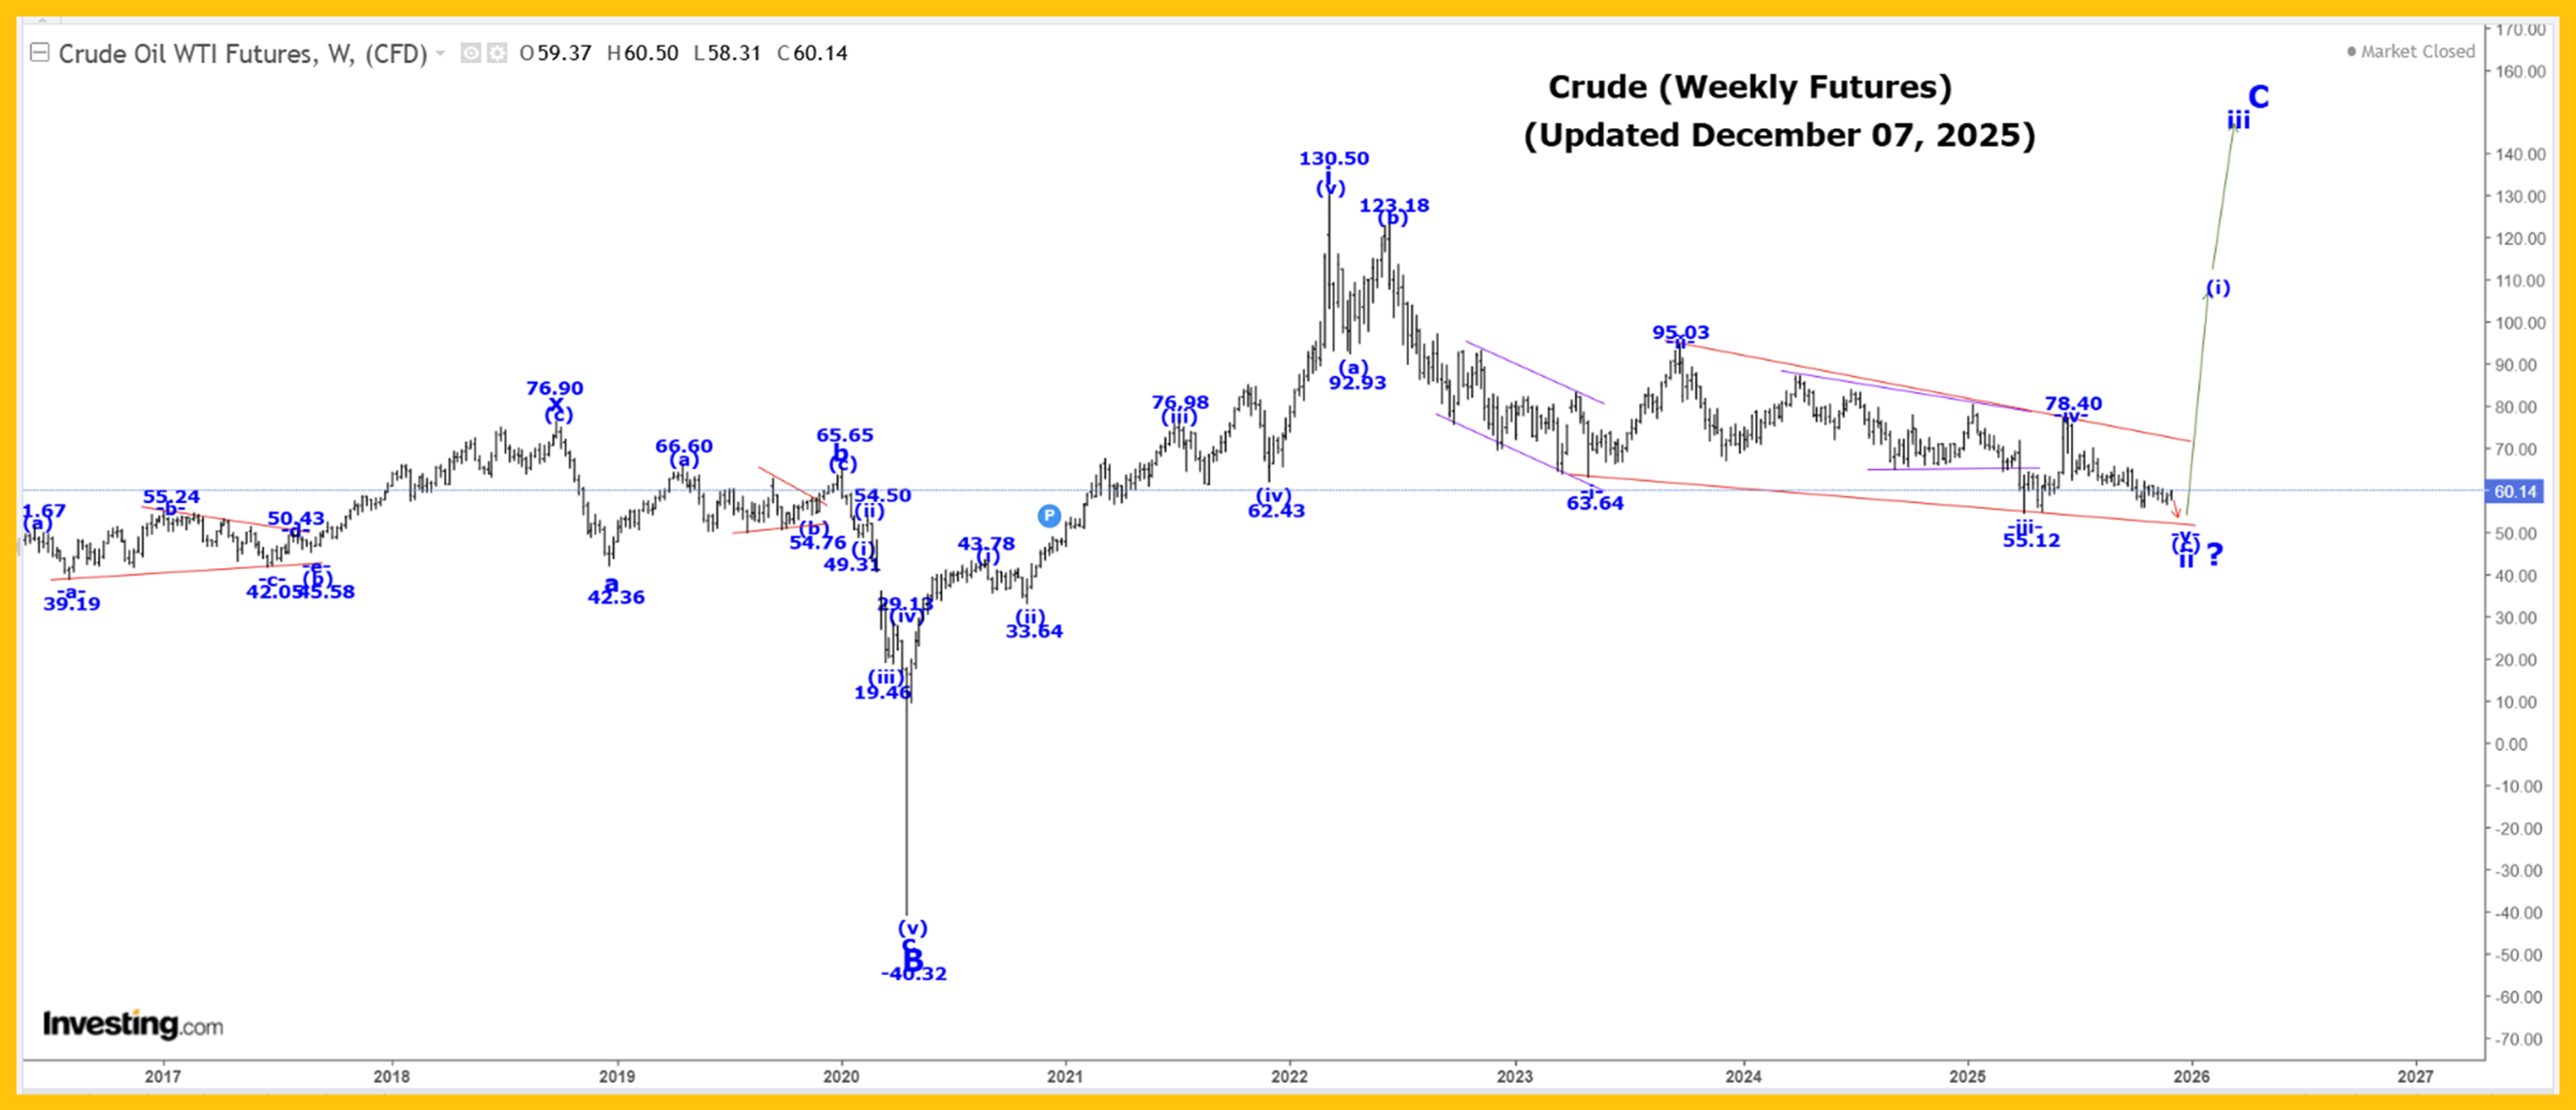 The Captain’s weekly oil chart.
Analysis:
Our internal wave count for wave ii to looks like:
(a) = 92.93.
(b) = 123.18.
(c) diagonal triangle:
-i- = 63.64.
-ii- = 95.03.
-iii- = 55.12.
-iv- = 78.40.
-v- is still underway, with a minimum target of 55.12.
It is looking like wave -v- may also be an ending diagonal triangle formation that remains incomplete.
After wave ii ends, we expect a very sharp rally higher in wave iii, and we will provide our projected endpoint for its completion after wave ii ends.
There is an outside chance that all of wave -v- and wave ii may have ended at the 55.98 low, with only a break of the 65.98 high confirming that to be the case.
In the long term, we are now rallying in wave C that has the following projections:
C = A = 153.77.
C = 1.618A = 244.78!
Suncor:
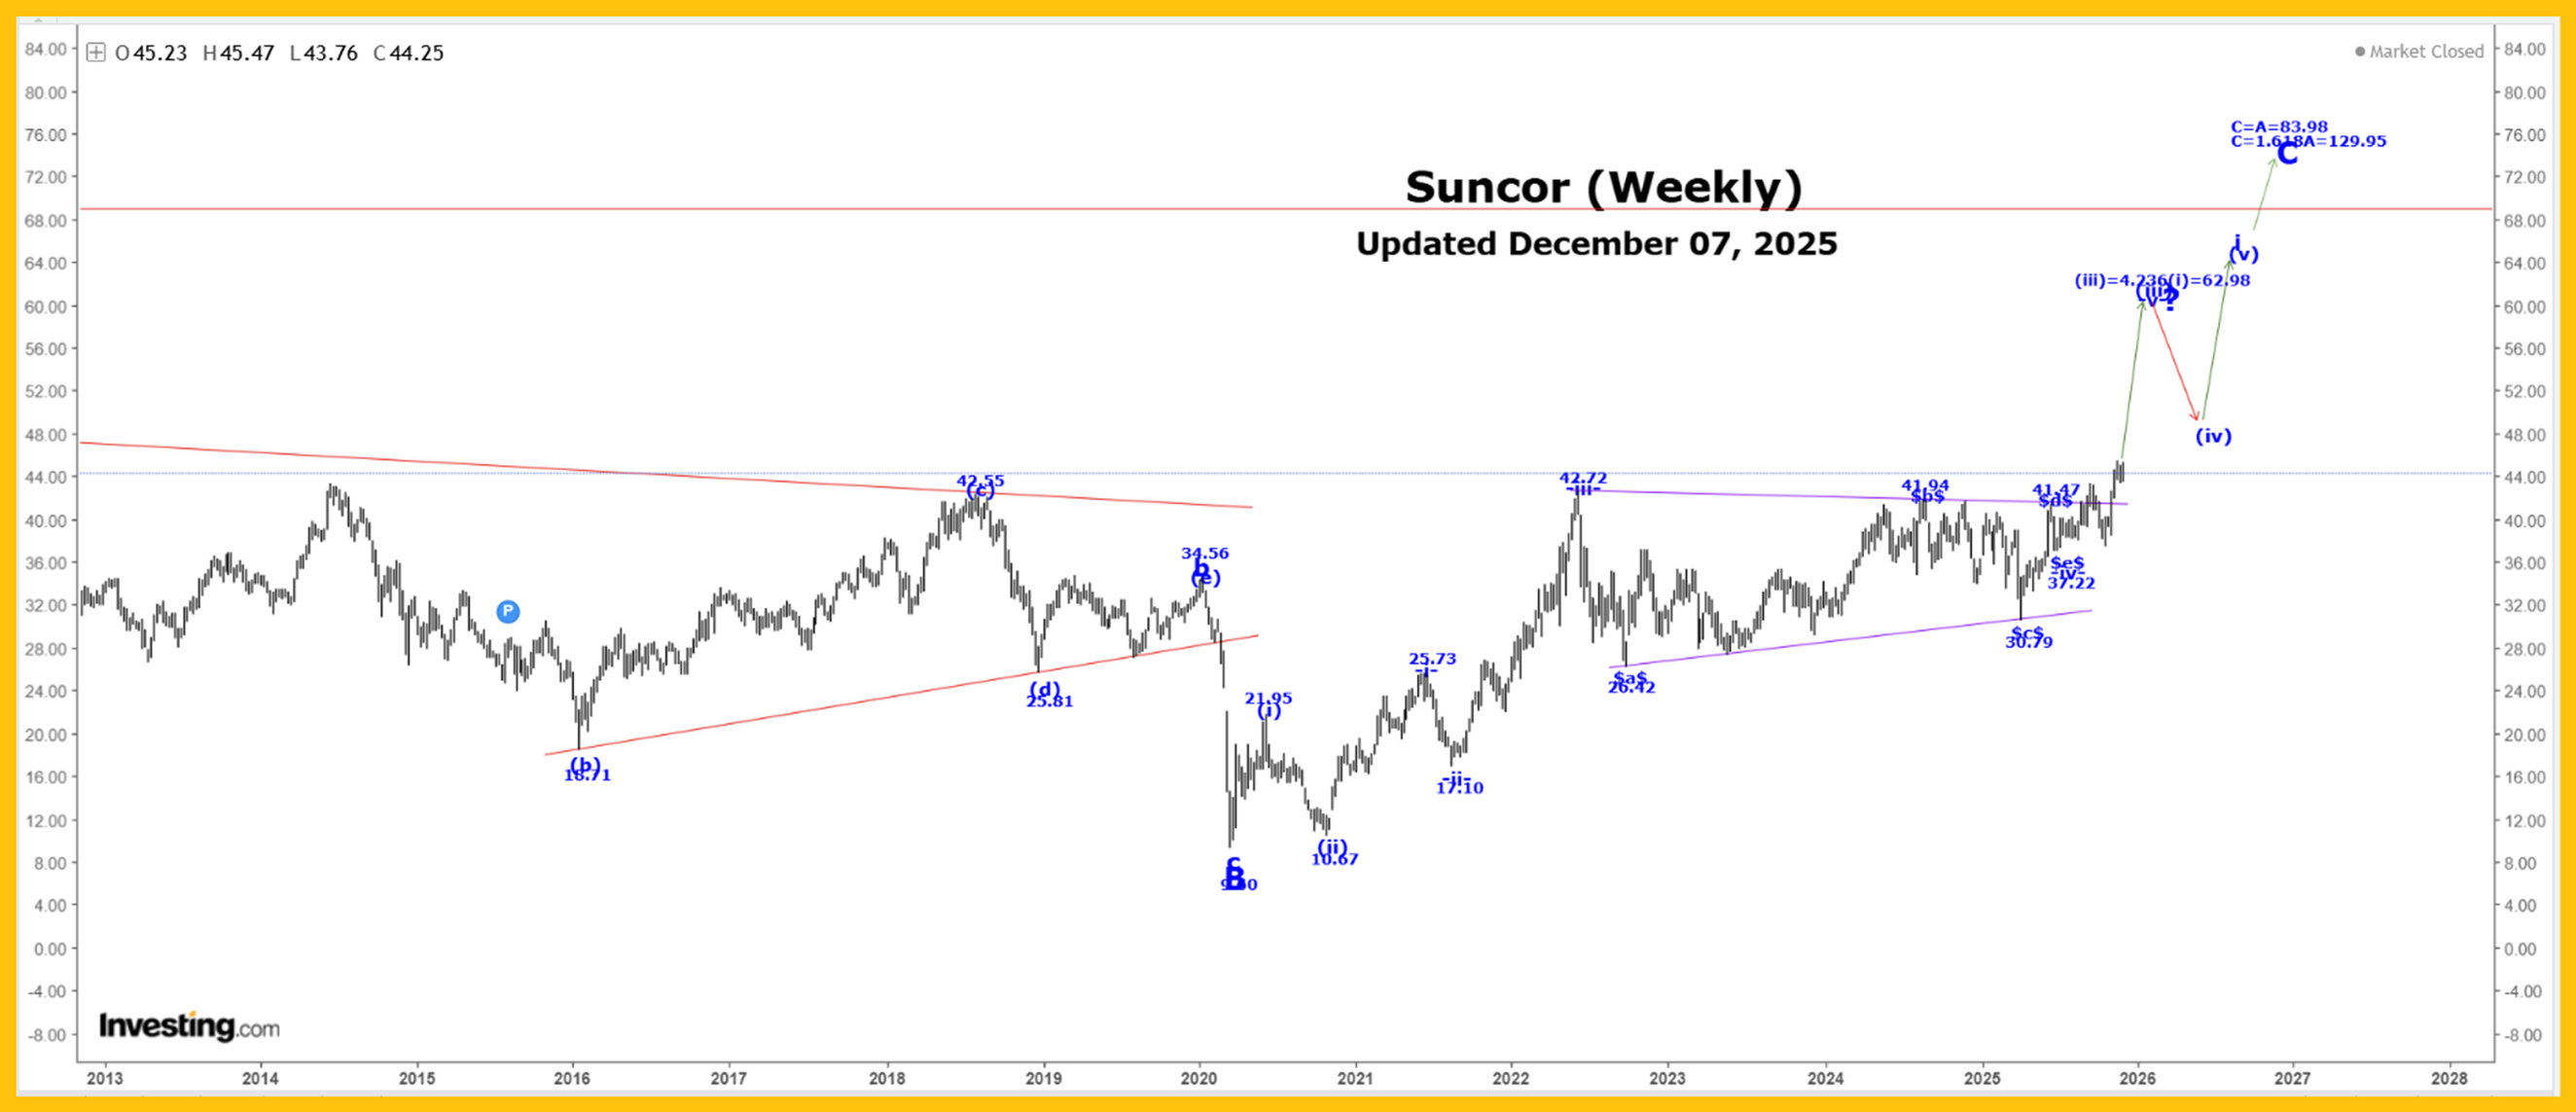
The Captain’s weekly Suncor chart.
Analysis:
It now looks like wave (iii) is going to extend higher to the next projected endpoint of:
(iii) = 4.236(i) = 62.98.
We expect higher prices as wave -v- of (iii) continues to develop.
Active Positions: Long crude, with puts as a stop. Long Suncor!
Gold:
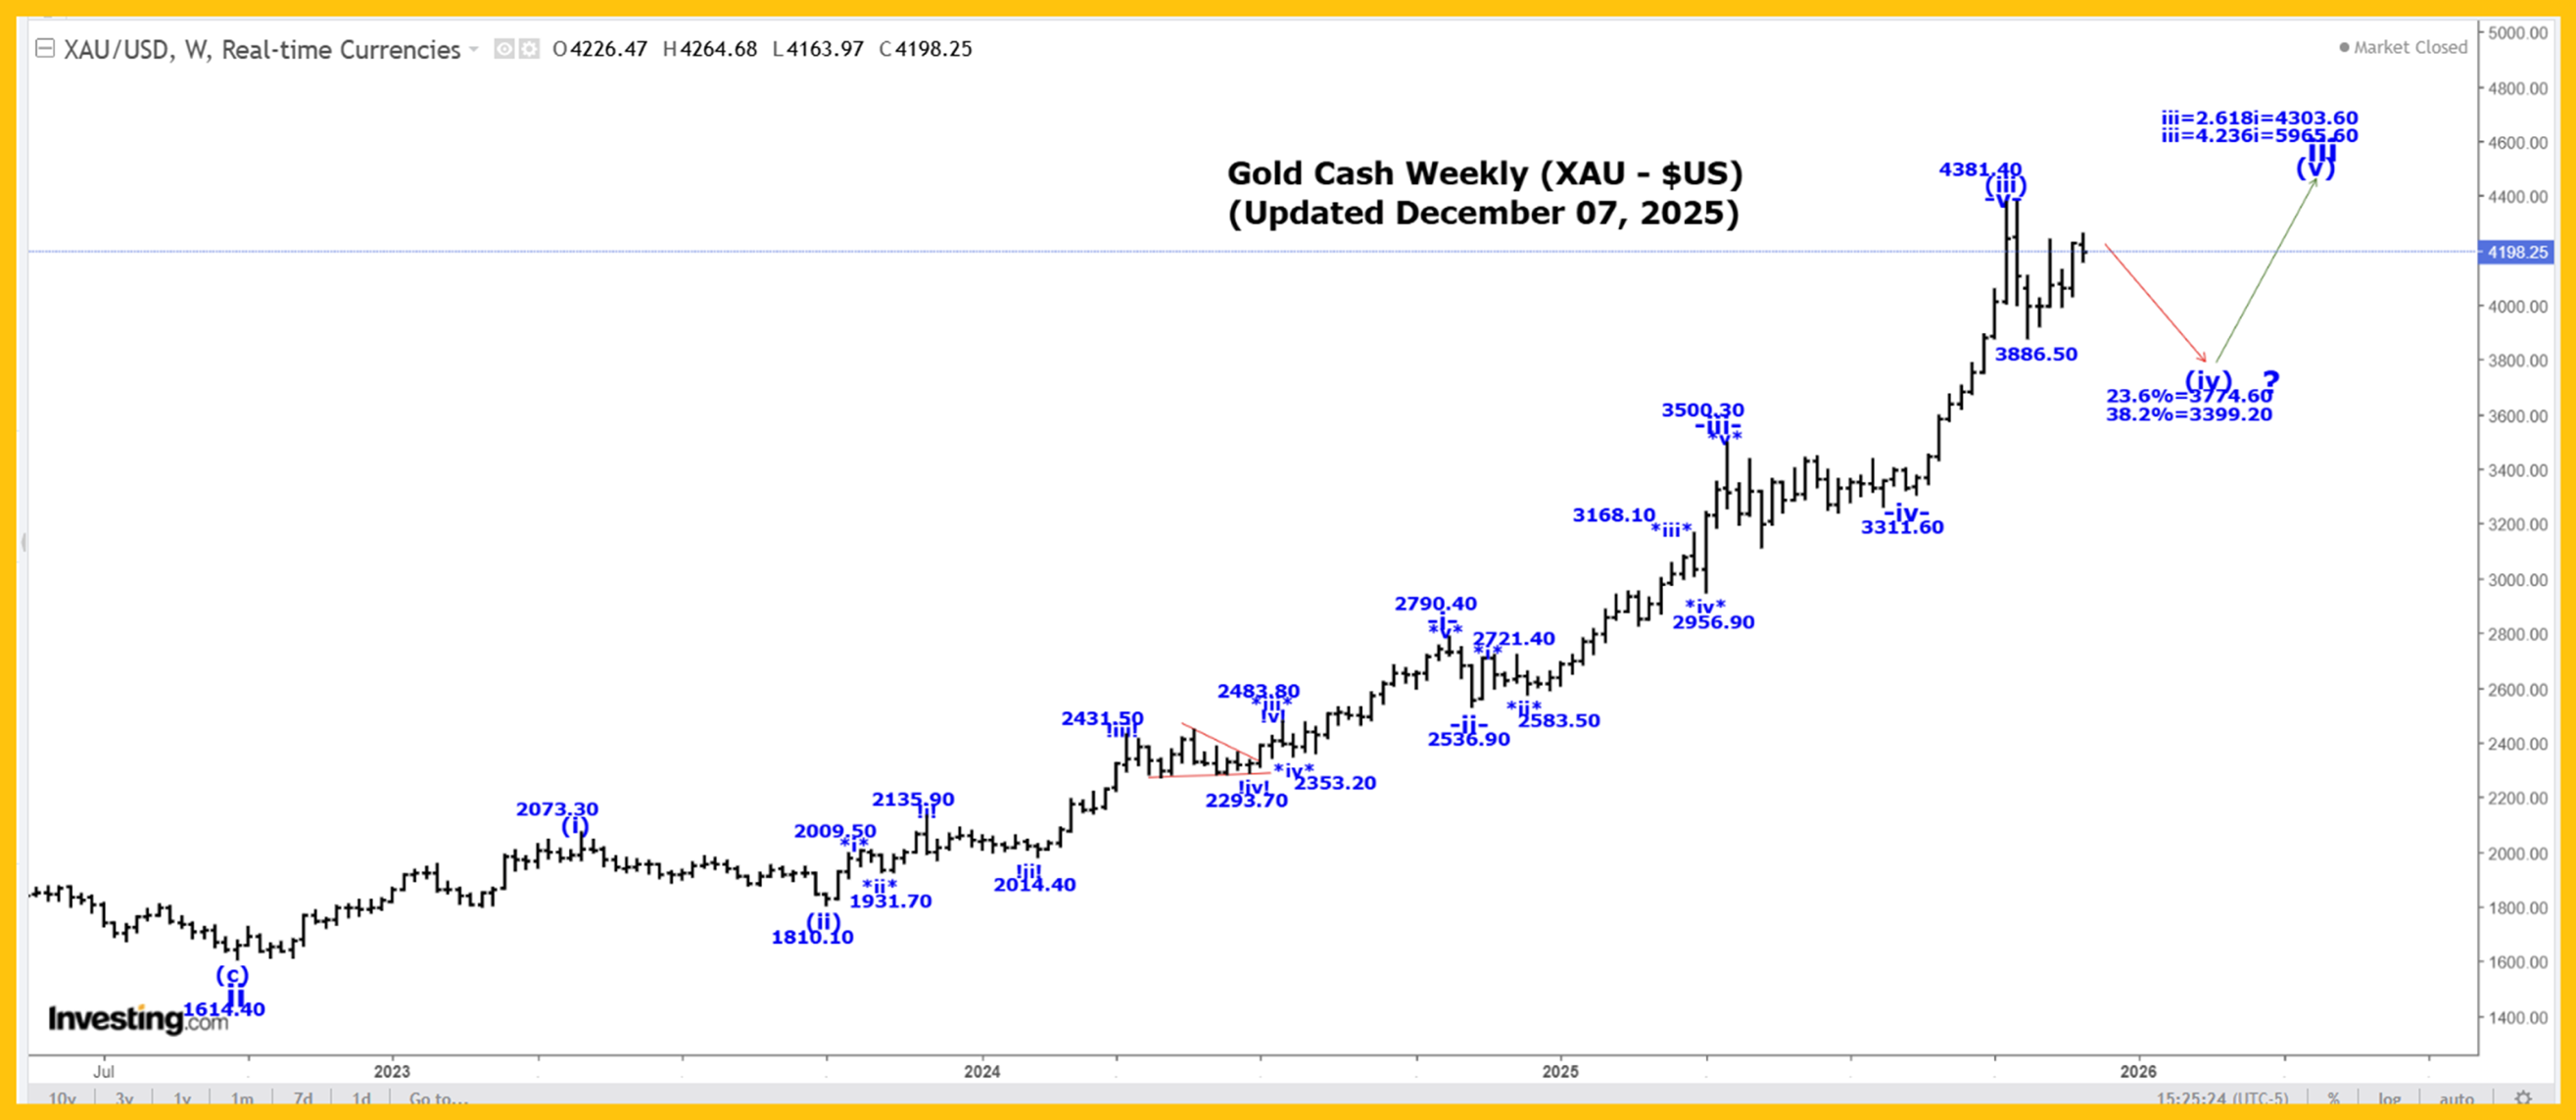 The Captain’s weekly gold chart.
Analysis:
We exited all long positions near the $4380 area highs. We entered these positions in late 2015. It’s not a top call. Our profits were so large that we had to book them… and we plan to re-enter the market at the end of “little wave b” with our biggest positions yet!
Here is our current long-term gold count starting from the 35.20 low made back in 1971:
1 = 1920.80.
2 = 1046.20.
3:
i = 2073.40.
ii = 1614.40.
iii:
(i) = 2073.30.
(ii) = 1810.10.
(iii):
-i- = 2790.40.
-ii- = 2539.90.
-iii- = 3500.30.
-iv- = 3280.60.
-v- = 4381.40, to complete all of wave (iii).
We are now falling into a multi-month wave (iv) correction that has the following retracement levels:
23.6% = 3774.60.
38.2% = 3399.20.
Within wave (iv) we completed wave -a- at the 3886.50 low and it now looks like wave -b- is still underway, although it could now be complete at the 4265.70 high. After wave -b- ends, we expect another drop in wave -c-. For the time being, we are assuming that wave (iv) is becoming a bullish triangle, and therefore wave -c- cannot fall below the wave -a- low of 3886.05.
The other option is that wave -b- is going to become more complex, and in this case, wave (iv) could still become a flat or irregular type correction, where in the latter formation, gold will make another all-time high in wave -b-, before it falls again into our suggested retracement zone.
We still expect that wave (iv) is going to take many more months to develop.
A projection for the end of wave iii is:
iii = 4.236i = 5965.60.
Projections for the end of wave 3 are:
3 = 2.618(1) = 5936.00.
3 = 4.236(1) = 9033.60.
Active Positions: Flat!
Thank-you!
About the author
