
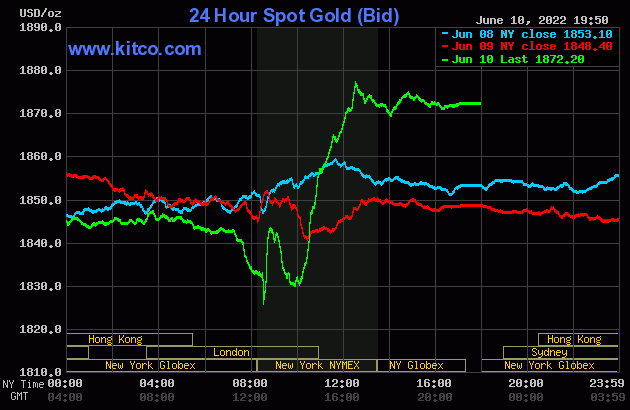
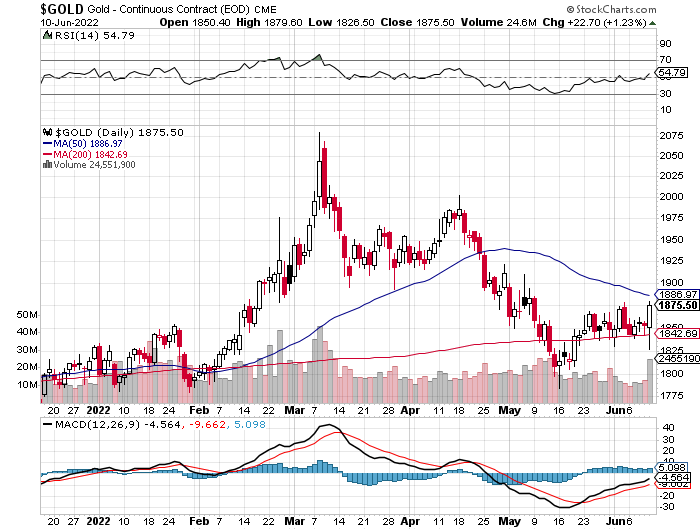
The gold price crawled quietly lower in GLOBEX trading in the Far East and London -- and that lasted until shortly after the noon BST silver fix. At that juncture some very serious price pressure commenced, which lasted until about one minute after the latest inflation numbers hit the tape at 8:30 a.m. in Washington. That was its low tick of the day -- and it blasted higher from there, but was capped fifteen minutes later -- and then sold down pretty hard going into the 10 a.m. EDT afternoon gold fix in London. Minutes after that it took off higher until it ran into 'something' at exactly 12:30 p.m. EDT. It then had a quiet down/up/down move going into the 5:00 p.m. close.
The low and high ticks in gold were recorded by the CME Group as $1,826.50 and $1,879.60 in the August contract. The June/August price spread differential in gold at the New York close yesterday was $4.00...August/October was $8.40 -- and October/December was $10.00 an ounce.
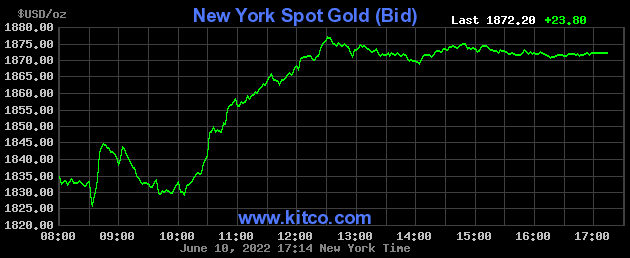
Gold was closed on Friday afternoon in New York at $1,872.20 spot, up $23.80 from Thursday. Net volume was super heavy, relatively speaking, at 244,000 contracts -- and there was a bit under 16,000 contracts worth of roll-over/switch volume out of August and into future months...mostly October and December, but also a bunch into the early delivery months of next year as well.
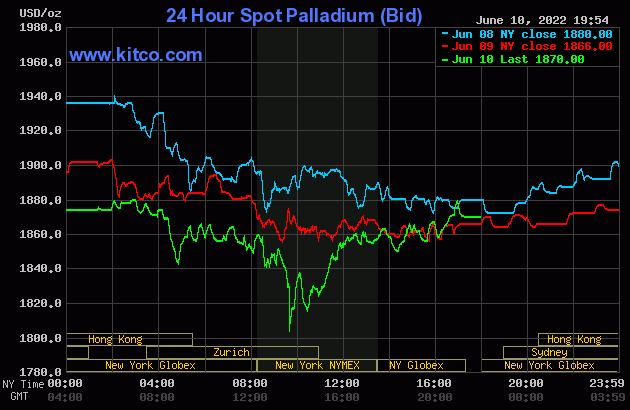
And here's the New York Spot Gold [Bid] chart from Kitco, so you can see this price action in far more detail. The silver chart for this time period is identical. Click to enlarge.
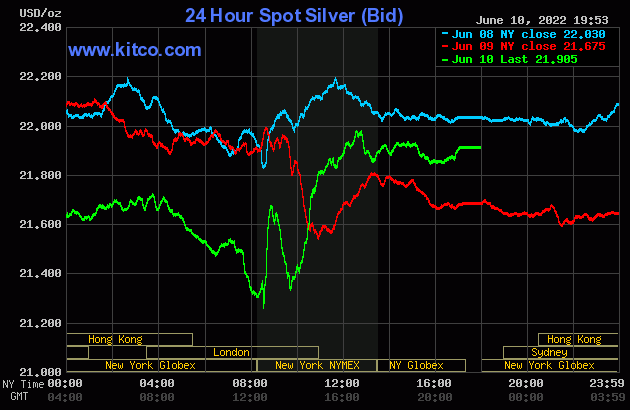
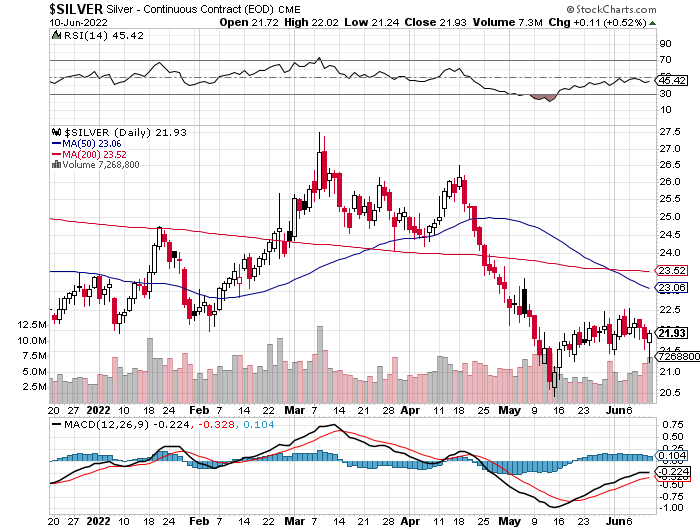
The silver price wandered very quietly sideways until shortly before 9 a.m. in London -- and shortly after that the big price pressure appeared and, like gold, its low was set at 8:31 a.m. in COMEX trading in New York...a minute after the inflation numbers showed up. After that, its price was managed in a similar fashion as gold's...including running into 'something' at 12 o'clock noon EDT. It was sold down a bit from there -- and then crept quietly and a bit unevenly sideways until trading ended at 5:00 p.m.
The low and high ticks in silver were reported as $21.235 and $22.02 in the July contract. The July/September price spread differential at the close in New York yesterday was 9.3 cents -- and September/December was 18.3 cents an ounce.
Silver was closed in New York on Friday afternoon at $21.905 spot, up 23 cents from its close on Thursday. Net volume was pretty hefty, relatively speaking, at just about 57,500 contracts -- and there was a bit under 20,500 contracts worth of roll-over/switch volume out of July and into future months...mostly into September and December.
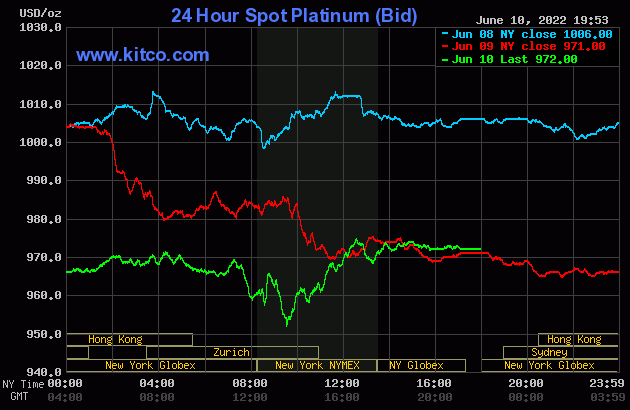
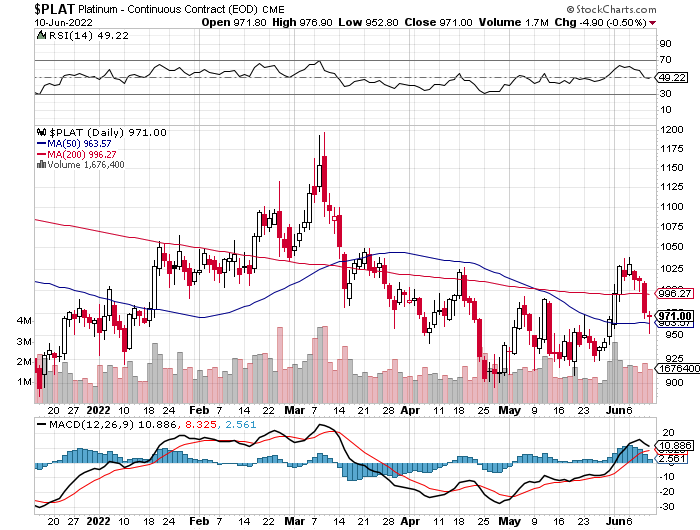
Platinum had a quiet and very broad up/down move until shortly after the noon silver fix in London -- and it was then sold lower until around 9:35 a.m. in New York. It was then allowed to rally until around 12:25 p.m. EDT -- and didn't do much of anything after that. Platinum was closed at $972 spot, up a dollar on the day.
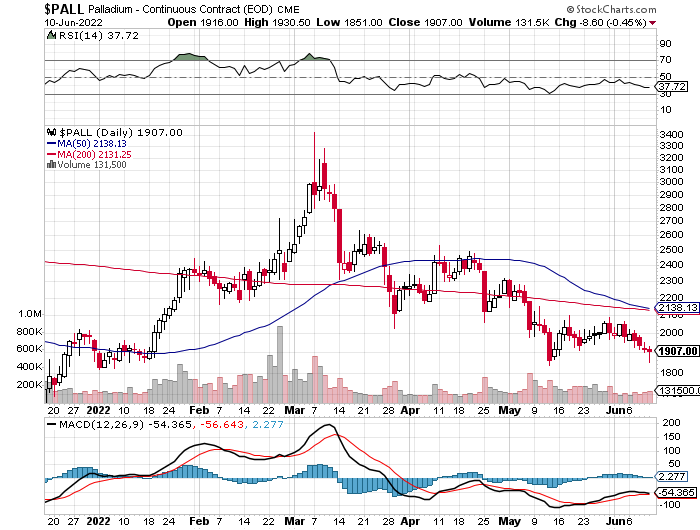
Palladium stair-stepped its way very quietly higher until the Zurich open. It ran into selling pressure at that point -- and its low tick was set about 9:40 a.m. in New York, about five minutes after platinum's low tick was set. It was allowed to rally a decent amount until around 1 p.m. EDT -- and then chopped a bit higher going into the 5:00 p.m. EDT close. Palladium was closed at $1,870 spot, up 4 bucks from Thursday.
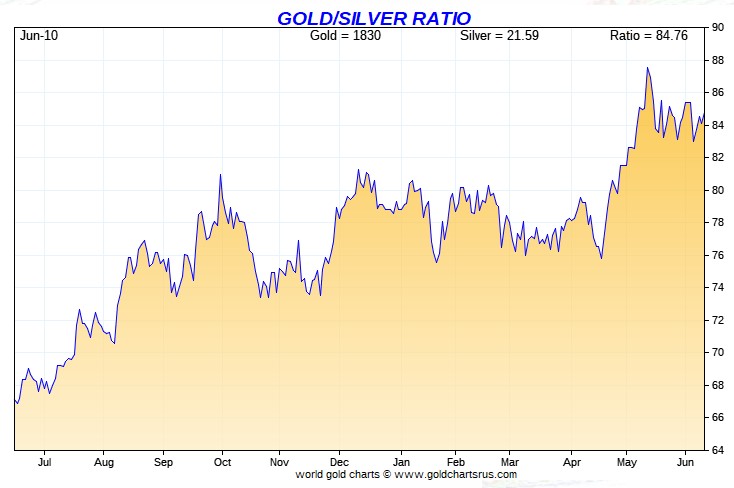
Based on the kitco.com spot closing prices in silver and gold posted above, the gold/silver ratio worked out to 85.5 to 1 on Friday...compared to 85.3 to 1 on Thursday.
Here's the 1-year Gold/Silver Ratio Chart, courtesy of Nick Laird's website. For whatever reason, Nick's computed 85.45 to 1 closing gold/silver ratio on Friday, doesn't appear on this chart. Click to enlarge.
![]()
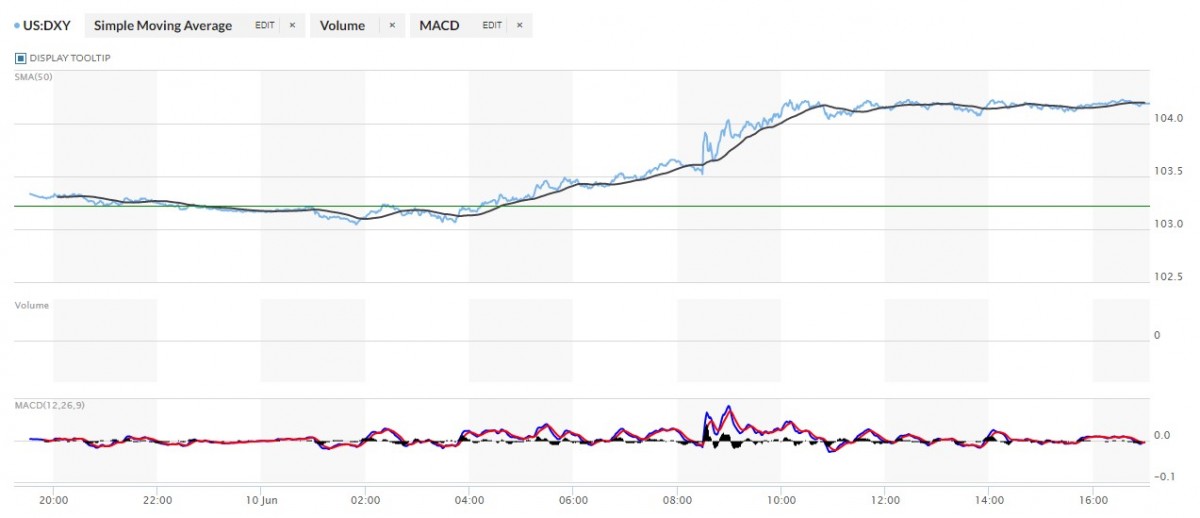
The dollar index closed very late on Thursday afternoon in New York at 103.22 -- and then opened higher by 12 basis points once trading commenced around 7:33 p.m. EDT on Thursday evening, which was 7:33 a.m. China Standard Time on their Friday morning. From that juncture it began to creep very quietly lower until a 'rally' commenced starting at 8:43 a.m. in London...which was silver's high tick in GLOBEX trading overseas. That lasted until 10:10 a.m. in New York -- and from there it didn't do a whole heck of a lot until the market closed at 5:00 p.m. EDT.
The dollar index finished the Friday trading session in New York at 104.19...up 97 basis points from its close on Thursday.
Here's the DXY chart for Friday, thanks to marketwatch.com as usual. Click to enlarge.
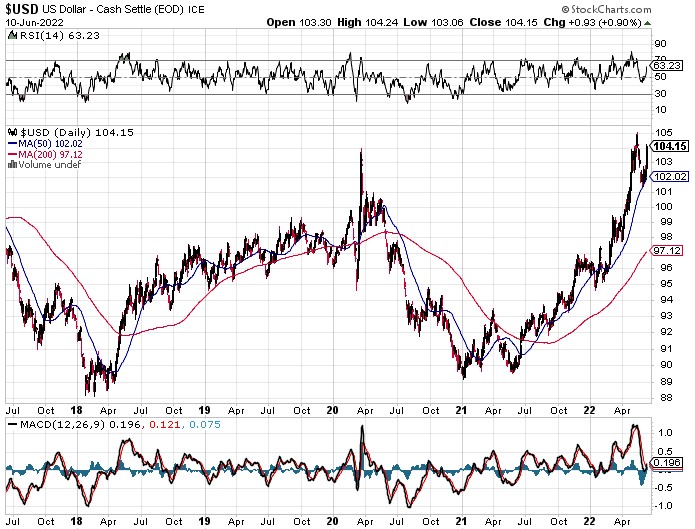
And here's the 5-year U.S. dollar index chart that appears in this spot in every Saturday column. The delta between its close...104.15...and close on the DXY chart above yesterday, was about 4 basis points below its indicated spot close. Click to enlarge.
![]()
It takes a real stretch of one's imagination to see any correlation between the currencies and precious metal prices on Friday. Precious metals pricing was strictly a GLOBEX/COMEX futures market affair once again -- and the so-called 'rally' in the DXY looked totally manufactured to me.
U.S. 10-Year Treasury: 3.1460%...up 0.1020 (+3.35%)...as of 01:31 p.m. EDT
Here's the 5-year 10-year U.S. Treasury chart from the yahoo.com Internet site -- and it puts the yield curve into a somewhat longer-term perspective. Click to enlarge.
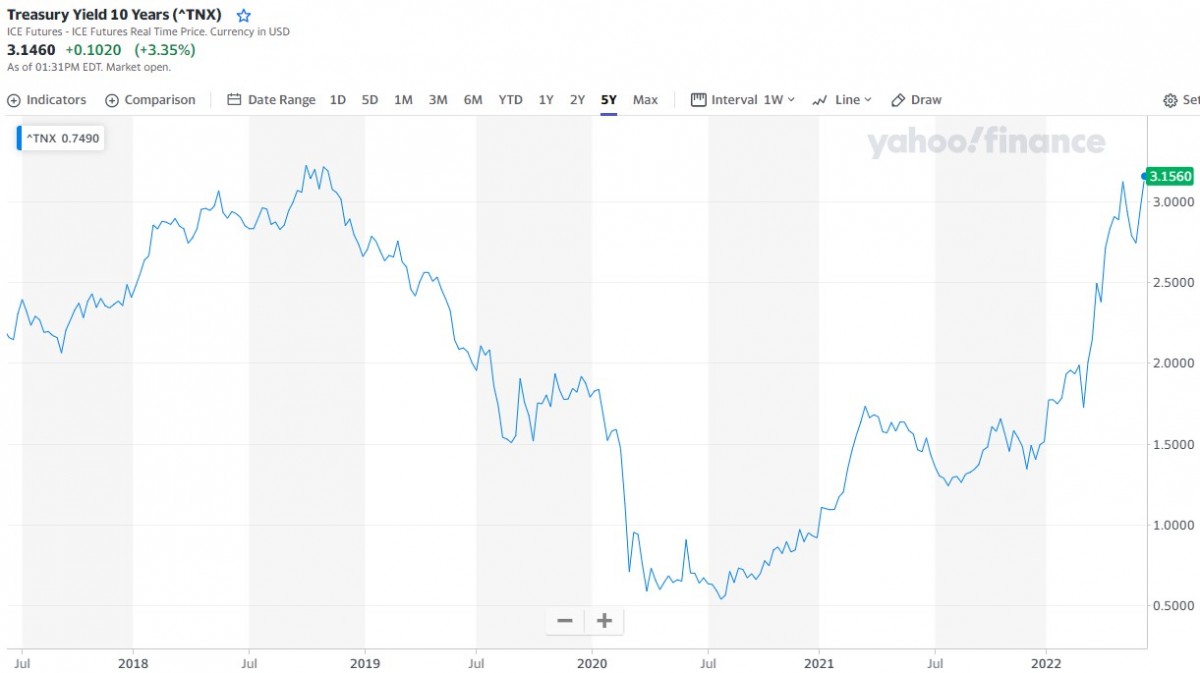
With U.S. interest rates going up at least another 50 basis points at next week's FOMC meeting, it remains to be seen just how fast they start rolling maturing treasuries off their books. Their official start date was Wednesday, June 1...but I've heard little news about it so far since then. They've already stated how they're going to proceed...but will they actually do what they say now that the time has come? And if they do keep their word, how long will it be before something 'breaks' in the financial markets? When it does, one has to wonder what they'll do then. The Fed, as they say "is trapped"...but I suspect that they've put themselves in this spot deliberately.
![]()
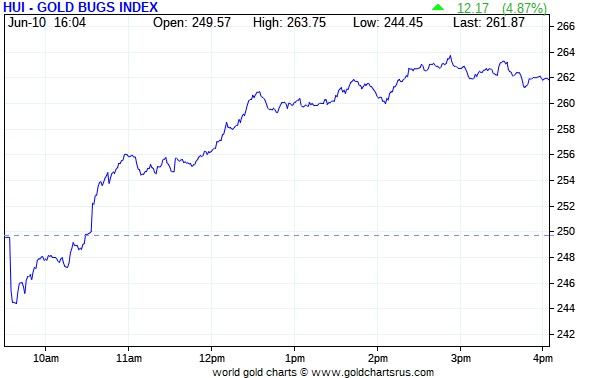
The gold shares were sold down a bit once trading began in New York on Friday morning, but turned higher minutes later -- and that rally lasted until a few minutes before 3 p.m. They then sagged a hair going into the 4:00 p.m. EDT close. The HUI closed up 4.87 percent.
Computed manually, Nick Laird's Intraday Silver Sentiment/Silver7 Index closed higher by 5.14 percent...dragged down a bit by Peñoles.
And here's Nick's 3-year Silver Sentiment/Silver 7 Index that appears in every Saturday column. Click to enlarge.
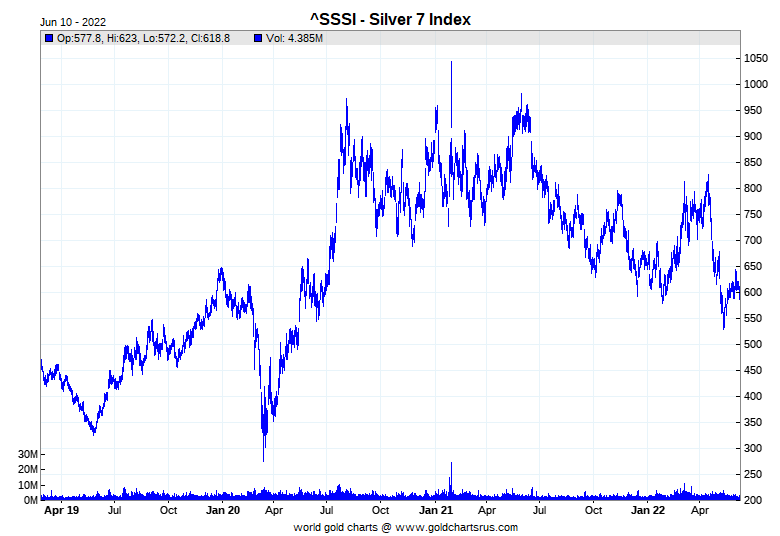
The two biggest stars yesterday were Hecla and Coeur Mining, as they closed higher by 7.36 and 7.14 percent respectively. The underperformer was the aforesaid mentioned Peñoles, as it closed unchanged, but only on 700 shares traded. Computing the index without them, the Silver 7 closed up 5.99 percent.
The latest silver eye candy from the reddit.com/Wallstreetsilver crowd is linked here.
![]()
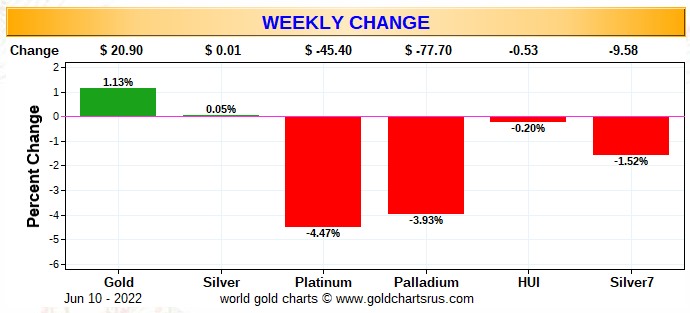
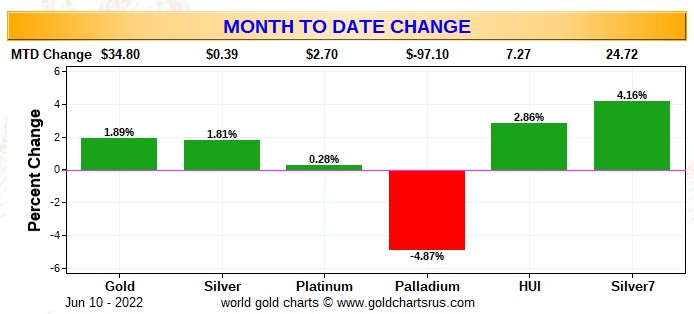
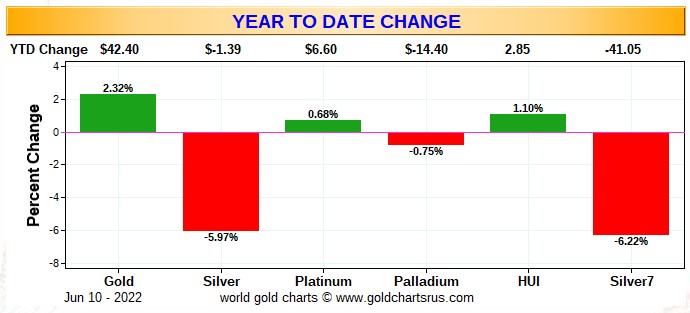
Here are the usual three charts that show up in every weekend missive. They show the changes in gold, silver, platinum and palladium in both percent and dollar and cents terms, as of their Friday closes in New York — along with the changes in the HUI and the Silver 7 Index.
Here's the weekly chart -- gold and silver finished higher for the week...silver only by a whisker. Their respective equities closed down, despite the big up day we had on Friday. Both platinum and palladium were brutalized. Click to enlarge.
Here's the month-to-date chart -- and except for the pounding that palladium has been getting so far in June, it's still green across the board. The silver equities are doing a bit better, relatively speaking, than their golden cousins. Click to enlarge.
Here's the year-to-date chart. Gold and its equities are certainly 'outperforming', relatively speaking. Everything silver-related continues to suck wind -- and that's solely because the silver price is still being held about $1.60 below its 200-day moving average -- and $1.15 below its 50-day. Gold is already back above its 200-day by about 53 bucks. Click to enlarge.
Of course what happens going forward continues to be in the hands of the commercial traders of whatever stripe, as they alone...as you know all too well, either directly or indirectly control the prices of everything precious metals-related...until they don't.
![]()
The CME Daily Delivery Report showed that 200 gold and 12 silver contracts were posted for delivery within the COMEX-approved depositories on Wednesday.
In gold, the sole short/issuer was Australia's Macquarie Futures out of its house account -- and the only one of the eleven long/stoppers that mattered was JPMorgan, as they picked up 172 contracts for their client account.
In silver, the two short/issuers were ADM and Morgan Stanley, with 10 and 2 contracts out of their respective client account -- and the only long/stopper that mattered was ADM, as they picked up 11 of those contracts for their client account.
The link to yesterday's Issuers and Stoppers Report is here.
So far in June, there have been 22,053 COMEX gold contracts issued/reissued and stopped -- and that number in silver is 1,615 contracts. In platinum and palladium in June there have been 61 contracts issued and stopped in the former -- and 165 contracts in the latter.
JPMorgan continues to dominate the delivery process in both gold and silver this month...and every month. In gold for June, they've issued 14,451 contracts of the total deliveries from their client account -- and stopped 12,468 COMEX contracts for clients as well. In silver, they've issued 1,464 COMEX contracts of June's total so far -- and stopped 651...with all contracts involving their respective client accounts too.
The CME Preliminary Report for the Friday trading session showed that gold open interest in June increased by 222 COMEX contracts, leaving 1,960 still open, minus the 200 contracts mentioned a few paragraphs ago. Thursday's Daily Delivery Report showed that 28 gold contracts were actually posted for delivery on Monday, so that means that 222+28=250 more gold contracts were added to the June delivery month. Silver o.i. in June dropped by 2 contracts, leaving just 78 left, minus the 12 contracts mentioned a few paragraphs ago. Thursday's Daily Delivery Report showed that 15 silver contracts were actually posted for delivery on Monday, so that means that 15-2=13 more silver contracts were added to June deliveries.
Total gold open interest at the close on Friday increased by a very hefty 14,934 COMEX contracts -- and total silver o.i. declined by 1,700 contracts...with both numbers subject to some revision by the time the final figures are posted on the CME's website on Monday morning CDT.
![]()
There was another deposit into GLD yesterday, as an authorized participant added 111,896 troy ounces of gold -- and another 5,959 troy ounces of gold was added to GLDM as well. But after a deposit into SLV on Thursday, there was a withdrawal of about the same amount on Friday, as an a.p. took out 830,407 troy ounces of silver.
In other gold and silver ETFs and mutual funds on Planet Earth on Friday, net of any changes in COMEX, GLD, GLDM & SLV inventories, there was a net 155,762 troy ounces of gold taken out...but a net 40,177 troy ounces of silver was added.
There was no sales report from the U.S. Mint yet again on Friday -- and all they've sold month-to-date in June is the 2,500 one-ounce 24K gold buffaloes they reported sold earlier this week.
As you already know, the mint is producing far, far below what it's capable of -- and that's for the same reason as always...they don't want to exacerbate the already critical shortage of silver in the wholesale good delivery bar market. However, that hasn't slowed down the other sovereign and private mints one bit.
![]()
There was very decent activity in gold over at the COMEX-approved depositories on the U.S. east coast on their Thursday. Nothing was reported received, but 164,572 troy ounces was shipped out.
The largest 'out' amount was the 161,058 troy ounces that departed JPMorgan. Way down in second place was the 2,806 troy ounces that was shipped out of Manfra, Tordella & Brookes, Inc. Two other depositories also shipped out a bit of gold, but their amounts were so small, I'm not going to waste my time itemizing them.
There was no paper activity -- and the link to all of Thursday's COMEX gold activity is here.
There was a bit of activity in silver. All of the 'in' amount, one truckload...566,832 troy ounces...ended up at JPMorgan. There was only 154,347 troy ounces shipped out. The largest amount was the 129,519 troy ounces that left Manfra, Tordella & Brookes, Inc...followed by the 23,809 troy ounces that departed Brink's, Inc. The remaining 1,018 troy ounces/one good delivery bar, was shipped out of Delaware.
There was no paper activity here, either -- and the link to Thursday's COMEX silver activity is here.
There was some activity over at the COMEX-approved gold kilobar depositories in Hong Kong on their Thursday. They reported receiving 600 of them -- and shipped out 751 kilobars. Except for the 96 kilobars that departed Loomis International, the remaining in/out activity took place over at Brink's, Inc. as always. The link to that, in troy ounces, is here.
![]()
Here are the usual 20-year charts that show up in this space in Saturday's column. They show the total amount of physical gold and silver held in all know depositories, ETFs and mutual funds as of the close of business on Friday.
During the week just past, there was a net 702,000 troy ounces of gold removed -- and a net 5,852,000 troy ounces of silver was removed as well. Click to enlarge.
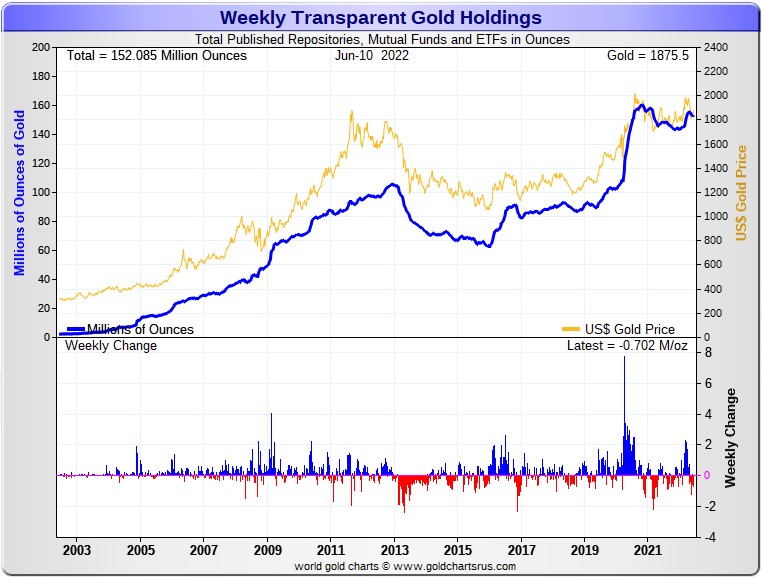
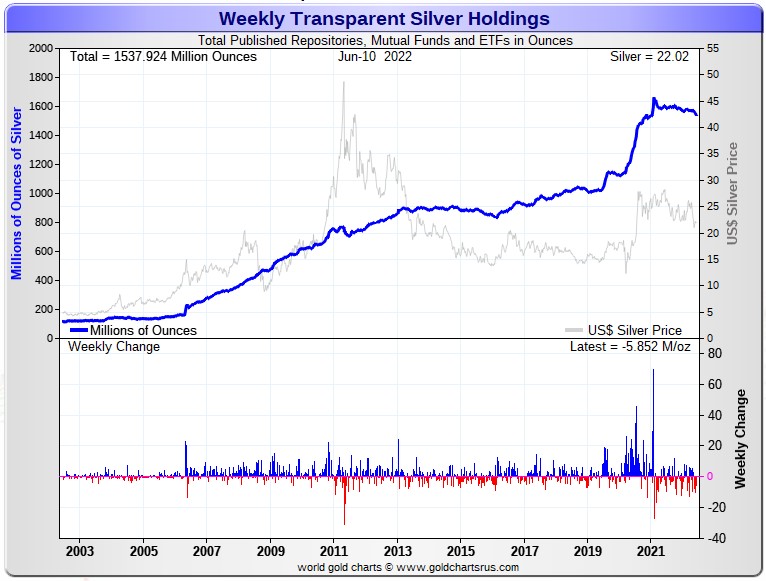
In gold, the withdrawals were mostly COMEX-related, as the amount in GLD actually rose during the reporting week, although a decent amount also got removed in other gold and silver ETFs and mutual funds. The decline in silver was the result of withdrawals from SLV, plus the big 4+ million troy ounces that came out of SIVR the other day. The rest of the world ETFs and mutual funds showed decent amounts added.
The physical shortage in silver on both a wholesale and retail level continues -- and although retail silver demand isn't quite what it used to be, it's still very decent from what I've heard.
Delivery times from the various sovereign and private mints is still many weeks for some forms of retail silver -- and that fact is probably not going to change anytime soon. And when this silver rally really grows some 'legs'...it won't be too long before dealers get cleaned out again -- and big shortages will reappear.
![]()
The Commitment of Traders Report, for positions held at the close of COMEX trading on Tuesday, showed no change in the commercial net short position in gold, but a rather steep increase in the Commercial net short position in silver.
In silver, the Commercial net short position increased by 4,129 COMEX contracts, or 20.7 million troy ounces of the stuff...but that increase was all because of Ted's raptors selling long positions, not because the Big 8 increased their short position during the reporting week...big difference.
They arrived at that number by reducing their long position by 1,740 COMEX contracts -- and also added 2,389 short contracts. It's the sum of those two numbers that represents their change for the reporting week.
Under the hood in the Disaggregated COT Report, it was mostly Managed Money traders that made up the change, as they increased their net long position by 3,781 COMEX contracts -- and that was mostly by reducing their gross short position by 4,115 contracts. The Nonreportable/small traders also increased their net long position by a bit...722 contracts...while the Other Reportables were net sellers, decreasing their net long position by 374 contracts.
Ted said that the big reduction in the gross short position in the Managed Money category, was short covering by one of the two Managed Money traders that inhabited the Big '5 through 8' short category. Because of that, he feels that there's only one Managed Money trader left in the Big '5 through 8' category -- and none in the Big 4.
Doing the math: 3,781 plus 722 minus 374 equals 4,129 COMEX contracts, the change in the Commercial net short position.
The Commercial net short position in silver now sits at 140.0 million troy ounces...up 20.7 million troy ounces from the 119.3 million troy ounces that they were short in last Friday's COT Report...which is obviously the headline number change mentioned further up.
The Big 8 are short 344.0 million troy ounces in this week's COT Report, down 8.0 million troy ounces from the 352.0 million troy ounces they were short in last Friday's COT Report. All of that change would have been the result of that one Managed Money trader in the Big '5 though 8' category covering short positions. Because of that, Ted was of the opinion that the Big 8 commercial shorts didn't do much of anything during the reporting week, as it was all raptor selling.
As mentioned a few paragraphs ago, the Big 8 short position is not a pure commercial trader number because it's Ted's opinion that there is now only one Managed Money trader left with a short position large enough to be in that category...but only in the Big '5 through 8'.
The headline change in the Commercial net short position above showed a increase of 20.7 million troy ounces. So the math says Ted's raptors, the small commercial traders other than the Big 8 shorts did all of selling/profit taking during the reporting week...as they decreased their long position by 20.7+8.0=28.7 million troy ounces...5,740 COMEX contracts.
But this is a slightly contaminated number as well, but only by a tiny amount -- and doesn't quite convey what happened during the reporting week for the Big 8 commercial shorts...or the raptors. However, the amount is now approaching insignificance.
Always remember that despite their small size, Ted's raptors are still commercial traders in the commercial category.
The Big 8 are short 344.0/140.0 equals about 245 percent of the Commercial net short position in silver, down from the 295 percent they were short in last week's COT Report -- and all because of those long contracts sold by Ted's raptors during the reporting week. This number is distorted to the upside as well -- and for reasons already given, but by an ever decreasing amount. I'll have a bit more about this in the 'Days to Cover' commentary further down.
Ted said that more realistic back-of-the-envelope calculation would show a Big 8 commercial net short position of around 325 million troy ounces -- and not the 344.0 million troy ounces show in the previous paragraph -- and a few paragraphs further up. The difference between these two just-mentioned numbers is about the number of ounces that the one remaining Managed Money trader is short in the Big '5 through 8' category.
Here's the 3-year COT chart for silver, courtesy of Nick Laird as always -- and this week's change should be noted. Click to enlarge.
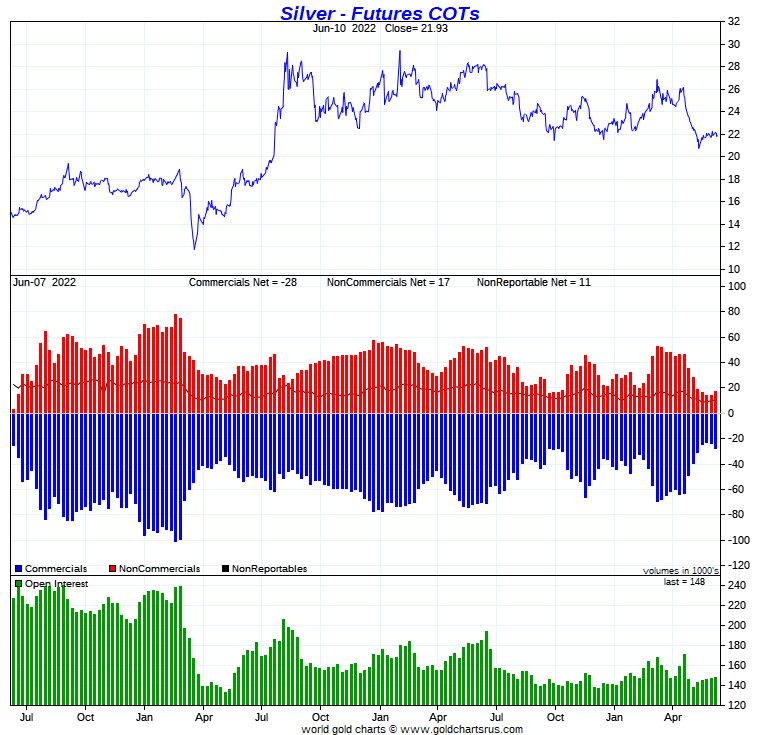
As I said yesterday, the first question for Ted was whether or not that big increase in the total open interest in silver on Thursday was a result of new shorts being put on by Managed Money traders on that engineered price decline we saw.
He said it was entirely possible -- and most likely, but also pointed out that we're entering that time of month when mores spread trades are being put on in silver. The increase in the total open interest could have been partially due to that as well.
And as he also mentioned, it appeared that the commercial traders of whatever stripe were doing everything within their power to keep these Managed Money traders on the short side in silver...not only in Thursday's trading action, but also in overnight GLOBEX trading on Friday -- and continuing until a minute or so after the inflation numbers were released at 8:30 a.m. EDT on Friday morning!
I pointed this out in my previous discussion on silver at the top of today's column -- and will most likely mention it again in The Wrap.
Ted said that the poor price action in silver relative to gold yesterday was entirely due to COMEX positioning -- and had little to do with the inflation numbers.
Ted said that his 'whale' in the Swap Dealer category still holds a long position of 15,000 contracts or a bit more, which is hardly bearish.
And while on the subject of the Swap Dealers in the commercial category, they're still net long silver by about 5,100 contracts, down from the 7,000 contract net long position they held in last week's COT Report -- and all because of that 'whale' mentioned above. The Producer/Merchants in the commercial category are net short 32,000 COMEX contracts, up a thousand contracts from last week.
Although this further short covering by that one Managed Money trader used up more of Ted's 'rocket fuel'...he was happy that it wasn't the Big 8 commercial traders that were the big sellers during the reporting week. The big sellers were the raptors, the commercial traders other than the Big 8.
The set-up for a big rally in silver remains firmly in place -- and Ted's of the opinion that because of the efforts that the commercial traders have made to put the Managed Money traders even more short on both Thursday and Friday, the internal structure of the COMEX futures market still remains wildly bullish...despite what happened to the silver price during the New York trading session after the 10 a.m. afternoon gold fix in London yesterday.
![]()
In gold, the commercial net short position didn't do a thing...decreasing their short position by a microscopic 170 COMEX contracts.
But they arrived at that number in a very strange way...by decreasing their long position by 18,395 COMEX contracts -- and decreasing their short position by 18,565 contracts. It's the difference between those two numbers that represents their change for the reporting week.
Under the hood in the Disaggregated COT Report, the Managed Money traders were the only buyers, as they increased their net long position by 6,738 COMEX contracts -- and the other two groups of traders reduced their net long positions...the Other Reportables by 4,059 contracts -- and the Nonreportable/small traders by 2,849 contracts.
Doing the math: 6,738 minus 4,059 minus 2,849 equals 170 COMEX contracts, the change in the commercial net short position.
The commercial net short position in gold sits at 20.00 million troy ounces, obviously unchanged from the 20.00 million troy ounces they were short in last Friday's COT Report.
The short position of the Big 8 traders is now 21.64 million troy ounces, down 0.66 million troy ounces from the 22.30 million troy ounces they were short in last week's COT Report. So despite the lack of change in the total commercial net short position, the Big 8 shorts were busy covering during the reporting week.
Since there was no change in the commercial net short position during the reporting week -- and the Big 8 covered 0.66 million troy ounces/6,600 COMEX contracts of their short position, that means that Ted's raptors, the small commercial traders other than the Big 8, had to have sold that amount of long positions -- and that's what they did.
As in silver, don't forget that despite their small size, Ted's raptors are still commercial traders in the commercial category.
From the above numbers, the Big 8 traders are short 21.64/20.00 equals about 108 percent of the commercial net short position in gold...down about 3 percentage points from the approximately 111 percent they were short in last Friday's COT Report.
This means that Ted's raptors, the small commercial traders other than the Big 8, are net long 21.64-20.00=16,400 COMEX contracts in this week's COT Report...down from the 22,300 COMEX contracts they were net long in last week's COT Report...with those 22,300 contracts divided up between the approximately 39 small traders that are currently in the gross long category in gold.
Here's Nick Laird's 3-year COT chart for gold, updated with Friday's data. Click to enlarge.
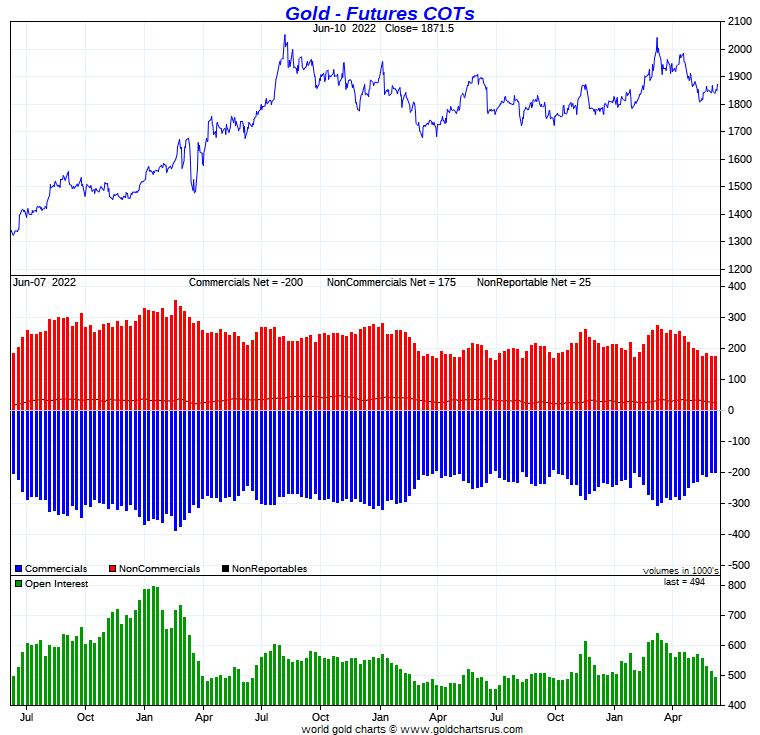
Of course -- and like in silver, the commercial traders were there to sell gold well below its 200-day moving average going into yesterday morning's inflation numbers. And also like in silver, the low tick of the day in gold was set a minute after the inflation numbers were released. Of course, as Ted correctly pointed out, this was all COMEX futures market positioning -- and nothing else.
Ted says that the gold 'whale' in the Other Reportables category holds at most about 12,000 long contracts which, as he pointed out, hardly qualifies them as a 'whale' anymore, because at their high, they held about 40,000 COMEX contracts long. He's not sure whether they reduced their long position by selling paper longs in the COMEX futures market, or by taking physical delivery.
And as he also keeps pointing out, because it's a long-term holding -- and not being held for speculative purposes, that remaining long position of 12,000 contracts can be subtracted from the current commercial net short position. Doing that, brings it down to a bit below the 19 million troy ounce mark...which is enormously bullish.
And not to be forgotten is that this current bullish situation exists with gold already above its 200-day moving average by a decent amount.
And not to be forgotten is that the Big 8 also reduced their short position during the reporting week as well...mostly the Big 4.
But of course there was pretty big price activity in gold yesterday -- and on huge volume. I doubt very much if the Big 8 shorts did much except cover more short positions on that engineered price decline going into the 8:30 a.m. EDT inflation number...as any commercial activity after that on Friday would most likely come from Ted's raptors selling long positions for big profits.
So...we wait some more.
![]()
In the other metals, the Managed Money traders in palladium increased their net short position by a 272 COMEX contracts -- and are net short palladium by 1,855 contracts. The commercial traders continue to be the only categories currently net long palladium. In platinum, the Managed Money traders decreased their net short position during the reporting week by a whopping 8,691 COMEX contracts, which should come as no surprise considering the price action during the reporting week -- and are now back to being net long the COMEX futures market by 2,730 COMEX contracts. Platinum continues to be a bifurcated market in the commercial category, with the Producer/Merchants mega net short -- and the Swap Dealers mega net long. There's more on this in the Bank Participation Report below. In copper, the Managed Money traders decreased their net short position by a hefty 15,788 COMEX contracts, also no surprise considering the recent price activity -- and are now back to being net long copper by 4,116 COMEX contracts...about 103 million pounds of the stuff.
![]()
Here’s Nick Laird’s “Days to Cover” chart, updated with the COT data for positions held at the close of COMEX trading on Tuesday, June 7. It shows the days of world production that it would take to cover the short positions of the Big 4 — and Big '5 through 8' traders in each physically traded commodity on the COMEX.
I consider this to be the most important chart that shows up in the COT series -- and it always deserves a moment of your time. Click to enlarge.
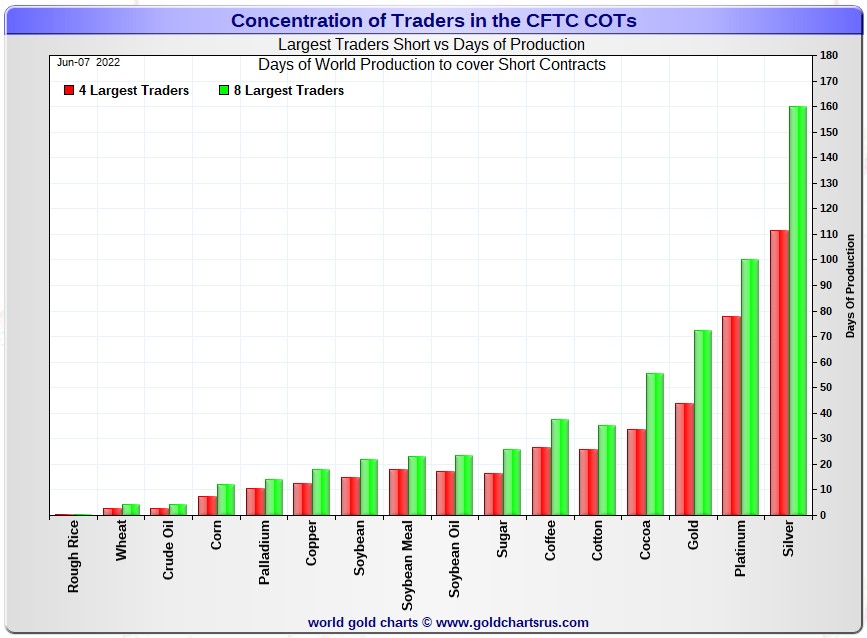
In this week's 'Days to Cover' chart, the Big 4 traders are short about 111 days of world silver production, about unchanged from last week's COT Report. The ‘5 through 8’ large traders are short an additional 49 days of world silver production, down about 4 days from last Friday's report, for a total of about 160 days that the Big 8 are short -- and obviously down about 4 days from last week's COT Report.
[Note: That 4 day drop in the Big '5 through 8' category is entirely due to the fact that one of Managed Money traders covered enough short positions to remove themselves from that category, leaving only one Managed Money trader left. That fact somewhat distorts the above numbers -- and the numbers that follow...but is much less of a factor now than it has been in the past.]
That 160 days that the Big 8 commercial traders are short, represents a bit over five months of world silver production, or 344.0 million troy ounces of paper silver held short by these eight traders...one of which is still a Managed Money trader.
In the COT Report above, the Commercial net short position in silver was reported by the CFTC at 140.0 million troy ounces. As mentioned in the previous paragraph, the short position of the Big 4/8 traders is 344.0 million troy ounces. So the short position of the Big 4/8 traders is larger than the Commercial net short position by 344.0-140.0=204.0 million troy ounces...down 28.7 million troy ounces from last week's COT Report...5,740 COMEX contracts.
This number is distorted a bit by the incursion of that Managed Money trader into the Big '5 through 8' short category. Ted says that a more realistic number of long contracts held by his raptors would be around 165 million troy ounces...which is still massive.
As per the first paragraph above, the Big 4 traders in silver are short around 111 days of world silver production in total. That's just under 28 days of world silver production each, on average...unchanged from last Friday's report. The traders in the '5 through 8' category are short 49 days of world silver production in total...just over 12 days of world silver production each on average -- and down about 1 day from last week's COT Report...all because of the one Managed Money trader that dropped out of that category during the reporting week.
The Big 8 traders are short 46.4 percent of the entire open interest in silver in the COMEX futures market, which is down a bit from the 47.8 percent they were short in the last COT report. And once whatever market-neutral spread trades are subtracted out, that percentage would be a bit over the 50 percent mark. In gold, it's 43.8 percent of the total COMEX open interest that the Big 8 are short, up a tiny bit from the 43.4 percent they were short in last Friday's COT Report -- and very close to the 50 percent mark once their market-neutral spread trades are subtracted out.
In gold, the Big 4 are short 44 days of world gold production, down 2 days from last Friday's COT Report. The '5 through 8' are short 29 days of world production, unchanged from last week...for a total of 73 days of world gold production held short by the Big 8 -- and down 1 day from last Friday's COT Report...as strange as that looks. But that's what Nick's data shows. Based on these numbers, the Big 4 in gold hold about 60 percent of the total short position held by the Big 8...down about 1 day from last Friday's COT Report.
The "concentrated short position within a concentrated short position" in silver, platinum and palladium held by the Big 4 commercial traders are about 69, 78 and 71 percent respectively of the short positions held by the Big 8...the red and green bars on the above chart. Silver is up 1 percentage point from last week...platinum is unchanged from a week ago -- and palladium is down about 6 percentage points week-over-week.
The status quo remains basically unchanged. The Big 4/8 traders are still sitting there like a lump -- and very firmly stuck on the short side in both gold and silver. However, they did improve their short position in gold by a decent amount for the second week in a row. But as to how much they improved in silver is up in the air because the Big 8 shorts are no longer all commercial traders...contaminated by that remaining Managed Money trader in their midst. Based on that fact, it's impossible to tell how well they made out. My guess, based on the change in the commercial net short position this week, is that they didn't do much...especially in the Big 4 category, as it's a pure commercial number now -- and there was no change in it during the reporting week. Any changes in the '5 through 8' category really don't matter much, as the Big 4 commercial shorts dominate, as per the Days to Cover chart above.
As I keep pointing out -- and will mention again, the Big 4/8 shorts will never be able to extricate themselves fully from the short side, if that was ever their intent...particularly the Big 4. At some point they're going to have eat the lion's share of the short positions that they currently hold. The only way that they can do that is to go into the market and buy longs...or deliver physical metal, but only if the long holders are in a position to accept delivery. Ted says that a lot of them aren't.
So unless the powers-that-be at the CFTC and CME Group have something nefarious up their sleeves, or they're bailed out by the likes of the Exchange Stabilization Fund, the U.S. Treasury or the Fed, their potential loses can only be imagined...think LME nickel times 20 or more, according to Ted. But I very much doubt that it will be allowed to happen, especially for the 'too big to fail' bullion banks in the Big 4 category.
As I keep saying, what happened on the LME involving the nickel market will most likely be a template for what will occur over at the CME Group at some point, as they rush to protect the big shorts on any runaway price activity to the upside, as that's their primary function.
But as of this moment, there are no upside daily limits as to how high gold and silver prices can rise in the COMEX futures market. They can rally any amount...or until the CME steps in to save the shorts.
But as I keep saying in this spot every Saturday, the circumstances in silver have been altered by an unimaginable [and monstrously bullish] amount by Ted's discovery of the approximately 1 billion troy ounce physical short position in silver that Bank of America appears to hold in the OTC market...along with the big increase in Goldman's derivatives position in silver in that market, as shown in the latest OCC Report for Q4/2021...which Ted figures is a long position.
The new OCC Derivatives Report for Q1/2022 should be out in about two weeks -- and we'll see what the lay of the land is then.
He has also come to the conclusion that BofA is short about 30 million troy ounces of gold in the OTC market as well.
The situation regarding the Big 4/8 commercial shorts in silver, gold [and in platinum for those commercials in the Producer/Merchant category] continues to be far beyond obscene, twisted and grotesque -- and as Ted correctly points out ad nauseam, its resolution will be the sole determinant of precious metal prices going forward.
As always, nothing else matters.
![]()
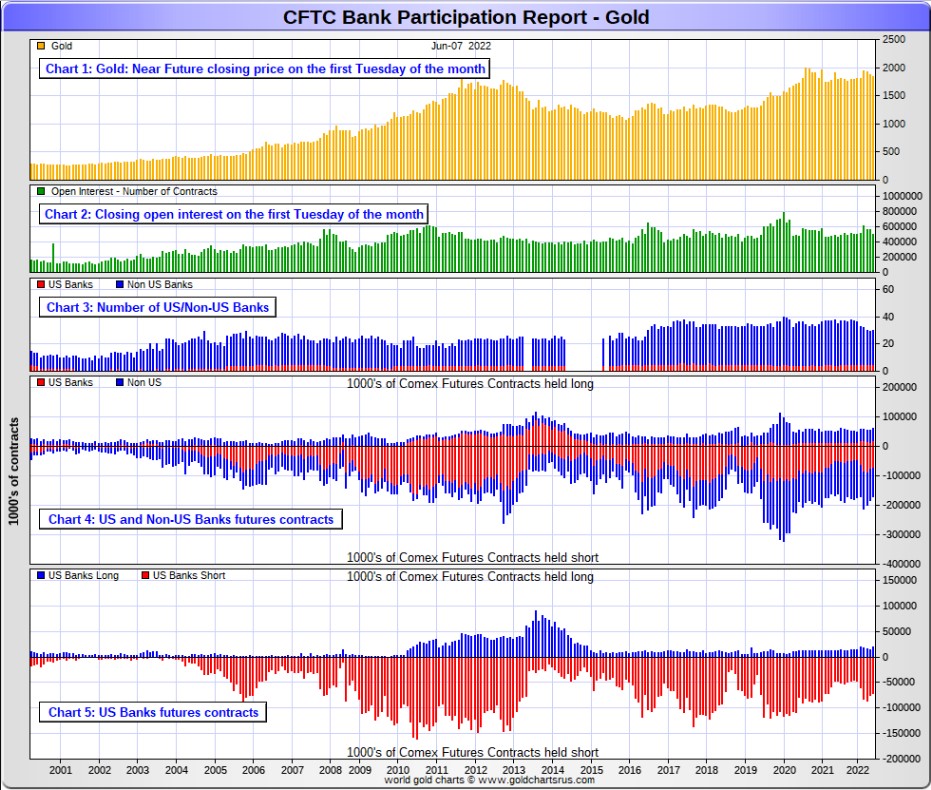
The June Bank Participation Report [BPR] data is extracted directly from yesterday's Commitment of Traders Report. It shows the number of futures contracts, both long and short, that are held by all the U.S. and non-U.S. banks as of Tuesday’s cut-off in all COMEX-traded products. For this one day a month we get to see what the world’s banks are up to in the precious metals. They’re usually up to quite a bit -- and certainly were again this past month.
[The June Bank Participation Report covers the time period from May 3 to June 7 inclusive.]
In gold, 5 U.S. banks are net short 52,166 COMEX contracts in the June BPR. In May’s Bank Participation Report [BPR] these same 5 U.S. banks were net short 61,016 contracts, so there was a decrease of 8,850 COMEX contracts month-over-month. This is their second monthly decrease in a row.
Citigroup, HSBC USA, Bank of America and Morgan Stanley would most likely be the U.S. banks that are short this amount of gold. I still have my usual suspicions about the Exchange Stabilization Fund, although if they're involved, they are most likely just backstopping these banks.
Also in gold, 24 non-U.S. banks are net short 55,946 COMEX gold contracts. In May's BPR, 25 non-U.S. banks were net short 70,187 contracts...so the month-over-month change shows a decrease of a fairly hefty decreased of 14,241 COMEX contracts...the fourth monthly decrease in a row -- and down from the 92,025 contracts they were short in the March BPR.
At the low back in the August 2018 BPR...these same non-U.S. banks held a net short position in gold of only 1,960 contacts -- and they've been back on the short side in an enormous way ever since.
I suspect that there are at least three large banks in this group, HSBC, Barclays and Deutsche Bank. I still harbour suspicions about Scotiabank/Scotia Capital, Dutch Bank ABN Amro, French bank BNP Paribas, plus Australia's Macquarie Futures. Other than that small handful, the short positions in gold held by the vast majority of non-U.S. banks are immaterial and, like in silver, have always been so.
As of this Bank Participation Report, 30 banks [both U.S. and foreign] are net short 21.9 percent of the entire open interest in gold in the COMEX futures market, which is down a bit from the 23.5 percent that 29 banks were net short in the May BPR.
Here’s Nick’s BPR chart for gold going back to 2000. Charts #4 and #5 are the key ones here. Note the blow-out in the short positions of the non-U.S. banks [the blue bars in chart #4] when Scotiabank’s COMEX short position was outed by the CFTC in October of 2012. Click to enlarge.
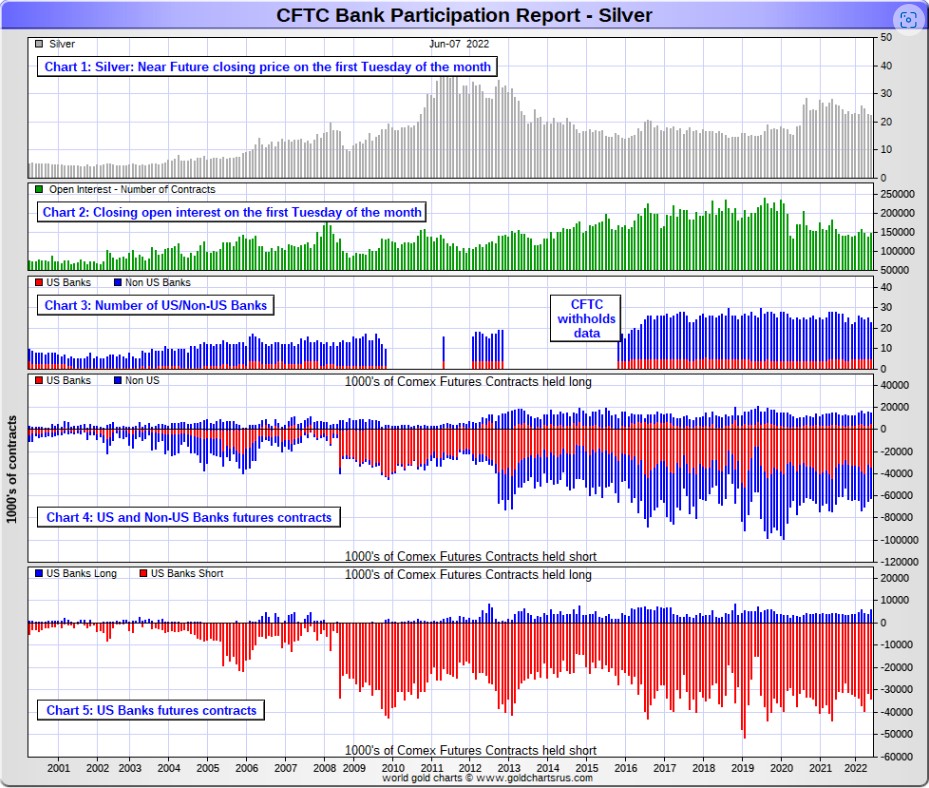
In silver, 5 U.S. banks are net short 28,312 COMEX contracts in June's BPR. In May's BPR, the net short position of these same 5 U.S. banks was 27,634 contracts, which is up a tiny 678 COMEX contracts month-over-month.
The biggest short holders in silver of the five U.S. banks in total, would be Citigroup, HSBC USA, Bank of America, Morgan Stanley...and maybe Goldman Sachs...but not JPMorgan according to Ted. And, like in gold, I have my suspicions about the Exchange Stabilization Fund's role in all this...although, also like in gold, not directly.
Also in silver, 18 non-U.S. banks are net short 19,570 COMEX contracts in the June BPR...which is down 1,312 contracts from the 20,882 contracts that 20 non-U.S. banks were short in the May BPR...the third month in a row of decreases...albeit not by a lot.
I would suspect that HSBC and Barclays holds a goodly chunk of the short position of these non-U.S. banks...plus some by Canada's Scotiabank/Scotia Capital still. I'm not sure about Deutsche Bank... but now suspect Australia's Macquarie Futures. I'm also of the opinion that a number of the remaining non-U.S. banks may actually be net long the COMEX futures market in silver. But even if they aren’t, the remaining short positions divided up between these other 13 or so non-U.S. banks are immaterial — and have always been so.
As of June's Bank Participation Report, 23 banks [both U.S. and foreign] are net short 32.3 percent of the entire open interest in the COMEX futures market in silver— down a bit from the 35.2 percent that 25 banks were net short in the May BPR. And much, much more than the lion’s share of that is held by Citigroup, HSBC, Bank of America, Barclays -- and Scotiabank -- and possibly one other non-U.S. bank...all of which are card-carrying members of the Big 8 shorts.
I'll point out here that Goldman Sachs, up until late last year, had no derivatives in the COMEX futures market in any of the four precious metals. But they did show up in the last two OCC Reports. Now they have a $4.8 billion position, mostly in silver -- and as I pointed out a bit further up, Ted thinks they're long the market.
Here’s the BPR chart for silver. Note in Chart #4 the blow-out in the non-U.S. bank short position [blue bars] in October of 2012 when Scotiabank was brought in from the cold. Also note August 2008 when JPMorgan took over the silver short position of Bear Stearns—the red bars. It’s very noticeable in Chart #4—and really stands out like the proverbial sore thumb it is in chart #5. But, according to Ted, as of March 2020...they're out of their short positions, not only in silver, but the other three precious metals as well. Click to enlarge.
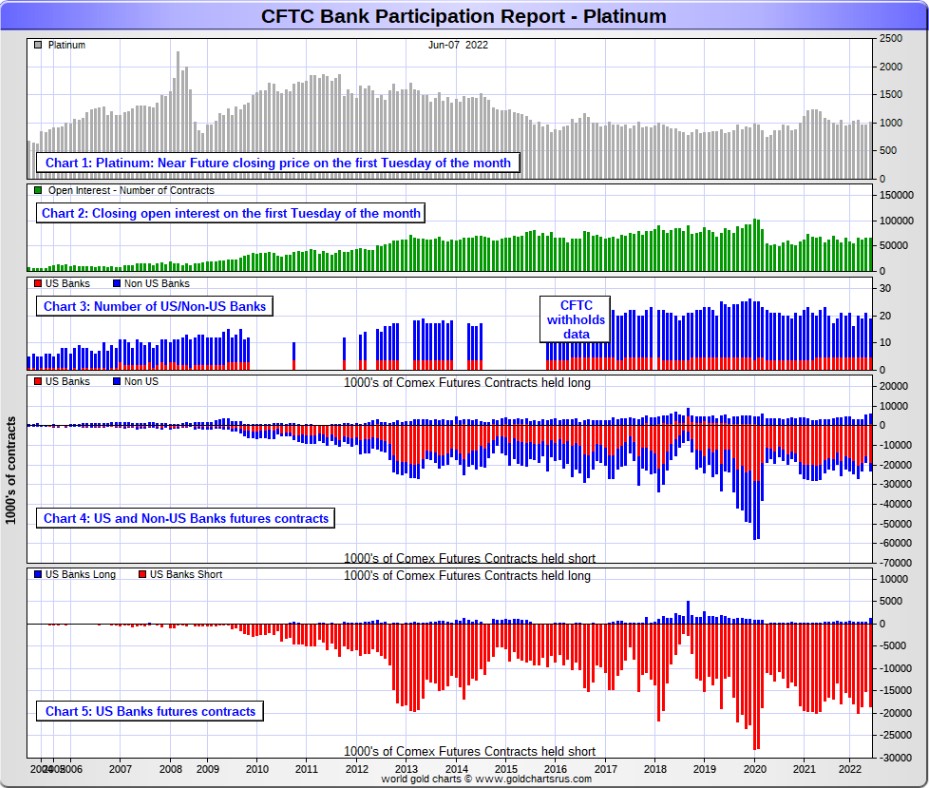
In platinum, 5 U.S. banks are net short 17,312 COMEX contracts in the June Bank Participation Report, which is up 2,634 contracts from the 14,678 COMEX contracts that these same 5 U.S. banks were short in the May BPR.
At the 'low' back in July of 2018, these U.S. banks were actually net long the platinum market by 2,573 contracts. So they have a very long way to go to get back to just market neutral in platinum...if they ever intend to, that is.
Also in platinum, 14 non-U.S. banks are net long 220 COMEX contracts in the June BPR, which is down 1,270 contracts from the 1,490 contracts that 16 non-U.S. banks were net long in the May BPR.
[Note: Back at the July 2018 low, these same non-U.S. banks were net short 1,192 COMEX contracts in platinum.]
And as of June's Bank Participation Report, 19 banks [both U.S. and foreign] are net short 26.2 percent of platinum's total open interest in the COMEX futures market, which is up from the 19.9 percent that 21 banks were net short in May's BPR.
But it's the U.S. banks that are on the short hook big time -- and the real price managers. They have little chance of delivering into their short positions, although a very large number of platinum contracts have already been delivered during the last year or so...including the April and May of this year. But that fact, like in both silver and gold, has made no difference whatsoever to their short positions. The situation for them [the U.S. banks] in this precious metal is as almost as equally dire in the COMEX futures market as it is with the other two precious metals...silver and gold...particularly the former.
The reason that they'll never improve their short positions in a big way is the same reason as in gold and silver...the Managed Money traders flatly refuse to go short big time like they used to in the past -- and are currently net long 2,700 COMEX contracts in platinum at the moment.
Here's the Bank Participation Report chart for platinum. Click to enlarge.
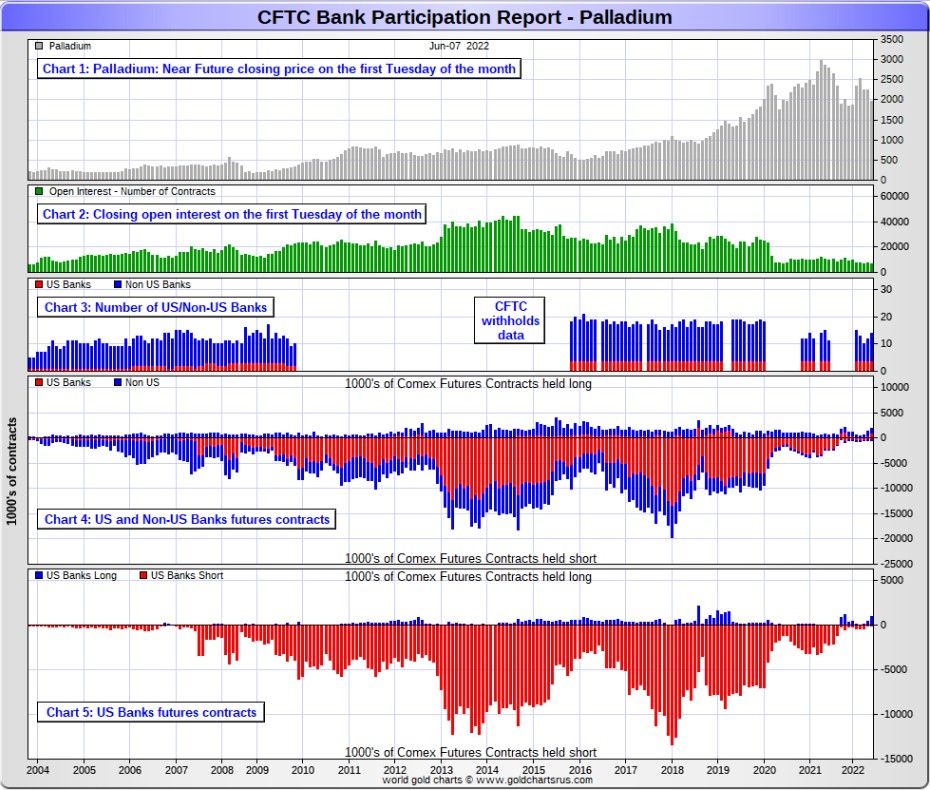
In palladium, 4 U.S. banks are net long 800 COMEX contracts, up 488 contracts from the 312 COMEX contracts they were net long in May.
Also in palladium, 10 non-U.S. banks are net long 572 COMEX contracts in the June BPR, up 182 contracts from the 281 contracts that 8 non-U.S. banks that were net long in May.
Except in February's Bank Participation Report, these non-U.S. banks have been net long palladium by a bit for a bit more than two years now.
And as I've been commenting for almost forever, the COMEX futures market in palladium is a market in name only, because it's so illiquid and thinly-traded. Its total open interest at Tuesday's cut-off was only 7,035 contracts...compared to 66,295 contracts of total open interest in platinum...148,294 contracts in silver -- and 494,130 COMEX contracts in gold.
The only reason that there's a futures market at all in palladium, is so that the Big 8 traders can control its price. That's all there is, there ain't no more.
As of this Bank Participation Report, 14 banks [both U.S. and foreign] are now net long 19.5 percent of the entire COMEX open interest in palladium...compared to the 9.2 percent of total open interest that 12 banks were net long in May's BPR.
And because of the small numbers of contracts involved, along with a tiny open interest, these numbers are pretty much meaningless.
But, having said that, for the last two years in a row, the world's banks have not been involved in the palladium market in a material way. And with them now net long, it's all hedge funds and commodity trading houses that are left on the short side.
Here’s the palladium BPR chart. Although the world's banks are now net long at the moment, it remains to be seen if they return as big short sellers again at some point like they've done in the past. Click to enlarge.
Excluding palladium for obvious reasons -- and platinum in the non U.S. bank category...only a small handful of the world's banks, most likely four or so in total -- and mostly U.S-based, except for HSBC, Barclays and maybe Deutsche Bank...continue to have meaningful short positions in the precious metals. It's a near certainty that they run this price management scheme from within their own in-house/proprietary trading desks...although it's a given that some of their their clients are short these metals as well.
The futures positions in silver and gold that JPMorgan holds are immaterial -- and have been since March of 2020...according to Ted Butler. And what net positions they might hold, would certainly be on the long side of the market. It's the new 7+1 shorts et al. that are on the hook in everything precious metals-related.
And as has been the case for years now, the short positions held by the Big 4/8 traders/banks is the only thing that matters...especially the short positions of the Big 4 -- and how it is ultimately resolved [as Ted said earlier] will be the sole determinant of precious metal prices going forward.
The Big 8 shorts, along with Ted's raptors...the small commercial traders other than the Big 8 commercial shorts...continue to have an iron grip on their respective prices -- and nothing has changed in that regard over the last month...at least what can be seen on the surface. They continue to be the cork in the precious metal price bottle.
That situation will persist until they either voluntarily give it up...or are told to step aside, as it now appears that there's no chance that they will ever get overrun. If that possibility had ever existed in reality, it would have happened already. However, considering the current state of affairs in the world today -- and the physical shortage in silver, I suppose one shouldn't rule it out entirely.
I have a very decent number of stories articles and videos for you today...a few of which I've been saving for today's column for length and/or content reasons.
![]()
CRITICAL READS
Inflation rose 8.6% in May, highest since 1981
Inflation accelerated further in May, with prices rising 8.6% from a year ago for the fastest increase since December 1981, the Bureau of Labor Statistics reported Friday.
The consumer price index, a wide-ranging measure of goods and services prices, increased even more than the 8.3% Dow Jones estimate. Excluding volatile food and energy prices, so-called core CPI was up 6%, slightly higher than the 5.9% estimate.
On a monthly basis, headline CPI was up 1% while core rose 0.6%, compared with respective estimates of 0.7% and 0.5%.
Surging shelter, gasoline and food prices all contributed to the increase.
Energy prices broadly rose 3.9% from a month ago, bringing the annual gain to 34.6%. Within the category, fuel oil posted a 16.9% monthly gain, pushing the 12-month surge to 106.7%.
Shelter costs, which account for about a one-third weighting in the CPI, rose 0.6% for the month, the fastest one-month gain since March 2004. The 5.5% 12-month gain is the most since February 1991.
Finally, food costs climbed another 1.2% in May, bringing the year-over-year gain to 10.1%.
Of course these inflation figures are vastly understated in everything...massaged to perfection -- and as I remarked yesterday, you can add at least 50 percent to that so-call 'official' number. This cnbc.com news item put in an appearance on their website at 8:31 a.m. EDT on Friday morning -- and was updated two hours later. I thank Swedish reader Patrik Ekdahl for today's first story -- and another link to it is here. The Zero Hedge spin on this is headlined "U.S. Consumer Prices Reaccelerate in May, Highest Since 1981" -- and comes courtesy of Brad Robertson.
![]()
U.S. Consumer Sentiment Collapses to Record Low in June
In a stunning miss, University of Michigan Sentiment collapsed in preliminary June data, crashing from 58.4 to 50.2 (massively below the 58.1 expectations). The current conditions gauge sank to a record-low 55.4 from 63.3, while a measure of expectations decreased to 46.8 from 55.2. Click to enlarge.
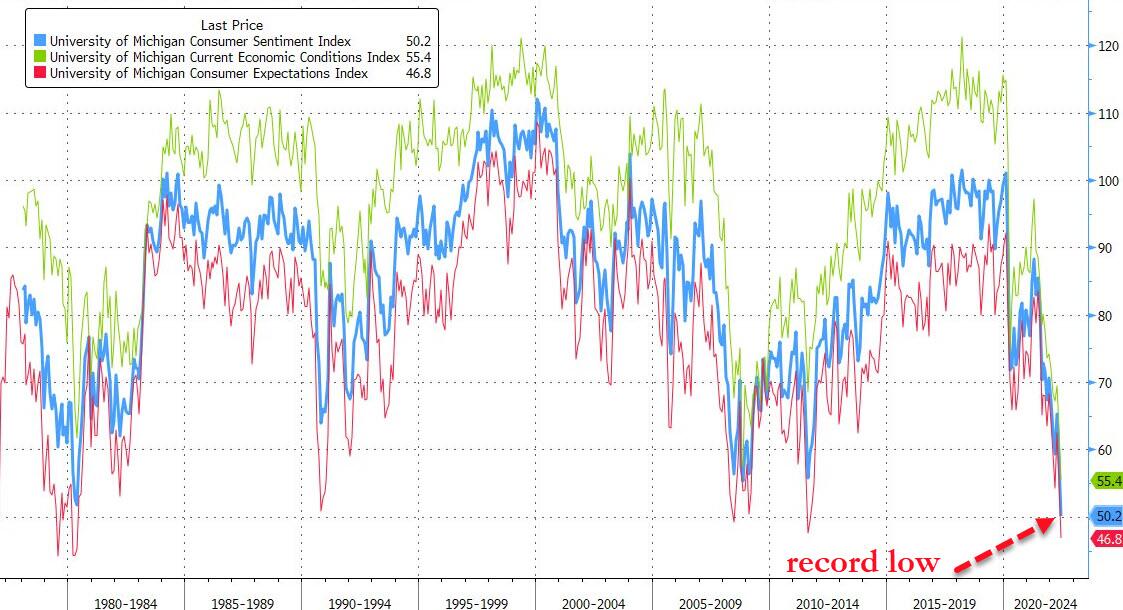
That is the lowest reading ever for UMich.
“Throughout the survey, consumers signaled strong concerns that inflation will continue to erode their incomes, and the factors they cited are unlikely to abate soon,” Joanne Hsu, director of the survey, said in a statement.
“While consumer spending has remained robust so far, the broad deterioration of sentiment may lead them to cut back on spending and thereby slow down economic growth,” Hsu said.
Consumers' assessments of their personal financial situation worsened about 20%. Forty-six percent of consumers attributed their negative views to inflation, up from 38% in May; this share has only been exceeded once since 1981, during the Great Recession. Overall, gas prices weighed heavily on consumers, which was no surprise given the 65 cent increase in national gas prices from last month (AAA). Half of all consumers spontaneously mentioned gas during their interviews, compared with 30% in May and only 13% a year ago.
In addition, a majority of consumers spontaneously mentioned supply shortages for the ninth consecutive month.
This multi-chart Zero Hedge article appeared on their Internet site at 11:11 a.m. on Friday morning EDT -- and I thank Brad Robertson for sharing it with us. Another link to it is here.
![]()
U.K. banks no longer too big to fail, says BoE
The Bank of England is satisfied lenders have taken steps to ensure they are no longer "too big to fail" in any future crisis, it said on Friday, though it did find shortcomings at three leading banks.
The BoE is aiming to stop banks from requiring taxpayers to bail them out, as happened in the 2007-09 global financial crisis.
The central bank said it was satisfied overall that banks could be wound down safely while keeping vital services open, with shareholders and investors in line to bear the costs rather than taxpayers.
In its first public assessment of how failing lenders could be dismantled in a crisis, the BoE said it had also identified "areas of further enhancement" for six companies.
The three banks found to have shortcomings were Lloyds, Standard Chartered and HSBC.
All three were found not to have produced sufficient analysis of their liquidity needs were they to be wound down.
Globe-spanning banks HSBC and Standard Chartered were also found to have failed to produced up-to-scratch restructuring plans.
This Reuters story, filed from London on Thursday night EDT, was picked up by the uk.news.yahoo.com Internet site -- and it's another offering from Patrik Ekdahl. Another link to it is here.
![]()
Ukraine Safe-Passage Grain-Talks Fail, Expect Still Higher Food Prices Globally
Talks between Turkey and Russia aimed at providing safe passage for Ukraine's harvest ended in failure...
Turkey attempted to mediate safe passage in the Black Sea for Ukraine's grain harvest, but objected to the Black Sea proposal in a statement on Tuesday before the talks in Turkey.
A significant portion of the world’s food supply is on the line, but Ukraine Nixes a Potential Deal.
“We cannot rule out Russia’s plans to use such a corridor to attack Odessa and southern Ukraine. That is why effective security guarantees are needed to restore shipping,” the Ukrainian Foreign Ministry said.
The stakes of a possible deal are enormous, with a significant portion of the world’s food supply on the line. Russia’s invasion left around 20 million metric tons of grain and seeds stranded in Ukrainian territory seized by Russia or cut off from the Black Sea ports through which it is normally exported. Russia’s bombing of roads, bridges and other infrastructure, along with a blockade of Ukraine’s ports, have added to the obstacles to getting grain out of the country, Ukrainian officials and farmers say.
“We emphasize that decisions must be made with the participation of all parties involved. We will reject any agreements that do not take into account the interests of Ukraine,” the Ukrainian Foreign Ministry said Tuesday.
This commentary by "Mish" Shedlock was posted on the Zero Hedge Internet site at 6:30 a.m. EDT on Friday morning -- and I thank Brad Robertson for sending it our way. Another link to it is here.
![]()
The War in Ukraine Marks the End of the American Century. “What’s Left is a Steaming Pile of Dollar Denominated Debt” -- Mike Whitney
“The ferocity of the confrontation in Ukraine shows that we’re talking about much more than the fate of the regime in Kiev. The architecture of the entire world order is at stake.” Sergei Naryshkin, Director of Russia’s Foreign Intelligence.
Here’s your ‘reserve currency’ thought for the day: Every U.S. dollar is a check written on an account that is overdrawn by 30 trillion dollars.
It’s true. The “full faith and credit” of the U.S. Treasury is largely a myth held together by an institutional framework that rests on a foundation of pure sand. In fact, the USD is not worth the paper it is printed on; it is an IOU flailing in an ocean of red ink.
The only thing keeping the USD from vanishing into the ether, is the trust of credulous people who continue to accept it as legal tender.
But why do people remain confident in the dollar when its flaws are known to all? After all, America’s $30 trillion National Debt is hardly a secret, nor is the additional $9 trillion that’s piled up on the Fed’s balance sheet. That is a stealth debt of which the American people are completely unaware, but they are responsible for all the same.
In order to answer that question, we need to look at how the system actually works and how the dollar is propped up by the numerous institutions that were created following WW2. These institutions provide an environment for conducting history’s longest and most flagrant swindle, the exchange of high-ticket manufactured goods, raw materials and hard-labor for slips of green paper with dead presidents on them.
One can only marvel at the genius of the elites who concocted this scam and then imposed it wholesale on the masses without a peep of protest. Of course, the system is accompanied by various enforcement mechanisms that swiftly remove anyone who tries to either break free from the dollar or, God help us, create an alternate system altogether. (Saddam Hussein and Muammar Qaddafi come to mind.) But the fact is– aside from the institutional framework and the ruthless extermination of dollar opponents– there’s no reason why humanity should remain yoked to a currency that is buried beneath a mountain of debt and whose real value is virtually unknowable.
This very interesting and somewhat longish commentary from Mike was posted on the globalresearch.com Internet site on Thursday -- and comes to us courtesy of Roy Stephens. Another link to it is here.
![]()
Toes-for-cash hoax reflects Zimbabwe fears of soaring prices
Battling rampant inflation, Zimbabweans are counting their toes as they struggle to buy food for their families.
An internet rumor blazed through the country that desperate people were selling their toes for cash. The false report became so widespread that the country’s Deputy Minister of Information Kindness Paradza visited street vendors in central Harare earlier this month to debunk it.
One-by-one the traders took off their shoes to show that they had all 10 toes, as Zimbabwe’s state media recorded the digital investigation.
Paradza declared the toes-for-money story a hoax, as did local and foreign fact-checkers. Police later arrested a street vendor who now faces a fine or 6 months in jail on charges of criminal nuisance for allegedly starting the story.
It’s starkly true, however, that Zimbabweans are finding it increasingly difficult to make ends meet. Since the start of Russia’s war in Ukraine, Zimbabwe’s inflation rate has shot up from 66% to more than 130%, according to official statistics. The war is blamed for rising fuel and food prices.
The war in Ukraine has exacerbated inflation rising around the world. Consumer prices in the 19 European Union countries that use the euro currency surged 8.1% in May, a record rate as energy and food costs climb. In the U.S. and the United Kingdom, annual inflation hit or was close to 40-year highs of 8.3% and 9%, respectively, in April. Turkey approached Zimbabwe’s eye-watering prices, with inflation reaching 73.5% in May, the highest in 24 years.
This AP story, filed from Harare on Thursday, was something that Patrik Ekdahl sent our way on Friday -- and another link to it is here.
![]()
Japan edges closer to intervention in yen
Japan's government and central bank said on Friday they were concerned by recent sharp falls in the yen in a rare joint statement, the strongest warning to date that Tokyo could intervene to support the currency as it plumbs 20-year lows.
The statement underscores growing concern among policymakers over the damage that sharp yen depreciation could inflict on Japan's fragile economy by hurting business activity and consumers.
But many market players doubt that G7 member Japan will step in soon to directly prop up the yen, a diplomatically fraught and potentially costly course of action that last occurred 20 years ago.
After a meeting with his Bank of Japan (BOJ) counterpart, top currency diplomat Masato Kanda told reporters that Tokyo will "respond flexibly with all options on the table."
He declined to say whether Tokyo could negotiate with other countries to jointly step into the market.
This Reuters story, filed from Tokyo, showed up on their Internet site at 8:58 a.m. PDT on Friday morning -- and I thank Patrik Ekdahl for pointing it out. Another link to it is here.
![]()
Breaking -- and the Q1 2022 Z.1 -- Doug Noland
No mincing words; no need for sophisticated prose. The week was ugly. Things look bad. There are elements similar to the year 2000 bursting of the “Dot-com” Bubble. There are parallels to the much more systemic 2008 mortgage finance Bubble collapse. Yet, for me, this week rekindled more distant memories.
Surging global bond yields and acute currency market instability. Inflation fears. Rampant Credit growth and Acute Economic Imbalances. Policy paralysis and geopolitical tensions. Especially late in the week, I found myself reminiscing of days intensely following developments on a Telerate machine, Quotron and the Dow Jones Newswire - on the fixed-income trading desk at Toyota’s U.S. headquarters in Torrance, CA. It was the summer of 1987.
I place the start of today’s swiftly concluding cycle at Greenspan’s post “Black Monday” crash liquidity assurances. I found myself on Friday pondering how many Trillions of additional liquidity the world’s central bankers would be compelled to create these days in the event of a synchronized global crash – in yet another round of desperate measures to thwart financial collapse. Consequences? Could it even work?
Things weren’t supposed to unfold this way. The Fed was clearly going to be cautious, all moves made gingerly and well telegraphed to conspicuously vulnerable markets. Given time, inflation would surely subside. The worst-case scenario would be the Federal Reserve and global central banks raising rates until something began to “Break.” There was time. Rates would remain extraordinarily low for months and quarters. Nothing too pressing.
Well, complacent markets – and central bankers – grossly misjudged two key aspects of underlying fundamentals. Inflation Dynamics were much more powerful and well-entrenched than appreciated. Similarly, Market Structure fragilities were greatly more acute than recognized. The upshot: things are “Breaking” before central bank tightening cycles even get cracking.
Things are Breaking badly in periphery Europe – with the ECB yet to even nudge the policy rate off negative 50 bps. Greek yields surged another 67 bps this week to 4.38% - with a stunning 10-session spike of 172 bps. Italian yields jumped 36 bps to 3.76% (up 167bps in 10 sessions). Yields were up 34 bps in Spain to 2.78% (131bps) and 32 bps to 2.80% (142bps) in Portugal. Even German bund yields rose 24 bps to 1.52% (96 bps), as French yields rose 29 bps to 2.10% (107bps).
The “periphery” has become systemic like never before. And things have started to Break.
The cycle has turned, and the liquidity spigot is being turned off (first at the periphery). The days of egregiously loose finance – compliments of the ECB, global central bankers, and the risk-embracing leveraged speculating community – have run their fateful course. It’s always the riskier borrowers at the “periphery,” overwhelmed with cheap finance late in the boom cycle, that are left high and dry – illiquid and insolvent - when speculative finance reverses and Bubbles begin to succumb.
Ted's weekly commentary's are always a must read for me -- and this one is certainly no exception. It was posted on his website around midnight last night PDT -- and another link to it is here.
![]()
Protection from a currency collapse -- Alasdair Macleod
While markets seem becalmed, financial conditions are rapidly deteriorating. Last week Jamie Dimon of JPMorgan Chase gave the clearest of signals that bank credit is beginning to contract. Russia has consolidated its rouble, which has now become the strongest currency by far. The Fed announced the previous week that its balance sheet is in negative equity. And there’s mounting evidence that we have a nascent crack-up boom.
Russia now appears to be protecting the rouble from these developments in the West, while previously she was only attacking the dollar’s hegemony. China has yet to formulate a defensive currency policy but is likely to back the renminbi with a commodity basket, at least for foreign trade. If it is taken up more widely by the members if the Shanghai Cooperation organisation and the BRICS, the development of a new commodity-based super-currency in Central Asia could end the dollar’s global hegemony.
These are major developments. And finally, due to widespread interest in the subject, I examine the outlook for residential property values in the event of a collapse of Western fiat currencies.
The mechanics of an apocalypse
Against the grain of the establishment, for years I have been warning that the world faces a fiat currency collapse. The reasoning was and still is because that’s where monetary and economic policies are taking us. The only questions arising are whether the authorities around the world would realise the dangers of their inflationary and socialistic policies and change course (extremely unlikely) and in that absence in what form would the final crisis take.
History tells us that fiat currencies always fail, only to be replaced by Mankind’s sound money — metallic gold, and silver. And now that fiat currencies have seen a rapid debasement followed by soaring commodity and raw material prices, interest rates should be considerably higher. Yet, in the Eurozone and Japan they are still suppressed in negative territory. The reluctance of the ECB and the Bank of Japan to permit them to rise is palpable. Worse still, even with just the threat of a slowdown in the issuance of extra credit by the commercial banks, we suddenly face a sharp downturn in economic and financial activities.
This long essay from Alasdair showed up on the goldmoney.com Internet site on Friday -- and I found it embedded in a GATA dispatch. Another link to it is here. Gregory Mannarino's post market close rant for Friday is linked here -- and I thank Brad Robertson for sharing it with us. The usual naughty language warning applies.
![]()
World Top 20 Gold Producing Countries 2021 and Gold Outlook -- Lawrie Williams
Now is the time of year that the world’s major analytical assessors release their respective takes on what has been happening in terms of global gold production over the past year, and what is likely to happen in the year ahead. As can be seen from the table below, gleaned from the 2022 Gold Focus report from one of the world’s leading precious metals consultancy groups, London-based Metals Focus, global gold output has risen over the past year, albeit at a relatively subdued rate, despite talk of peak gold which does not yet appear to be with us, but is close!
In some respects, gold production figures for the past couple of years will have been slightly anomalous in any case because of the differing impacts of the Covid pandemic-related curtailments at many operations. These have been more severely implemented in some countries than in others and will probably have impacted 2020 output volumes more severely than for 2021. Closer examination of the 100-page plus Gold Focus report will indeed show that new mined gold production is estimated to have fallen a little in 2020, and the 2021 amount produced is only close to that of 2019 (if marginally lower) although the consultancy is forecasting a 1.7% increase in the current year. In other words global new mined gold production is virtually flat at the moment despite higher average price levels.
What is apparent from the table though is that China’s position as the world’s top gold producer appears to be under strong threat from Russia, and perhaps also from Australia. We had thought that this might yet be three of four years away, but at the current rate of decline of Chinese gold output that could well happen as soon as the current year, although the sanctions regime as a result of the Russia/Ukraine war could impact Russian gold mine output if key equipment and consumables imports are interrupted as a result.
It is apparent, though, that China, Russia and Australia are way ahead of any other country in terms of national gold production, with Canada coming up strong, but still well behind. It is notable that South Africa, which dominated global gold production for most of the 20th Century, has now fallen to only 10th place according to the latest Metals Focus estimates, and no longer even boasts Africa’s largest gold mines – the DRC’s Kibali and Mali’s Loulo-Gounkoto properties have assumed that position. Interestingly it has been Randgold Resources with effective South African roots, now part of Barrick Gold, which was largely responsible for bringing both these operations into being. There are also other larger African gold mining operations in terms of 2021 gold output elsewhere in Mali, Ghana, Tanzania and Burkina Faso before we get to South Africa’s largest producing gold mine. How the mighty have fallen.
This worthwhile commentary from Lawrie was posted on the Sharps Pixley website on Friday morning BST -- and another link to it is here.
![]()
The Photos and the Funnies
The next weekend, July 25, we were off to Princeton and Tulameen via the back road. There's nothing scary about this particular dirt/gravel road, although the descent from the Thompson Plateau to the Otter Creek flood plain does have its moments. It was a glorious, but hot summer day once again -- and for the first part of the trip, the visibility was unaffected by smoke from the nearby forest fires. These four shots were taken on an abandoned farm just off the main road. What's left of the bridge that used to cross this creek is the pile of rubble you can see in the third shot. This area -- plus downstream from there, gets flooded regularly during the spring run-off -- and was most likely the reason that this farm was abandoned. Click to enlarge.


![]()
The WRAP
"Understand this, things are now in motion that cannot be undone." -- Gandalf the White
![]()
Today's pop 'blast from the past' is not what I had originally picked out for today, but a news item I saw earlier in the week, made me change my mind. One of the two founding members of an American soft rock duo...Jim Seals...passed away this week -- and I'm linking two of their greatest hits. Both are from the early 1970s -- and are instantly recognizable. The first is here -- and the second, here. The bass cover to the former is here -- and the latter, here. There's far more to them than I once thought.
Today's classical 'blast from the past' dates from 09 March 1785. It's Mozart's Piano Concerto No. 21 in C major...completed four weeks after he composed his mighty D minor piano concerto, K. 466. The second movement was featured in the 1967 Swedish film Elvira Madigan with Géza Anda as soloist. As a result, the piece has become widely known as the Elvira Madigan concerto.
Here's concert pianist Ronald Brautigam, accompanied by the Netherlands Philharmonic Orchestra. Maestro Edo de Waart conducts a live performance at the TivoliVredenburg in Utrecht. The link is here.
![]()
I would have been prepared to pay a handsome sum of money to know what positioning changes were taking place in the GLOBEX/COMEX futures market in gold between 12:15 p.m. in London -- and 12:30 p.m. in New York. The same can be said about silver's price path between 9:15 a.m. BST and 12:30 p.m. EDT.
The engineered price declines in both up to 8:31 a.m. in New York...a minute after the inflation numbers were released, were certainly nothing that one would expect to see going into an already known horrid inflation number.
And nothing in the real world could explain the price capping that took place ten minutes after both silver and gold blasted higher after that number was released -- and those particular engineered price declines ended once the afternoon gold fix in London had been put to bed.
As Ted pointed out on the phone yesterday, this was strictly COMEX positioning changes, as the powers-that-be went about their business -- and had nothing to do with what was happening in the real world. He felt that it was the commercial traders' attempts to keep the Managed Money traders as short as possible going into that inflation report...particularly in silver.
And as a result of their efforts, he feels that the bullish set-up for both silver and gold in the COMEX futures market remains mostly intact.
But intact for what, you ask? One would have thought that yesterday's inflation number would have been enough to blow the Big 4/8 shorts out of the water...but obviously not. Their iron grip on gold and silver continues -- and was more that blatant yesterday.
We may know more as the days and weeks unfold -- and as Ted mentioned on the phone yesterday, he awaits the Sunday evening open in New York with some interest.
At its engineered low tick of the day, gold was below its 200-day moving average by a decent amount -- and silver's engineered low tick drove it $2.25 below its 200-day moving average -- and about a $1.90 below its 50-day. It should also be carefully noted that silver was stopped dead in its tracks at the $22.00 spot mark...to the penny.
And it's an absolute guarantee that all stripes of commercial traders were gorging themselves on what the Managed Money traders et al. were puking up.
I'm certainly looking forward to what Ted has to say about "all of the above" in his weekly review this afternoon, now that he's had a chance to "sleep on it". But one should suspect that it has a whole lot to do with his latest essay in the public domain headlined "Eyes Wide Shut" -- and it's worth reading if you haven't already.
Platinum and palladium weren't allowed to join the party, but both were allowed to close up by tiny amounts. Platinum was hammered back below its 50-day moving average at its intraday low, but recovered and closed above it by a bit. At palladium's low 'da boyz' had it about $280 below both its 50 and 200-day moving averages.
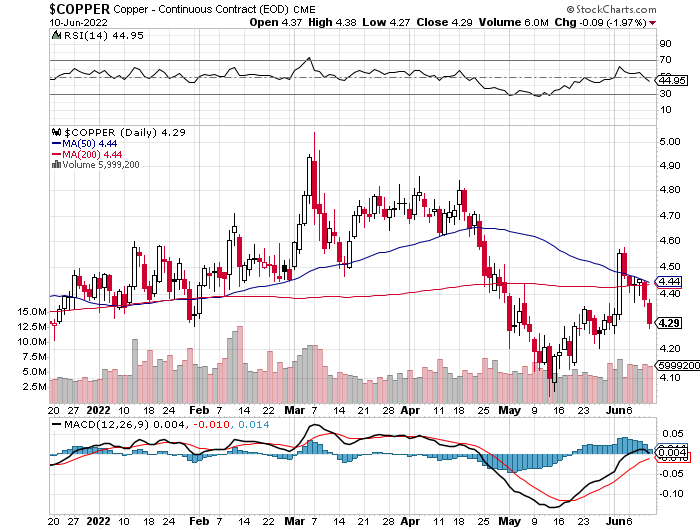
Copper was closed down another 9 cents at $4.29/pound in its current front month -- and a decent distance below both its 200 and 50-day moving averages. It's a good bet that the Managed Money traders, who were briefly long copper in yesterday's COT Report, are back on the short side once again, or are market neutral at best.
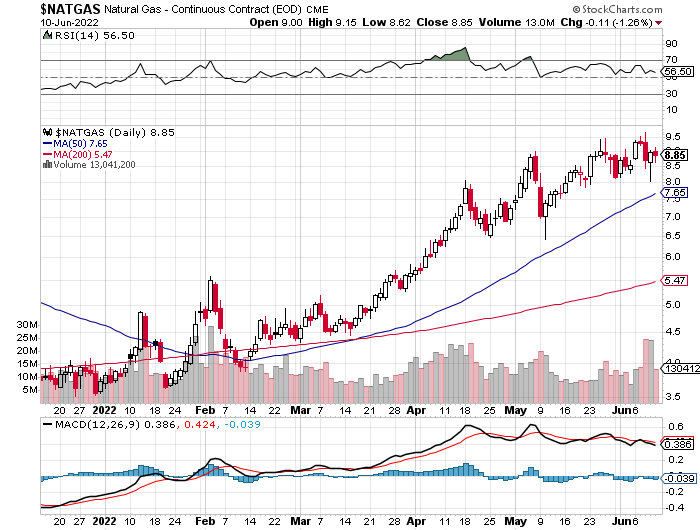
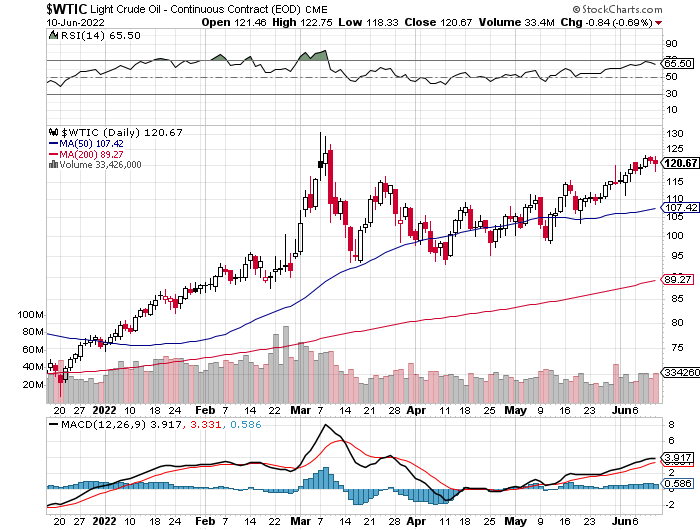
Both natural gas [chart included] and WTIC were closed lower by a bit...the former by 11 cents, at $8.85/1,000 cubic feet -- and the latter by 84 cents, closing at $120.67/barrel.
Here are the 6-month charts the Big 6+1 commodities, thanks to stockcharts.com as always -- and yesterday's price action should be noted. Click to enlarge.
The ongoing slow-motion economic, financial and monetary train wreck picked up a lot more steam during this past week, as the 'Everything Bubble' continues to get ripped asunder.
But what we've seen so far is barely the beginning of the end of things as we known them all our lives. The worst is yet to come...far worse -- and the stories and articles in the Critical Reads section above should give you some idea of where this is all headed.
One would like to think that the major central banks and governments of the world have painted themselves into a corner by circumstance ever since the U.S. went off the gold-exchange standard back in 1971. But I, along with many, many others now, believe that this has been a deliberate act that began many generations ago -- and spelled out clearly in G. Edward Griffin's classic tome "The Creature From Jekyll Island: A Second Look at the Federal Reserve" -- and even more bluntly in Carrol Quigley's novel "Tragedy and Hope: A History of the World in Our Time".
There are many more books than this on this subject, but these two come to mind, as I've read the first one...but found the second so unsettling that I couldn't even finish it.
Of course this "creature" has now manifested itself in the public domain in Klaus Schawb's World Economic Forum...another tentacle of the New World Order crowd.They have great plans for us bourgeoisie, all of which end up with the famous statement that "we'll own nothing and be happy."
Part of this process will be, as Gregory Mannarino continues to point out, the ongoing destruction of the middle class -- and inflation, along with economic and financial collapse, are the vehicles being used to do it. As Lenin pointed out in his famous quote...“The way to crush the bourgeoisie is to grind them between the millstones of taxation and inflation.”
We've only just begun the trip down that path -- and what we still don't know is if this process of destruction will end with a whimper, or a bang. My money is still on both, with the former preceding the latter.
It's very much a controlled process at the moment, but at some point it will most likely be allowed to become totally disorderly -- and no amount of central bank intervention will help, nor will they even attempt it. Everything will collapse into a "smouldering ruin within five business days" as I've been pointing out in many Saturday missives over the last couple of decades already.
Two essays in the Critical Reads section discuss the collapse of all the world's fiat currencies at some point, with the euro and the yen circling the drain at the moment. The dollar is the cleanest dirty shirt in the laundry at this point in history -- but even that won't last.
At some point in the future, as these authors [amongst others] have stated, it will become obvious to the masses that the central banks have no intention of holding back inflation -- and are in fact enabling it...which is precisely what they're doing. When that realization finally sinks in, the run to hard assets in general -- and the precious metals in particular, will be on in earnest.
There's nothing I see in the COMEX futures market that doesn't lead me to believe that the Big shorts and their enablers are preparing for that eventuality...with yesterday's price action in silver and gold being the poster children for that.
The central banks and deep state players in the shadows of power that have been running this price management scheme for the last fifty years, know it too. They already own almost all the physical precious metal, either overtly in the various public depositories, mutual funds and ETFs...or in private vaults scattered about the world.
They do have their timetable -- and won't stand back and let nature take its course until it suits them. That wasn't yesterday, but may have been the beginning of the end -- and we'll know soon enough if that's the case or not.
We just have to wait them out -- and as things stand today, that shouldn't be for much longer.
I'm still "all in" in the precious metals -- and quite content to be so.
See you on Tuesday.
Ed
About the author
