Excerpt from SilverSeek.com...
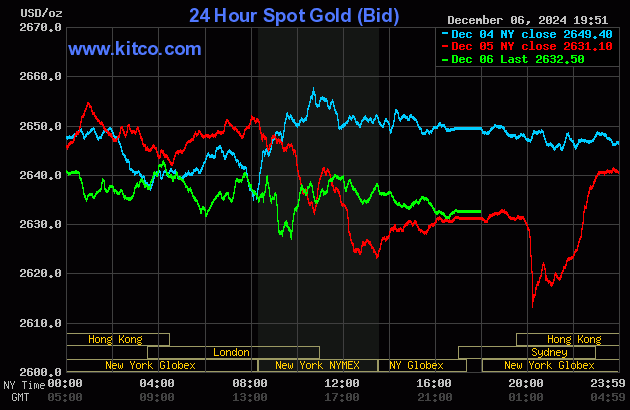
The gold price didn't do anything in the first hour or so of Globex trading in New York on Thursday evening, but began to creep lower starting just before the 9:00 a.m. Shanghai open. It was light's out at that point, with its low tick set minutes later. Gold came roaring back, but was capped the moment it broke above $2,640 spot -- and every time it broke above that mark up to and including its last time at noon in COMEX trading in New York, it got tapped lower. From noon EST it was sold unevenly lower until about thirty minutes before trading ended at 5:00 p.m.
The low and high ticks in gold were reported as $2,635.60 and $2,667.90 in the February contract...an intraday move of about 32 bucks. The February/ April price spread differential in gold at the close in New York yesterday was $20.70...April/June was $21.20 -- and June/August was $19.70 an ounce.
Gold was closed on Friday afternoon in New York at $2,632.50 spot...up $1.40 on the day. Net volume was certainly on the lighter side at around 146,500 contracts -- and there were about 20,500 contracts worth of roll-over/switch volume on top of that.
I saw that 571 gold, plus 35 silver contracts were traded in December yesterday -- and I'll find out tonight if any of that shows up in either the Daily Delivery or Preliminary Reports later tonight.
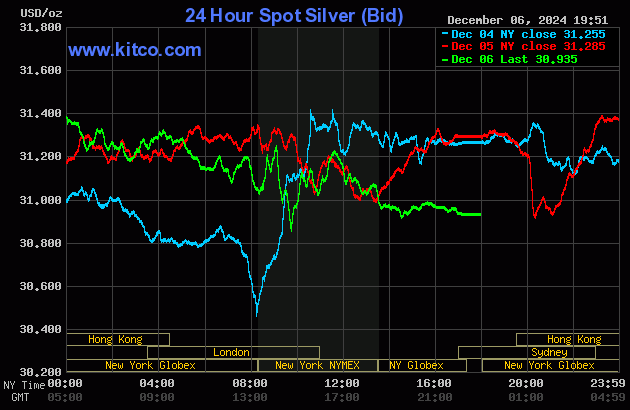
Silver's price path was engineered in a similar fashion as gold's up until shortly after 12 o'clock noon in Shanghai on their Friday morning -- and about an hour later the price pressure began -- and it was sold/engineered quietly and very unevenly lower until 2:30 p.m. in after-hours trading in New York. It had a quiet up/down move from that juncture until the market closed at 5:00 p.m. EST.
The low and high ticks in silver were recorded by the CME Group as $31.935 and $31.32 in the March contract...an intraday move of 61.5 cents...two percent. The March/May price spread differential in silver at the close in New York yesterday was 26.0 cents...May/July was also 26.0 cents -- and July/ September was 25.4 cents an ounce.
Silver was closed in New York on Friday afternoon at $30.935 spot...down 35 cents on the day -- and 46.5 cents off its Kitco-recorded high tick. Net volume was nothing really special at about 56,500 contracts -- and there were around 5,100 contracts worth of roll-over/switch volume in this precious metal.
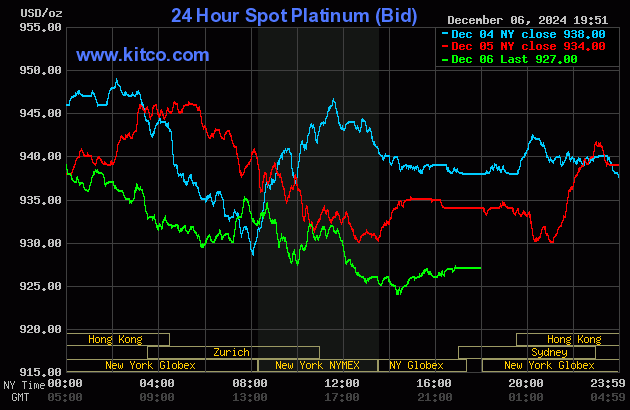
Platinum's price path was mostly similar to both silver and gold until noon China Standard Time on their Friday afternoon -- and from that juncture it was engineered two very broad and uneven steps lower until its low tick was set around 2:15 p.m. in after-hours trading in New York. It then crawled a few dollars higher until the market closed at 5:00 p.m. EST. Platinum was closed down a further 7 dollars on the day at $927 spot.
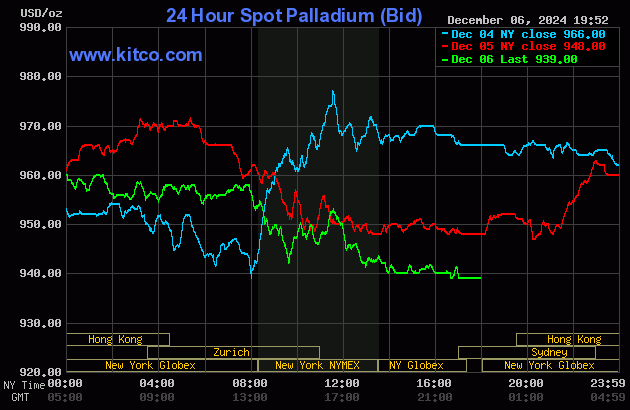
With some minor variations, palladium's price was managed in a similar fashion as platinum's -- and its uneven engineered price decline ended at 2 p.m. in after-hours trading in New York. It didn't do much of anything after that. Palladium was closed lower by a further 9 bucks at $939 spot.
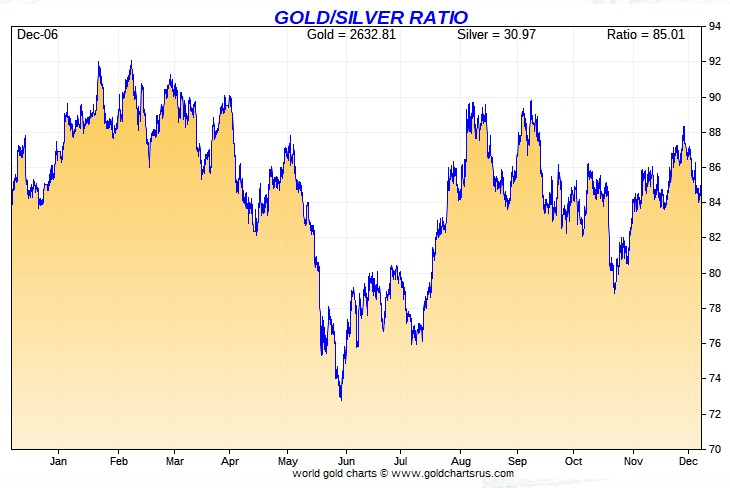
Based on the kitco.com spot closing prices in silver and gold posted above, the gold/silver ratio worked out to 85.1 to 1 on Friday...compared to 84.1 to 1 on Thursday.
Here's the 1-year Gold/Silver Ratio Chart...courtesy of Nick Laird. Click to enlarge.
![]()
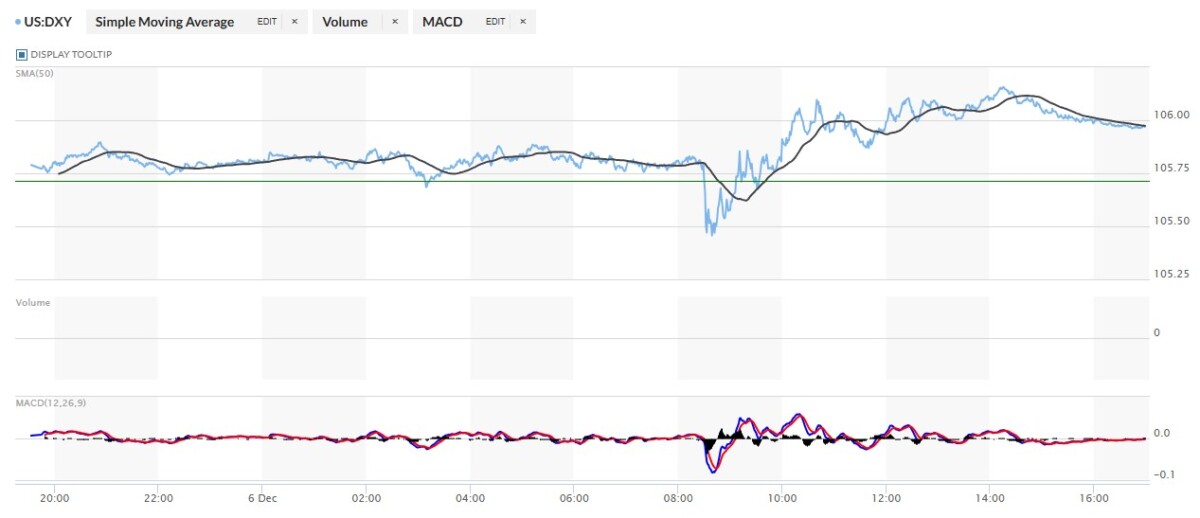
The dollar index closed very late on Thursday afternoon in New York at 105.71 -- and then opened higher by 8 basis points once trading commenced at 7:33 p.m. EST on Thursday evening, which was 8:33 a.m. China Standard Time on their Friday morning. It wandered very quietly and broadly sideways until that non-farm payroll number hit the tape at 8:30 a.m. in New York. A trap door opened under it, but the usual 'gentle hands' were there in an instant -- and from that point it chopped quietly higher at an ever-decreasing rate until around 2:15 p.m. EST. It then edged quietly lower until the market closed at 5:00 p.m.
The dollar index finished the Friday trading session in New York at 106.06...up 35 basis points from its close on Thursday.
Here's the DXY chart for Friday...thanks to marketwatch.com as usual. Click to enlarge.
Here's the 6-month U.S. dollar index chart, courtesy of stockcharts.com as usual. The delta between its close...106.04..and the close on DXY chart above, was 2 basis points below that. Click to enlarge.
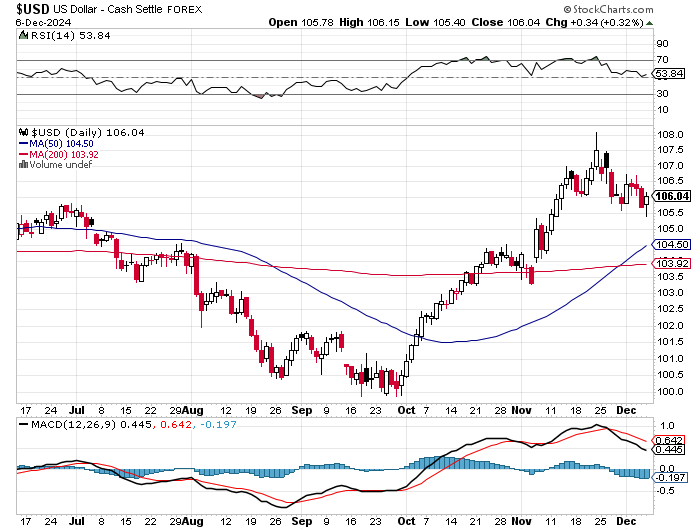
One would have to be mentally creative to see any correlation between the dollar index and precious metal prices on Friday -- and it's obvious that the powers-that-be stepped in to save the DXY from crashing at 8:30 a.m. in New York.
U.S. 10-year Treasury: 4.1510%...down 0.0290/(-0.69%)...as of the 1:59 p.m. CST close
Here's the 5-year 10-year U.S. Treasury chart from the yahoo.com Internet site -- which puts the yield curve into a somewhat longer-term perspective. Click to enlarge.
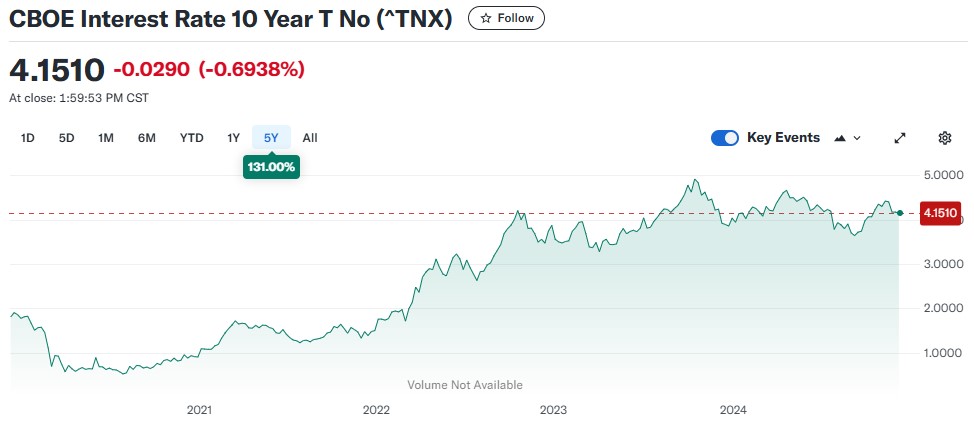
For the week, the ten-year was down about 7 basis points...but at its high on Wednesday, it was up about 5 basis points -- and it's obvious from its 5-day chart that Fed forcefully intervened from that point until trading ended on Friday.
READ THE FULL ARTICLE: https://silverseek.com/article/big-48-traders-continue-short-gold-silver

