
Yesterday in Gold, Silver, Platinum and Palladium

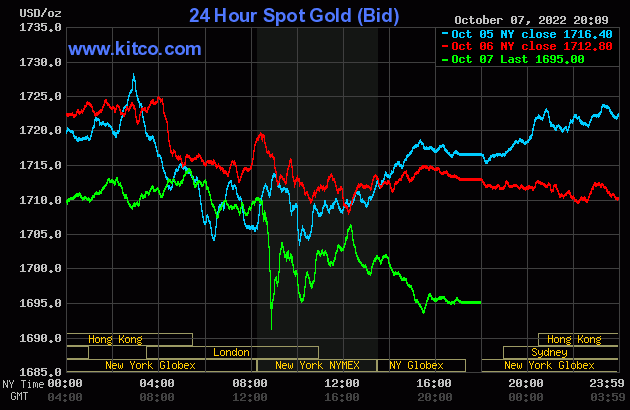
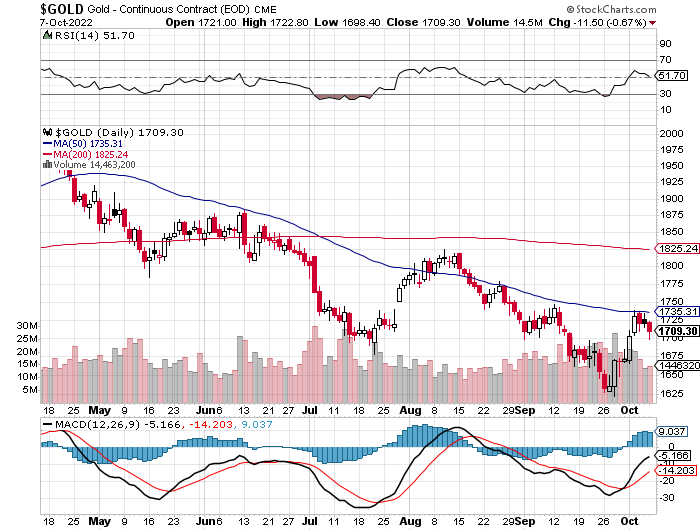
The gold price was sold quietly and a bit unevenly lower in GLOBEX trading until a couple of minutes before the London open on their Friday morning. It crawled a bit higher until at or shortly before the 10:30 a.m. morning gold fix over there -- and was then sold quietly lower until around 8:40 a.m. in New York. The commercial traders of whatever stripe then hammered its price lower with its low tick coming around 8:55 a.m. Its rally attempt from there ran into opposition all the way up until it was capped and turned lower for the final time around 12:20 p.m. EDT. Its ensuing price decline ended at 3:30 p.m. in after-hours trading -- and it managed to add on a few dollars before the market closed at 5:00 p.m. EDT.
The high and low ticks in gold were recorded as $1,722.80 and $1,698.40 in the December contract. The October/December price spread differential in gold at the close in New York yesterday was $8.80...December/February was $13.50 -- and February/April was $14.10 an ounce.
Gold was closed on Friday afternoon in New York at $1,695.00 spot, down $17.80 on the day. Net volume was on the quieter side at a tiny bit under 146,500 contracts -- and there was a bit over 12,000 contracts worth of roll-over/switch volume on top of that...mostly into February and April.
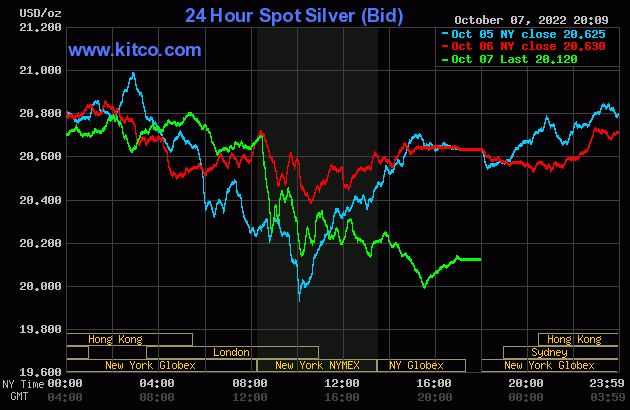
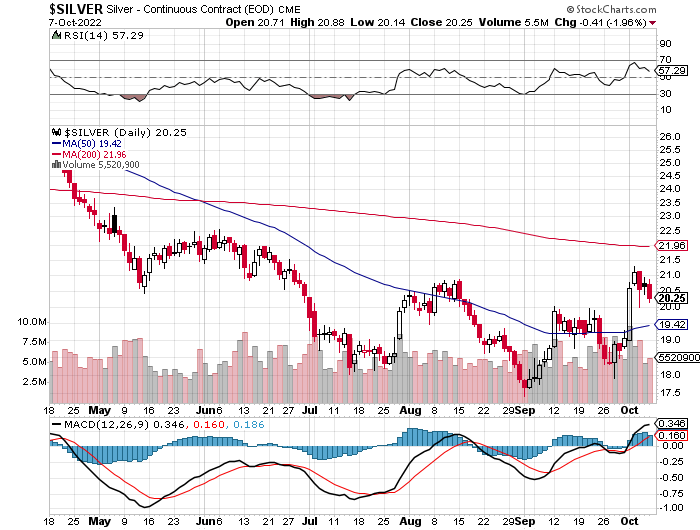
The silver price was managed in the exact same manner as gold's, with the only noticeable differences being that it was hammered lower right at the 8:30 a.m. EDT release of the jobs report -- and it's ensuing rally was capped at 9:35 a.m. in New York.
The high and low ticks in silver were reported by the CME Group as $20.875 and $20.02 in the December contract. The December/March price spread differential in silver at the close in New York yesterday was 8.9 cents -- and March/May was 12.7 cents an ounce.
Silver was closed in New York on Friday afternoon at $20.12 spot, down 51 cents from Thursday. At its low tick, 'da boyz' had it down to $19.97 spot. Net volume was slightly elevated at 55,000 contracts -- and there was just about 7,500 contracts worth of roll-over/switch volume in this precious metal...mostly into March, but with noticeable amounts into May, July and September of 2023 as well.
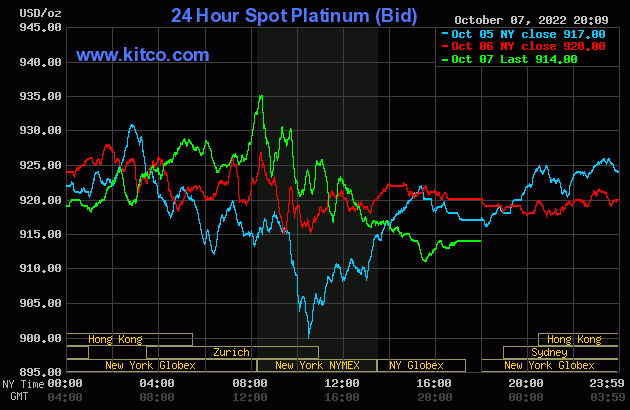
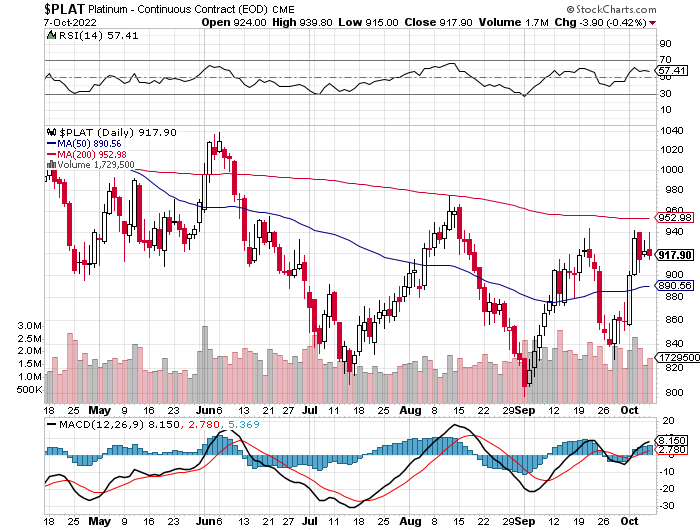
The platinum price wandered quietly sideways until minutes after 1 p.m. China Standard Time in GLOBEX trading on their Friday afternoon -- and its very uneven rally from there ran into 'da boyz' at the 8:30 a.m. jobs report in New York as well. Its choppy sell-off from there ended around 3:40 p.m. in after-hours trading and, like silver and gold, ticked a bit higher until the market closed at 5:00 p.m. EDT. Platinum was closed at $914 spot, down 16 bucks on the day.
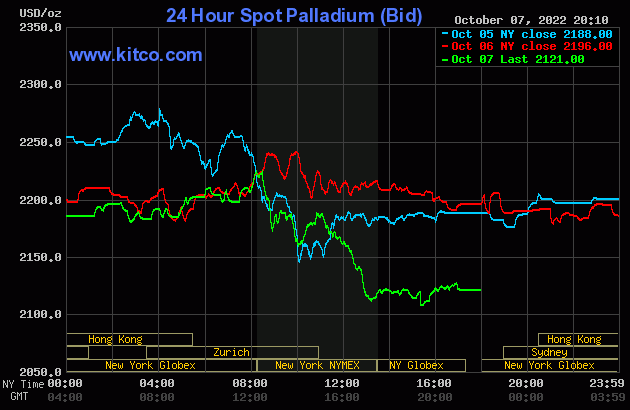
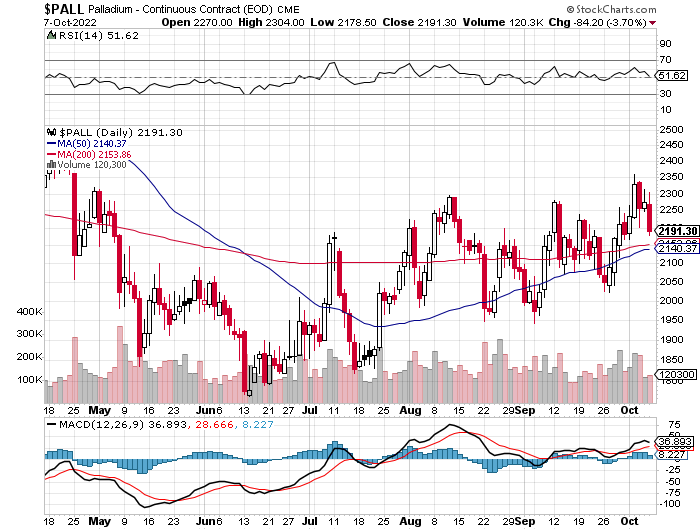
Palladium chopped very quietly lower until around 10:50 a.m. in GLOBEX trading in Zurich. It took two steps higher from there until it ran into 'da boyz' at 8:30 a.m. in COMEX trading in New York. It was sold lower until around 1:10 p.m. -- and also managed to tick a few dollars higher until trading ended at 5:00 p.m. EDT. Palladium was closed at $2,121 spot, down 75 dollars from Thursday's close.
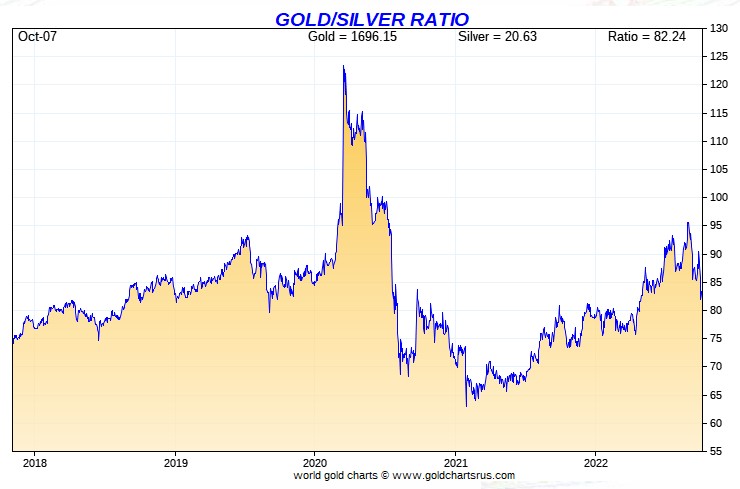
Based on the kitco.com closing spot prices in silver and gold posted above, the gold/silver ratio worked out to 84.2 to 1 on Friday...compared to 83.0 to 1 on Thursday.
And here's Nick Laird's 5-year Gold/Silver Ratio Chart, updated with this past week's data and, as is always the case, Friday's gold/silver ratio figure isn't on it. I thought I'd toss this one in to give a longer-term perspective on where we are vs. where we've been -- and just how far we have to go. Click to enlarge.

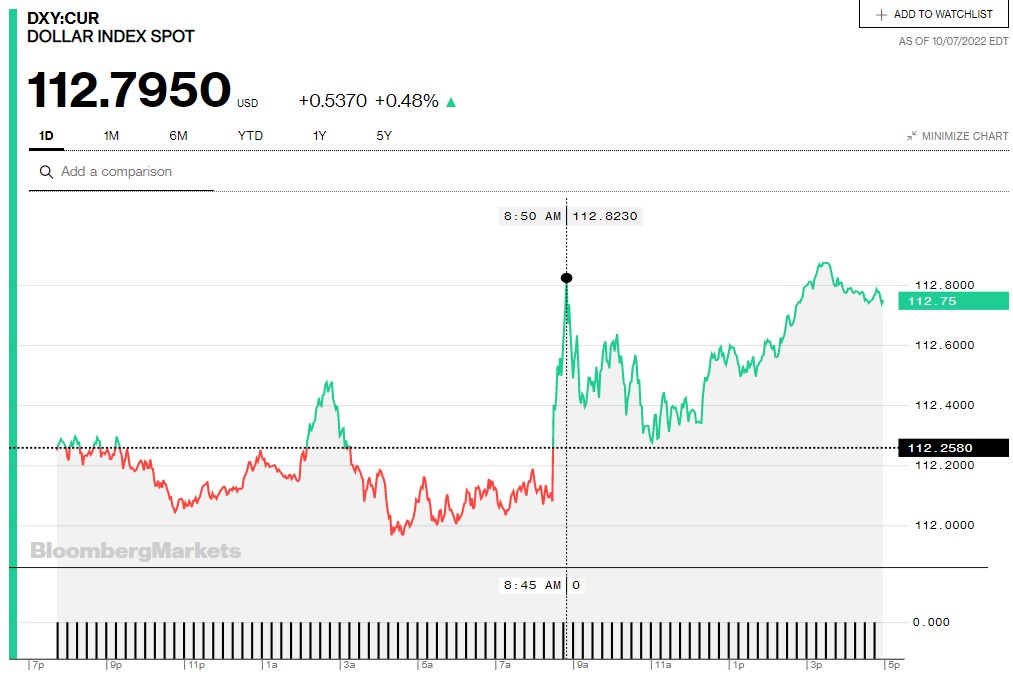
The dollar index closed very late on Thursday afternoon in New York at 112.26 -- and then opened down one basis point once trading commenced at 7:30 p.m. EDT on Thursday evening, which was 7:30 a.m. China Standard Time on their Friday morning. It chopped quietly sideways until around 9:17 a.m. CST -- and was then sold lower until 10:47 a.m. CST. Its ensuing rally topped out at 2:49 p.m. CST. It was then sold lower until around 9:40 a.m. in London -- and from that juncture it crept higher until a couple of minutes before the jobs report was released at 8:30 a.m. EDT in New York. It blasted higher until 8:50 a.m. -- and then chopped lower until exactly 11 a.m. EDT... the London close. From there it rallied until a couple of minutes before 3:30 p.m. -- and then faded a handful of basis points until the market closed at 5:00 p.m. EDT.
The dollar index finished the Friday trading session in New York at 112.80...up 54 basis points from its close on Thursday.
Here's the DXY chart for Friday, thanks to Bloomberg as usual. Click to enlarge.
And here's the 5-year U.S. dollar index chart that appears in this spot in every Saturday column...courtesy of stockcharts.com as always. The delta between its close...112.68...and the close on the DXY chart above, was about 12 basis points below its indicated spot close on Friday. Click to enlarge.
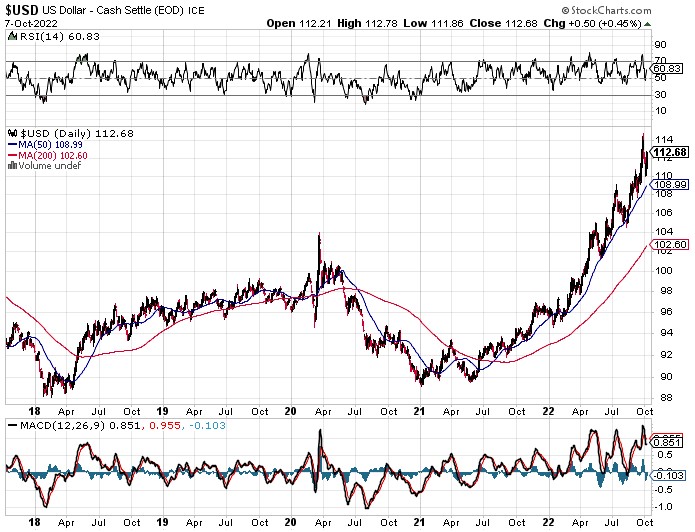
The DXY chart doesn't look quite as parabolic as did last week at this time, but its rise is still very dramatic. How long this will continue, or be allowed to continue, is unknown.
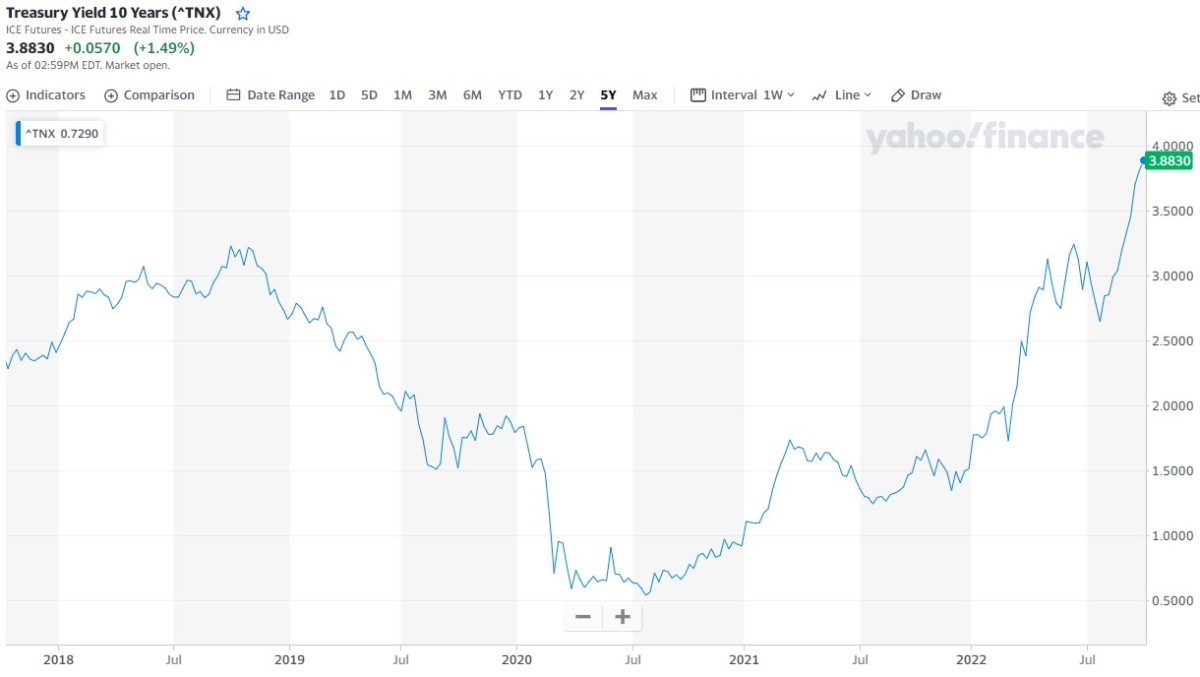
U.S. 10-Year Treasury Treasury: 3.8830%...up 0.0570 (+1.49%)...as of 02:59 p.m. EDT
Here's the 5-year 10-year U.S. Treasury chart from the yahoo.com Internet site -- and it puts the yield curve into a somewhat longer-term perspective. I note that the Fed has finally allowed its yield to exceed what was set back at its highs of September and October of 2018. It has been creeping quietly higher all this week -- and we'll found out soon enough whether or not it will be allowed to break above 4.00 percent on this attempt...or will there be another 'miracle' intervention from the Fed once again, like occurred last week. Click to enlarge.
In a story that reader George Whyte sent me earlier this week, the Fed already owns about 40% of the $31 trillion U.S. national debt.
And the problem in the derivatives market in the U.K. hasn't gone away. The 'gilt' buying by the Bank of England is supposed to end next Friday. My ten dollar bet is on the fact that it will be extended.

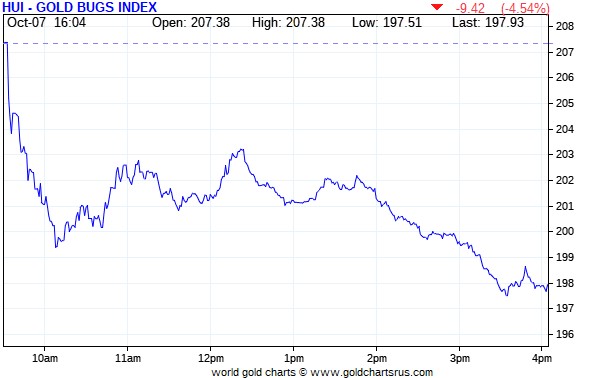
The gold shares headed sharply lower as soon as the markets opened at 9:30 a.m. in New York on Friday morning -- and that sell-off lasted until around 10:05 a.m. EDT. They struggled a bit higher until around 12:25 p.m. -- and it was all down hill from there until minutes after 3:30 p.m. They didn't do much after that. The HUI closed down a chunky 4.54 percent.
Computed manually, sansPeñoles once again, Nick Laird's Intraday Silver Sentiment/Silver 7 Index closed lower by 6.21 percent.
I left out Peñoles as it only traded 136 shares -- and closed up 1.69 percent.
Here's Nick's 1-year Silver Sentiment/Silver 7 Index chart, updated with Friday's candle. Click to enlarge.
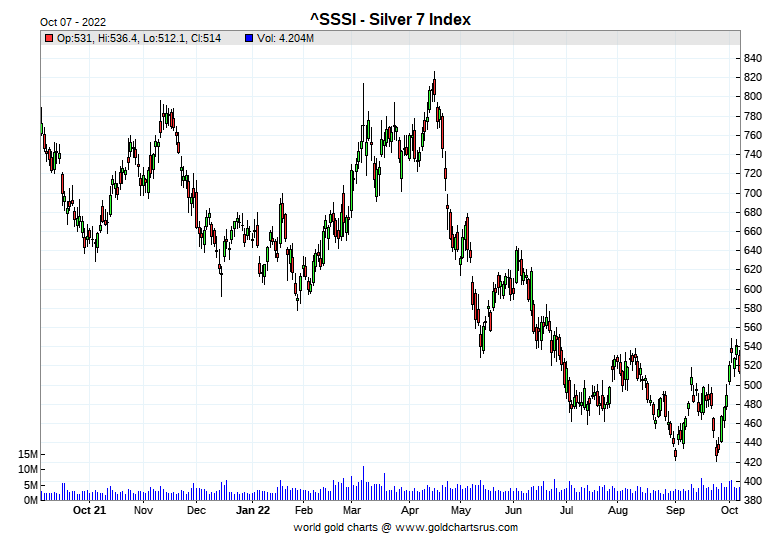
There certainly weren't any stars -- and the biggest pooch was the darling most of this past week, First Majestic Silver, as it got clocked by 8.45 percent...followed very closely by Coeur Mining, as it closed down 8.14 percent.
The latest silver eye candy from the reddit.com/Wallstreetsilver crowd is linked here.

Here are the two of the usual three charts that show up in every weekend missive. They show the changes in gold, silver, platinum and palladium in both percent and dollar and cents terms, as of their Friday closes in New York — along with the changes in the HUI and the Silver 7 Index.
Here's the weekly chart...which does double duty as the month-to-date chart for this week only -- and it's wall-to-wall green for the second week in a row, with the gold and silver equities performing equally against the identical changes in their underlying precious metals...also for the second week in a row. If it hadn't been for Friday's engineered price declines in everything precious metal-related, the chart would have looked even more spectacular. Click to enlarge.
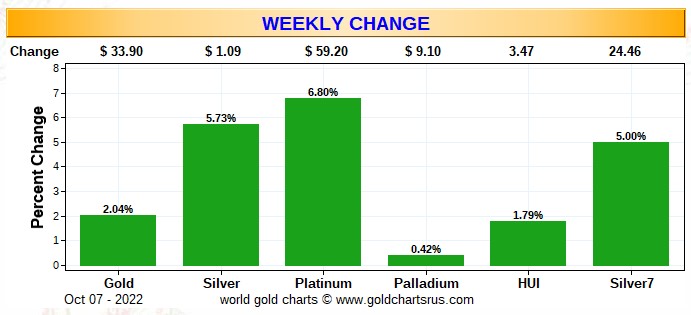
The month-to-date chart will return to this spot next week.
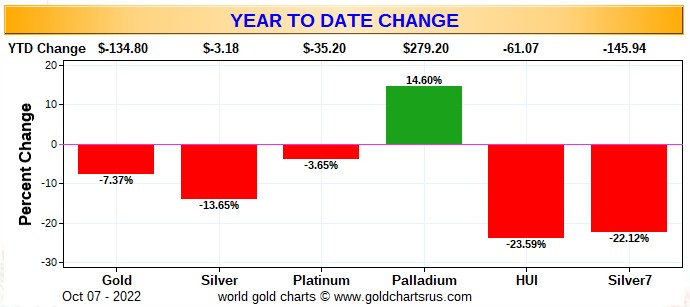
Here's the year-to-date chart and, with the exception of palladium, it's still wall-to-wall red. As I say in this space every week now, it's my opinion that there's been a very quiet and stealthy accumulation of silver equities going on in the deep background for quite some time -- and that fact is certainly obvious on this chart. The mark-down of Pan American Silver shares by that 4.68% more than a month ago now, was somewhat counterbalance by that big gain in Peñoles shortly after that. But even excluding that fact, just looking at the relative performance of their respective underlying precious metals, the silver stocks are obviously doing much better...relatively speaking of course. That will continue once a real rally in the precious metals is finally allowed to get underway. Click to enlarge.
Although I beat this to death every Saturday, what happens going forward continues to be in the hands of the Big 4/8 commercial shorts, as they alone...as you know all too well...either directly or indirectly control the prices of everything precious metals-related...until they don't. But they were certain in our face this past week, as you'll find out in my COT commentary a bit further down.

The CME Daily Delivery Report for Day 8 of October deliveries showed that 144 gold -- and 38 silver contracts were posted for delivery within the COMEX-approved depositories on Tuesday.
In gold, the only short/issuer that mattered was S.G. Americas, as they issued 138 contracts from their client account -- and Marex Spectron issued the remaining 6 from their client account as well. The three largest of the eight long/stoppers in total were led by JPMorgan of course, as they picked up 81 contracts for their client account. BofA Securities stopped 30 contracts in total...29 for their house account -- and the remaining contract for a client. Marex Spectron picked up 17 contracts for clients.
In silver, the largest of the five short/issuers was RBC Capital Markets, with 25 contracts out of its client account. The two long/stoppers were ADM and Advantage, as they picked up 35 and 3 contracts for their client accounts.
In platinum, there was 1 contract issued and stopped.
The link to yesterday's Issuers and Stoppers Report is here.
So far this month there have been an astonishing 21,519 gold contracts issued/reissued and stopped -- and in silver, that number is only 359 contracts. In platinum it's 256 contracts -- and in palladium, it's zero.
Ted was mulling over the idea that maybe these surprisingly large deliveries in October may be related to short covering amongst the various bullion banks -- and I'm hoping he'll expand on this in his weekly review this afternoon.
The CME Preliminary Report for the Friday trading session showed that gold open interest in October rose by 32 contracts, leaving 601 still around, minus the 144 contracts mentioned a bunch of paragraphs ago. Thursday's Daily Delivery Report showed that 41 gold contracts were actually posted for delivery within the COMEX-approved depositories on Monday, so that means that 41+32=73 more gold contracts just got added to the October delivery month. Silver o.i. in October fell by 31 contracts, leaving 77 contracts still around, minus the 38 contracts mentioned a bunch of paragraphs ago. Thursday's Daily Delivery Report showed that 68 silver contracts were actually posted for delivery within the COMEX-approved depositories on Monday, so that means that 68-31=37 more silver contracts were added to October deliveries.
Total gold open interest at the close on Friday rose by 756 COMEX contracts -- and total silver o.i. increased by 110 contracts. Both numbers are subject to some revision by the time the final figures are posted on the CME's website later on Monday morning CDT.
There was a withdrawal from GLD yesterday, as an authorized participant removed 65,187 troy ounces of gold -- and there were no reported changes in SLV.
In other gold and silver ETFs and mutual funds on Planet Earth on Friday, net of any changes in COMEX, GLD and SLV inventories, there was a net 23,906 troy ounces of gold taken out...but 79,662 troy ounces of silver was added.
Once again, there was no sales report from the U.S. Mint yesterday -- and no sales month-to-date so far.
There was some activity in gold over at the COMEX-approved depositories on the U.S. east coast on Thursday. Nothing was reported received -- and 69,156 troy ounces was shipped out -- and all of that amount left Brink's, Inc.
There was a whole bunch of paper activity, as 189,115 troy ounces was transferred from the Registered category and back into Eligible. Four different depositories were involved -- and the two largest amounts were the 122,893 troy ounces that was transferred in that direction over at JPMorgan...plus the 56,894 troy ounces that made that same trip over at HSBC USA.
The link to all of Thursday's COMEX activity in gold, is here.
The frantic in/out activity in silver continued unabated on Thursday, as 1,186,312 troy ounces was reported received -- and 1,297,972 troy ounces was shipped out.
The largest 'in' amount was the 600,343 troy ounces, one truckload, that arrived at CNT -- and one truckload...585,968 troy ounces...was dropped off at Loomis International.
In the 'out' category, the largest amount was the 725,261 troy ounces that left CNT -- and one truckload...572,711 troy ounces...departed HSBC USA.
There was a bit of paper activity as well -- and all of it involved transfers from the Registered category and back into Eligible once more...14,601 troy ounces at HSBC USA...10,087 troy ounces at Manfra, Tordella & Brookes, Inc. -- and the remaining 9,599 troy ounces made that trip in the same direction over at Loomis International.
The link to all of Thursday's considerable COMEX activity in silver, is here.
There was only a tiny amount of activity over at the COMEX-approved gold kilobar depositories in Hong Kong on their Thursday. There were 277 kilobars received at Brink's, Inc. -- and that as it. The link to that, in troy ounces, is here.

Here are the usual 20-year charts that show up in this space in every Saturday column. They show the total amount of physical gold and silver held in all know depositories, ETFs and mutual funds as of the close of business on Friday.
During the week just past, there was only a net 106,000 troy ounces of gold removed -- but a net 13.671 million troy ounces of silver was taken out. That weekly decrease in silver was mostly because of the 8+ million troy ounces that was withdrawn from SIVR earlier this week...the third withdrawal of about that amount from SIVR in the last three weeks. One would suspect that this wasn't 'plain vanilla' retail investor liquidation.
Here are Nick's two charts showing the above changes. Click to enlarge for both.
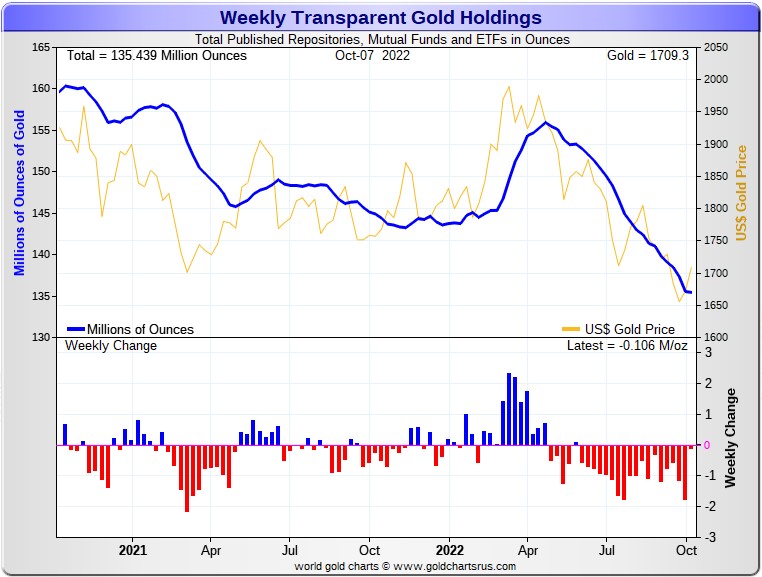
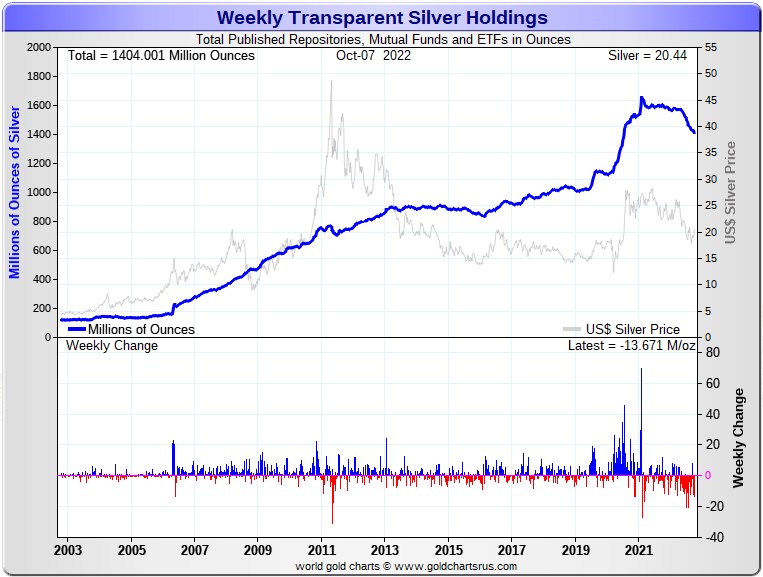
According to Nick Laird's data on his website, there has been a net 3.33 million troy ounces of gold -- and a net 24.78 million troy ounces of silver removed from all the world's known depositories, mutual funds and ETFs during the last four weeks.
In silver...11.62 million troy ounces net came out of the COMEX, mostly JPMorgan -- and 4.56 million troy ounces net was added to SLV. Lastly was the net 18.71 million troy ounce that was removed from the rest of the world's ETFs and mutual funds combined over that time period -- and most of that amount was comprised of the three big withdrawals from SIVR.
In gold over the last month, the withdrawals were mostly JPMorgan-related at the COMEX...853,800 troy ounces. GLD/GLDM accounted for 737,700 troy ounces -- and the rest...1.735 million troy ounces, from the other ETFs and mutual funds.
The physical shortage in silver appears to be just as extreme this week as it was last week -- and the week before.
And one has to wonder just how much of these silver withdrawals we've witnessed these past week and months are industrial user-related...or conversion of shares for physical metal. It certainly appears that a lot of these conversions of shares for physical are heading overseas to India and China. I'm certainly looking forward to the next set of silver import numbers for these two countries that are due out sometime this month.
Then there's the amount of silver that has been transferred from the Registered category and back into Eligible that's been going on for many months now -- and continued unabated this week. What is to be made of that?...or the continuing decline in silver holdings at the LBMA.
Retail silver demand has picked up enormously recently, as silver investors appear to buying this dip with more than the usual amount of enthusiasm.
From what I've seen from the various precious metal websites I lurk at, there's a growing shortage of all kinds of retail product. Some dealers are running on empty, or close to it, according to those posting over at the Wallstreetsilver website -- and the phone calls I've made.
But the real shortage that will matter will manifest itself in the wholesale good delivery bar market when the serious money starts flowing into the world's various and sundry, depositories, ETFs and mutual funds...especially SLV when the next big rally is allowed to begin. When that happens, where on earth are all those tens of millions of ounces of silver to satisfy that demand going to come from?
One has to suspect that with the signs of physical tightness everywhere one cares to look in the wholesale silver market, the day of reckoning we've all been waiting for, can't be that far off....but the Big 4/8 silver shorts continue to resist the inevitable.
Of course not to be forgotten about SLV is this not so little matter of the 59+ million troy ounces/shares currently sold short in this ETF. That's down only a million ounces from the previous short report. The reason that number remains stubbornly high is certainly because the physical metal doesn't exist to deposit without driving the silver price to the moon...if it's even available in good delivery bar form at all.
The next short report comes out on Tuesday -- and I'll be more than interested in what's in it, as will Ted. That data will be in my Wednesday column in its usual spot.
Of course there's still that other little matter of the 1 billion ounce short position held by Bank of America...with JPMorgan & Friends on the long side...that Ted cottoned on to some time ago.
And in closing here, I'll mention once again that it's a certainty that all of the precious metals in these funds are held by the strongest of hands -- and it's equally certain that this applies to every troy ounce that has been withdrawn or converted from them as well.

The Commitment of Traders Report, for positions held at the close of COMEX trading on Tuesday did not make for happy reading, which was expected. But it was materially worse in gold. There were other big and rather shocking surprises in it as well.
In silver, the Commercial net short position increased by 10,757 COMEX contracts, or 53.79 million troy ounces. This wasn't as bad as Ted feared it might be. In his mid-week commentary for his paying subscribers on Wednesday, he said that "It wouldn’t surprise me if managed money buying (short-covering and new buying) exceeded 20,000 net contracts."
The fact that this didn't happen, was just about the only good news in yesterday's COT Report.
The commercial traders arrived at that above number by reducing their long position by 1,238 COMEX contracts -- and also added 9,519 new short contracts. It's the sum of those two numbers that represents their change for the reporting week.
Under the hood in the Disaggregated COT Report, it was all Managed Money traders, plus a whole bunch more, as they were big buyers as expected, as they bought 13,730 COMEX contracts...mostly by reducing their net short position by 10,274 contracts. The traders in the Nonreportable/small trader category were buyers as well, as they increased their net long position by 2,807 contracts. This means that the traders in the Other Reportables category were sellers -- and they were, as they reduced their net long position by 5,780 COMEX contracts.
Doing the math: 13,730 plus 2,807 minus 5,780 equals 10,757 COMEX contracts...the change in the Commercial net short position.
And before proceeding further, I'll point out that the Managed Moneytraders in silver werenet short the COMEX futures market by 8,093 COMEX contracts/40.47 million troy ounces in last week's COT Report. But as of this week's report, they are back to being net long the silver market by 5,637 COMEX contracts, or 28.19 million troy ounces...a swing of 68.66 million troy ounces in one week. But I'm sure that it's less than that now since the Tuesday cut-off.
The Commercial net short position in silver now sits at 88.09 million troy ounces in this week's report. That's up from the 34.30 million troy ounces that they were net short in last week's COT Report...an increase of 88.09-34.30= 53.79 million troy ounces/10,758 COMEX contracts. That 53.79 million troy ounce change is obviously the headline number mentioned further up.
The Big 8 [which still has at least two Managed Money traders in it according to Ted] are short 317.3 million troy ounces in this week's COT Report, down a bit from the 325.1 million troy ounces they were short in last Friday's COT Report.
As you know, the Big 8 short position is not a pure commercial trader number, because Ted says that there are at least two Managed Money traders in that category....one in the Big 4 -- and the others in the Big '5 through 8'.
And this is where the big disappointment showed up.
Ted pegs the commercial-only component of the big 4 short position – which was 225.4 million troy ounces on a combined basis – to now be around 175 million troy ounces...up 45 million troy ounces from last week. The posted big 8 combined short position was 317.3 million troy ounces -- and the commercial-only component was 260 million troy ounces...up 50 million ounces from last week.
The reason that the Big 8 commercial traders increased their short positions by as much as they did...50 million troy ounces during the reporting week was the fact that Ted's raptors, the small commercial traders other than the Big 8, did almost nothing during the reporting week...reducing their long position by only about 10 million troy ounces -- and are still net long the COMEX futures market by around 175 million troy ounces.
Both Ted and I were more than surprised by this, as we were expecting the bulk of the long selling by the commercials to come via these raptors...as they always sell for big profits on rallies like we had during the past reporting week. For whatever reason, that didn't happen -- and forced the Big 4/8 commercial traders to step in to prevent the silver price from blowing sky high.
Here's the 9-year COT chart for silver that puts thing in a longer-term perspective...courtesy of Nick Laird as always. Click to enlarge.
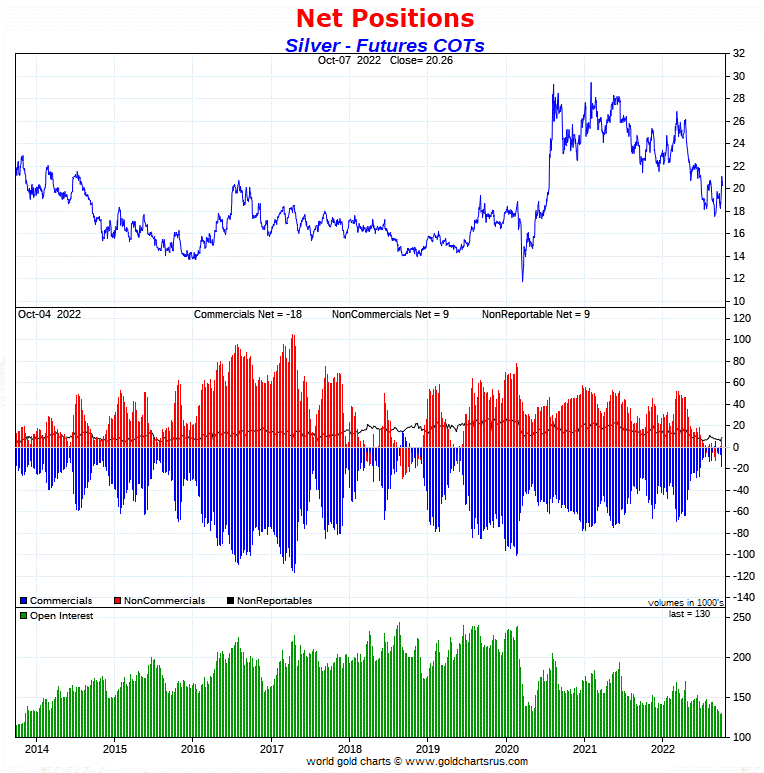
There's no way to sugar-coat this COT Report in silver, as it appeared on the surface to be the "same old, same old"...but that's entirely due to the fact that the raptors didn't follow their usual script -- and why they didn't, is a mystery.
But it was more than disconcerting to see the Big 4/8 commercial shorts show up in force in their stead. They're obviously not going to allow silver prices to rise until they're ready -- and this past week was obviously wasn't it.
Without doubt, these same commercial traders have been able to reduce their increased short position since the Tuesday cut-off -- and there are still two more trading days left in the reporting week for next week's COT Report.
The set-up in the COMEX futures market in silver is still wildly bullish, but not as white hot as it was a week ago.
And as a bad as it was in silver, it was even worse in gold.
This was unexpected, as none of the major moving averages were broken to the upside during the reporting week's big rally. Both Ted and I knew there would be some deterioration, but not anywhere near as much as the report showed.
In gold, the commercial net short position increased by an eye-watering 34,410 COMEX contracts, or 3.44 million troy ounces of the stuff.
They arrived at that number by reducing their long position by 22,910 COMEX contracts -- and also added 11,500 short contracts. It's the sum of those two numbers that represents their change for the reporting week.
Under the hood in the Disaggregated COT Report, it was all Managed Money trader buying, plus a bit more, as they reduced their net short position by 36,219 COMEX contracts. The Nonreportable/small traders reduced their net long position by 1,894 contracts -- and the Other Reportables did nothing... increasing their net long position by a piddling 85 contracts.
Doing the math: 36,219 minus 1,894 plus 85 equals 34,410 COMEX contracts, the change in the commercial net short position.
In last week's COT Report, the Managed Money traders were net short 43,094 COMEX contracts/4.31 million troy ounces of gold. As of yesterday's COT Report, these same Managed Money traders are still net short, but only by 6,875 COMEX contracts/0.69 million troy ounces. That's still very bullish, but obviously not as wildly bullish as it was last week.
But it's a certainty that, like in silver, they've been back on the sell side since the Tuesday cut-off.
The commercial net short position in gold sits at 9.65 million troy ounces, up 3.44 million troy ounces from the 6.21 million troy ounces they were short in last Friday's COT Report...that 3.44 million troy ounce number is the change in the headline number mentioned earlier.
The short position of the Big 8 traders works out to 15.87 million troy ounces, up 1.15 million troy ounces from the 14.72 million troy ounces they were short in the prior week's COT Report.
The short position of the Big 4 traders is 9.48 million troy ounces, up 0.70 million troy ounces from the 8.78 million troy ounces they were short in last week's report.
Ted said that there was one big Managed Money traders in both the Big 4 and Big '5 through 8' short categories in last week's COT Report -- and whether they're both still there in this week's COT Report is something I forgot to ask him when we were number crunching yesterday.
But his back-of-the-envelope calculation suggests that the 'commercial only' component of the Big 8 shorts rose to 13.3 million troy ounces...up big from the 10.5 million troy ounces they were short in last week's report. And the 'commercial only' component of the Big 4 shorts is up to 7.3 million troy ounces...an increase of 2.8 million troy ounces from the 4.5 million they were short in last week's COT Report. This means that the Big 4 shorts were responsible for all the selling during the reporting week.
And like in silver, Ted's raptors didn't follow their usual script, as they only sold about 6,000 COMEX contracts/0.6 million troy ounces of their long position during the reporting week -- and are still net long gold by around 37,000 contracts/3.7 million troy ounces.
So this was proof positive of what Ted has always said, if any more proof was needed, that the Managed Money traders et al. are always buyers -- and the commercial traders of whatever stripe are always sellers on any rallies that we see. This is how the commercial traders control its price. Ditto for silver -- and any other precious metal.
Here's Nick Laird's 9-year COT chart for gold, updated with Friday's data. Click to enlarge.
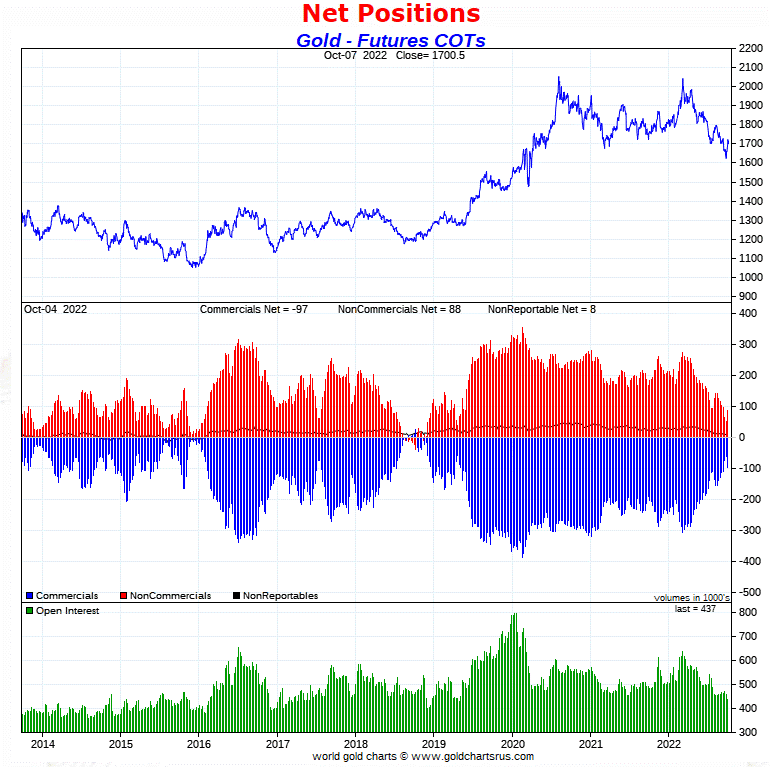
To say that the COT Report was a big shocker would be an understatement.
Like in silver, the lack of raptor long selling forced the Big 4/8 commercial shorts to step in to prevent its price from rising to the moon and the stars -- and if not that, at least prevent gold from breaking above any major moving average that mattered most to the Managed Money traders. It was halted right below its 50-day moving average.
But these Managed Money traders were still big buyers during the reporting week -- and although I forgot to bring up the subject with Ted, it should be assumed that those Managed Money traders that were buying and covering short positions hand over fist, were most likely the two Managed Money traders that had their necks stuck out the most on the short side.
Like in silver, the COMEX futures market in gold is not as white-hot bullish this week as it was this time last week -- and as I also mentioned about silver, the Big 4/8 shorts were most likely covering some of their newly-acquired short positions since the Tuesday cut-off.
Where we go from here remains to be seen, but it is blatantly obvious that the Big 4/8 shorts weren't about to give up managing the precious metal prices this past week.
So it's the "same old, same old" until further notice.
But, as Ted mentioned on the phone, the drum-beat of physical shortages continues to grow louder in the background. This is especially true in silver.
In the other metals, the Managed Money traders in palladium increased their net long position by a further 434 COMEX contracts. They are now net long palladium by 760 contracts. In platinum, the Managed Money traders decreased their net short position by 4,776 COMEX contracts -- and are now net short platinum in the COMEX futures market by only 2,098 contracts. Platinum, like silver, is a bifurcated market in the commercial category, with the Producer/Merchants mega net short -- and the Swap Dealers mega net long.
In copper, the Managed Money traders decreased their net short position by 8,218 COMEX contracts -- and are now net short copper by only 2,978 COMEX contracts...about 74 million pounds of the stuff, which is nothing at all. And, like in platinum and silver, copper is a totally bifurcated market in the commercial category. The Producer/Merchants are net short copper by a very decent amount -- and the Swap Dealers are mega net long.
Whether these bifurcated markets mean anything or not, will only be known in the fullness of time. Ted says it doesn't mean anything as far as he's concerned, as they're all commercial traders in the commercial category.
In this vital industrial commodity, the world's banks...both U.S. and foreign... are net long 13.1 percent of the total open interest in copper in the COMEX futures market as of yesterday's Bank Participation Report...down a bit from the 14.3 percent they were net long in August. So it's the commodity trading houses such as Glencore et al., along with some hedge funds, that are mega net short copper.

Here’s Nick Laird’s “Days to Cover” chart, updated with the COT data for positions held at the close of COMEX trading on Tuesday, October 4. It shows the days of world production that it would take to cover the short positions of the Big 4 — and Big '5 through 8' traders in each physically traded commodity on the COMEX.
I consider this to be the most important chart that shows up in the COT series -- and it always deserves a moment of your time...but continues to come with a big caveat attached -- and mentioned in the next paragraph.
Although still important, it must be remembered that the Big 4/8 short categories in the four precious metals...along with a bunch of other commodities, including copper and WTIC...are contaminated by the short positions of Managed Money traders that are embedded in each, so this chart is not at all accurate. The take-away here is that the short positions/days of world production of a lot of these COMEX-traded commodities is far less than what this chart indicates.
For that reason, it should be viewed for its 'entertainment value' only -- although the overall 'shape' of the chart would be about right...just not the number of day short held in each by the commercial traders. Most are a lot less than shown...as you'll see in silver below. Click to enlarge.
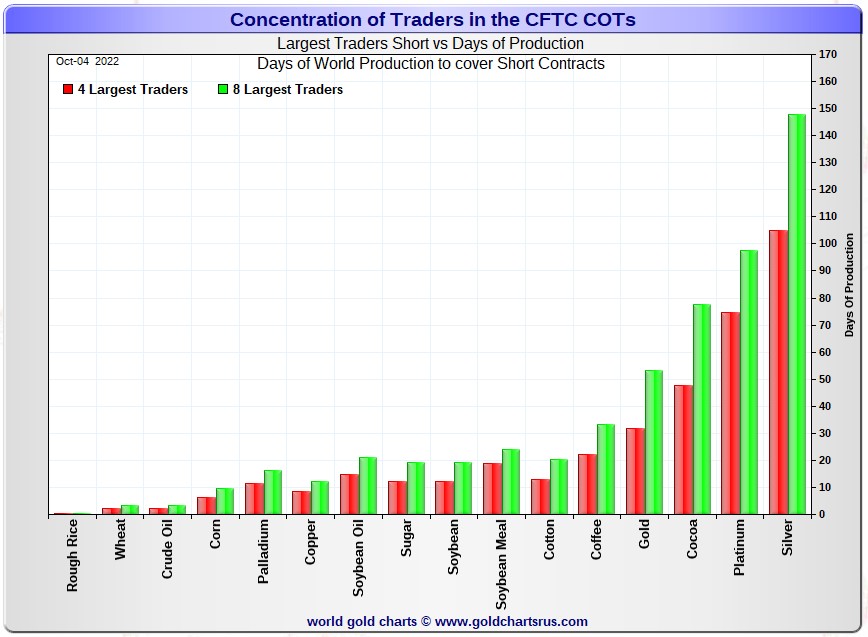
But the information that follows is accurate, as I'm able to compute this data manually.
In this week's 'Days to Cover' chart, the Big 4 traders are short about 105 days of world silver production, up about 5 days from last week's COT Report. The ‘5 through 8’ large traders are short an additional 43 days of world silver production, down about 8 days from last Friday's report, for a total of about 148 days that the Big 8 are short -- down about 3 days from last week's COT Report.
[Note: As of last week's report, Ted says there were two Managed Money traders in the Big 8 short category -- and whether they are both still there or not as of yesterday's COT Report, is something that I forgot to ask him yesterday. Regardless of that, this fact distorts the numbers you see above -- and the distortions in silver are now so great, that I'm not going to bother doing much in the way of calculations...just approximations.]
I suspect that the big drop in the '5 through 8' category is the result of a Managed Money trader disappearing out of that category -- and it was the Big 4 that did most of the shorting during the reporting week.
That 148 days that the Big 8 traders are short, represents just about five months of world silver production, or 317.3 million troy ounces/63,466 COMEX contracts of paper silver held short by these eight traders...at least one of which is a Managed Money trader.
Ted said that the 'commercial only' component of this number was around 265 million troy ounces, which works out to about 121 days of world silver production held by these Big 8 commercial traders...a lot different that the 148 days that's shown on the 'Days to Cover' chart posted above. He also said that the Big 4 commercial traders are short around 175 million troy ounces -- and that works out to about 81 days of world silver production, which is hugely different from the 105 days on the chart above.
Ted said that his raptors, the 22-odd small commercial traders other than the Big 8 shorts, are net long silver by around 175,000 contracts...down only 10 million troy ounces from the 185 million they were long in last week's COT Report. This is why the big commercial shorts had to step in a big way this past reporting week in order to prevent a silver price explosion.
In gold, the Big 4 are short 32 days of world gold production, up 3 days last Friday's COT Report. The '5 through 8' are short 21 days of world production, up about 1 day from last week...for a total of 53 days of world gold production held short by the Big 8 -- and obviously up 4 days from last Friday's COT Report. Based on these numbers, the Big 4 in gold hold about 60 percent of the total short position held by the Big 8...up about 1 percentage point from last Friday's COT Report. These are still very bullish numbers.
As of last week's COT Report, as mentioned earlier, it appeared that there is one Managed Money trader in each of the Big 4 and Big '5 through 8' categories in gold -- and that certainly affects the above numbers. Whether those two big Managed Money shorts are both still there is something else I forgot to ask Ted about in our telephone conversation yesterday.
So, like for silver, the days of world production held short by the commercial traders in gold is a very decent amount less than shown in the previous paragraph and, for the same reasons, this applies to platinum and palladium as well...plus copper and WTIC.
The Big 8 traders are short 49.0 percent of the entire open interest in silver in the COMEX futures market, which is down a bit from the 50.4 percent they were short in the last COT report. And once whatever market-neutral spread trades are subtracted out, that percentage would be something over the 55 percent mark. In gold, it's 36.3 percent of the total COMEX open interest that the Big 8 are short, up a decent amount from the 32.2 percent they were short in last Friday's COT Report -- and something just over the 40 percent mark once their market-neutral spread trades are subtracted out.
That percentage increase in gold was also influenced by the fact that total open interest in gold dropped by 4.5 percent during the reporting week.
But remember there are still Managed Money traders contaminating the Big 4/8 short positions. Because of that, these numbers are actually far less than stated, particularly in silver...as I pointed out a few paragraphs earlier.
The Big 4/8 commercial traders are still a force to be reckoned with in gold and silver -- and they raised their ugly heads once more in this week's COT Report.
And as Ted always and correctly points out, we won't know that the lows are in until we see them in the rear-view mirror. So far, we've been fooled more than several times since these engineered declines commenced starting at the blow up in the LME nickel market back on March 8.
As I keep reminding you in this spot every Saturday, the circumstances in silver have been altered by an unimaginable [and monstrously bullish] amount by Ted's discovery of the 1 billion troy ounce physical short position in silver that Bank of America holds in the OTC market, courtesy of JPMorgan & Friends ...along with the big increase in Goldman's derivatives position in silver in that market. They've increased even more in the latest OCC Report for Q2/2022... which Ted figures is a long position.
The situation regarding the Big 4/8 concentrated commercial short positions in silver, gold is still obscene to some extent -- and they're obviously still throwing their weight around.
As Ted has been pointing out ad nauseam forever, the resolution of the Big 4/8 short positions will be the sole determinant of precious metal prices going forward...with that resolution currently obviously still a work in progress at the moment.
And, as always, nothing else matters -- and I certainly look forward to what he has to say in his weekly review later this afternoon EDT.

The October Bank Participation Report [BPR] data is extracted directly from yesterday's Commitment of Traders Report. It shows the number of futures contracts, both long and short, that are held by all the U.S. and non-U.S. banks as of Tuesday’s cut-off in all COMEX-traded products. For this one day a month we get to see what the world’s banks are up to in the precious metals. They’re usually up to quite a bit -- and they certainly were again last month.
[The October Bank Participation Report covers the time period from September 6 to October 4 inclusive.]
In gold, 5 U.S. banks are net short 45,546 COMEX contracts in the October BPR. In September’s Bank Participation Report [BPR] these same 5 U.S. banks were net short 42,735 contracts, so there was an increase of 2,811 COMEX contracts month-over-month, which isn't a lot. But it was the first time in six months that the U.S. banks increased their short position in gold.
Citigroup, HSBC USA, Bank of America and Morgan Stanley would most likely be the U.S. banks that are short this amount of gold. I still have my usual suspicions about the Exchange Stabilization Fund, although if they're involved, they are most likely just backstopping these banks.
Also in gold, 23 non-U.S. banks are net short 32,761 COMEX gold contracts. In September's BPR, 27 non-U.S. banks were net short 40,855 contracts...a decrease of 8,094 contracts. I was expecting this big drop to show up last month, but it didn't. This is the smallest short position held by the non-U.S. banks since October of 2018 -- and whether that means anything or not, remains to be seen.
At the low back in the October 2018 BPR...these same non-U.S. banks held a net short position in gold of only 1,960 contacts -- so they've been back on the short side in an enormous way ever since.
I suspect that there are at least three large banks in this group, HSBC, Barclays and Standard Chartered. I still harbour suspicions about Scotiabank/ Scotia Capital, Dutch Bank ABN Amro, French bank BNP Paribas, plus Australia's Macquarie Futures. Other than that small handful, the short positions in gold held by the vast majority of non-U.S. banks are immaterial and, like in silver, have always been so.
As of this Bank Participation Report, 28 banks [both U.S. and foreign] are net short 17.9 percent of the entire open interest in gold in the COMEX futures market, which is exactly unchanged from the 17.9 percent that 32 banks were net short in the September BPR.
Although the largest U.S. and foreign bullion banks dominate the Big 4/8 short category in gold, there are still some hedge fund/trading houses that are short considerable amounts of gold as well.
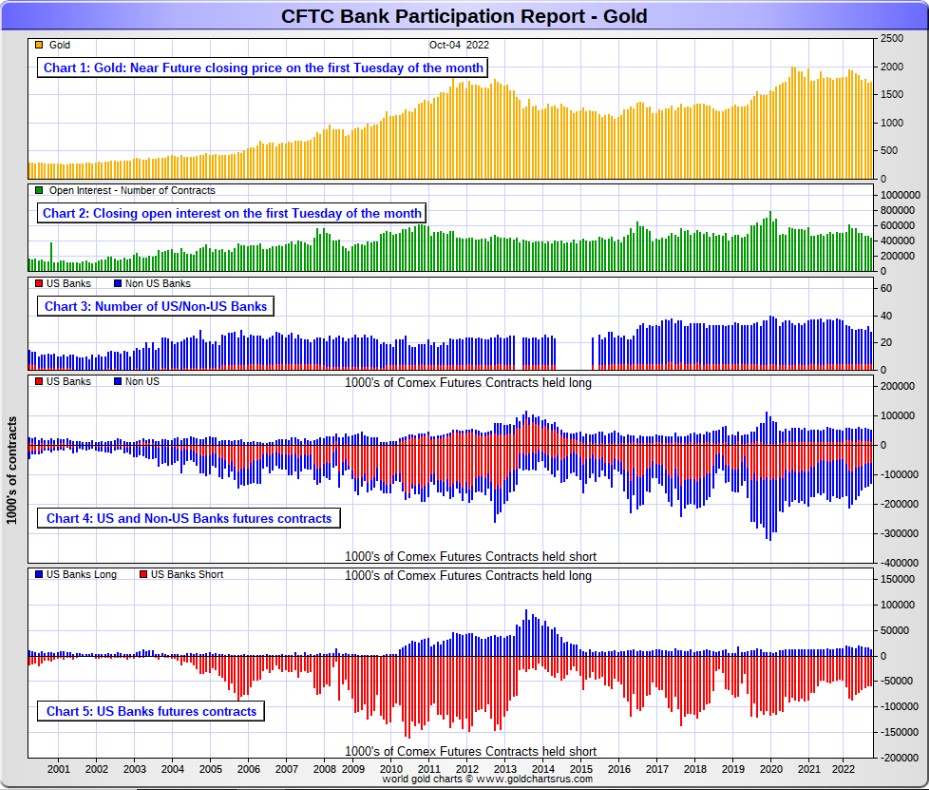
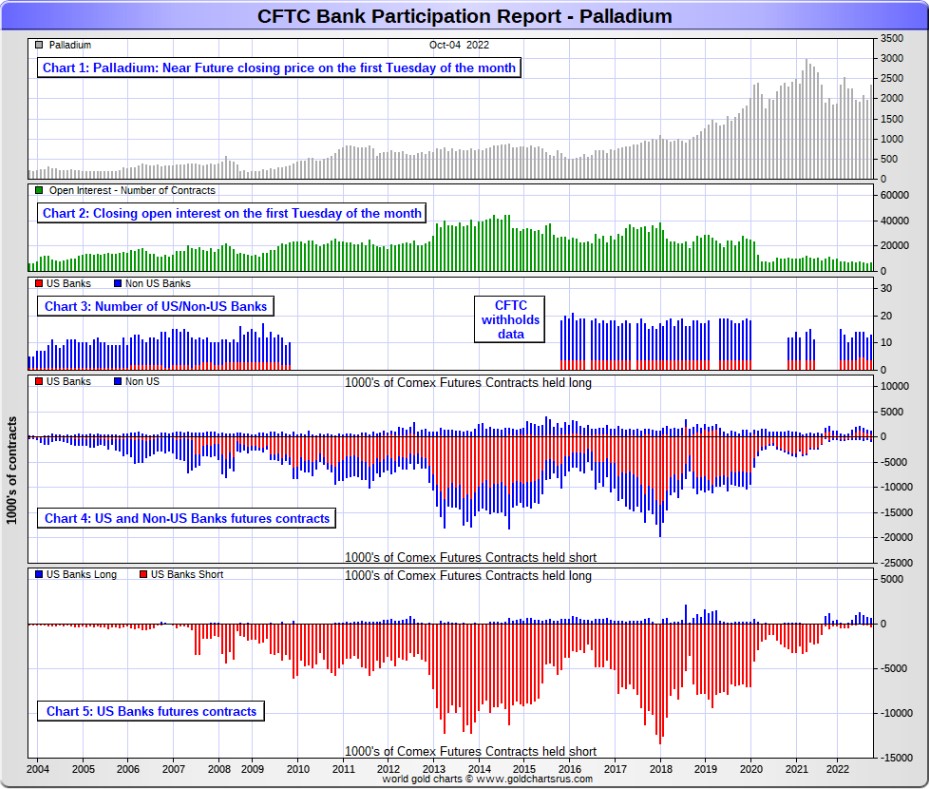
Here’s Nick’s BPR chart for gold going back to 2000. Charts #4 and #5 are the key ones here. Note the blow-out in the short positions of the non-U.S. banks [the blue bars in chart #4] when Scotiabank’s COMEX short position was outed by the CFTC in October of 2012. Click to enlarge.
In silver, 5 U.S. banks are net short 24,531 COMEX contracts in October's BPR. In September's BPR, the net short position of 4 U.S. banks was 16,554 contracts, which is up a very hefty 7,977 COMEX contracts from the prior month.
The biggest short holders in silver of the five U.S. banks in total, would be Citigroup, HSBC USA, Bank of America, Morgan Stanley...and maybe Goldman Sachs...but not JPMorgan according to Ted. And, like in gold, I have my suspicions about the Exchange Stabilization Fund's role in all this...although, also like in gold, not directly.
Also in silver, 18 non-U.S. banks are net short 16,464 COMEX contracts in the October BPR...which is up 4,928 contracts from the 11,536 contracts that 19 non-U.S. banks were net short in the September BPR...the first increase in the last seven months, but still a exceedingly low number.
I would suspect that HSBC and Barclays hold a goodly chunk of the short position of these non-U.S. banks...plus some by Canada's Scotiabank/Scotia Capital still. I'm not sure about Deutsche Bank... but now suspect Australia's Macquarie Futures. I'm also of the opinion that a number of the remaining non-U.S. banks may actually be net long the COMEX futures market in silver. But even if they aren’t, the remaining short positions divided up between the other 15 or so non-U.S. banks are immaterial — and have always been so.
As of October's Bank Participation Report, 23 banks [both U.S. and foreign] are net short 31.7 percent of the entire open interest in the COMEX futures market in silver— up huge from the 20.3 percent that these same 23 banks were net short in the September BPR. And much, much more than the lion’s share of that is held by Citigroup, HSBC, Bank of America, Barclays, Scotiabank -- and possibly one other non-U.S. bank...all of which are card-carrying members of the Big 8 shorts.
I'll point out here that Goldman Sachs, up until late last year, had no derivatives in the COMEX futures market in any of the four precious metals. But they did show up in the last three OCC Reports. Ted thinks they're long silver in the OTC market. I shan't bother talking about the 1 billion troy ounce short position the Bank of America is short in the OTC market...thanks to JPMorgan & Friends, as I've already covered that ground.
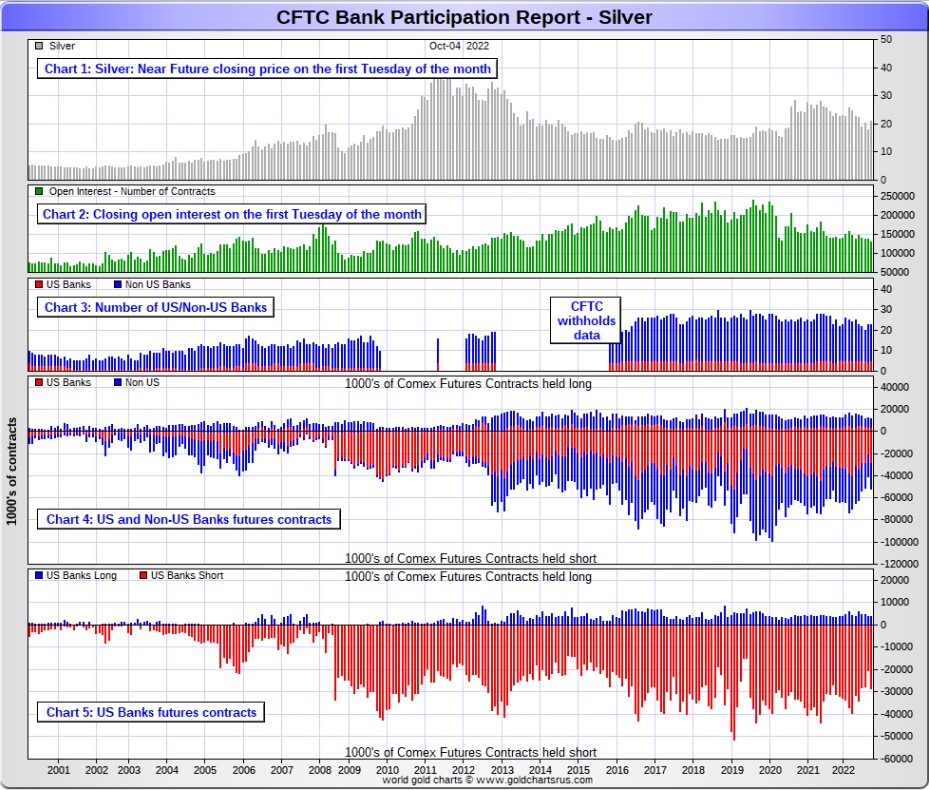
Here’s the BPR chart for silver. Note in Chart #4 the blow-out in the non-U.S. bank short position [blue bars] in October of 2012 when Scotiabank was brought in from the cold. Also note August 2008 when JPMorgan took over the silver short position of Bear Stearns—the red bars. It’s very noticeable in Chart #4—and really stands out like the proverbial sore thumb it is in chart #5. But, according to Ted, as of March 2020...they're out of their short positions, not only in silver, but the other three precious metals as well. Click to enlarge.
In platinum, 5 U.S. banks are net short 12,995 COMEX contracts in the October Bank Participation Report, which is up 2,003 contracts from the 10,992 COMEX contracts that 4 U.S. banks were short in the September BPR. This is still the second smallest net short position that these U.S. banks have held since July 2020 -- and before that, since mid-2018.
At the 'low' back in July of 2018, these U.S. banks were actually net long the platinum market by 2,573 contracts. So they have a very long way to go to get back to just market neutral in platinum...if they ever intend to, that is.
Also in platinum, 16 non-U.S. banks are net short a piddling 146 COMEX contracts in the October BPR, which is down 1,261 contracts from the 1,115 contracts that 14 non-U.S. banks were net long in the September BPR. This is the first time these non-U.S. banks have been net short since April...but it's a tiny and negligible amount.
So from a U.S./non-U.S. bullion bank perspective, this is a hugely bifurcated market...with the U.S. banks mega net short -- and the non-U.S. banks basically market net market neutral. These 5 U.S. banks hold a gross short position in platinum of 13,381 COMEX contracts vs. 426 contracts held long. This net short position just screams 'price management' at the top of its voice.
[Note: Back at the July 2018 low, the above-mentioned non-U.S. banks were net short 1,192 COMEX contracts in platinum.]
And as of October's Bank Participation Report, 21 banks [both U.S. and foreign] are net short 23.5 percent of platinum's total open interest in the COMEX futures market, which is almost double the 12.6 percent that 18 banks were net short in September's BPR.
But it's the U.S. banks in this bifurcated market that are on the short hook big time -- and the real price managers. They have little chance of delivering into their short positions, although a very large number of platinum contracts have already been delivered during the last couple of years. But that fact, like in both silver and gold, has made no difference whatsoever to their paper short positions. The situation for them [the U.S. banks] in this precious metal is as almost as equally dire in the COMEX futures market as it is with the other two precious metals...silver and gold...particularly the former.
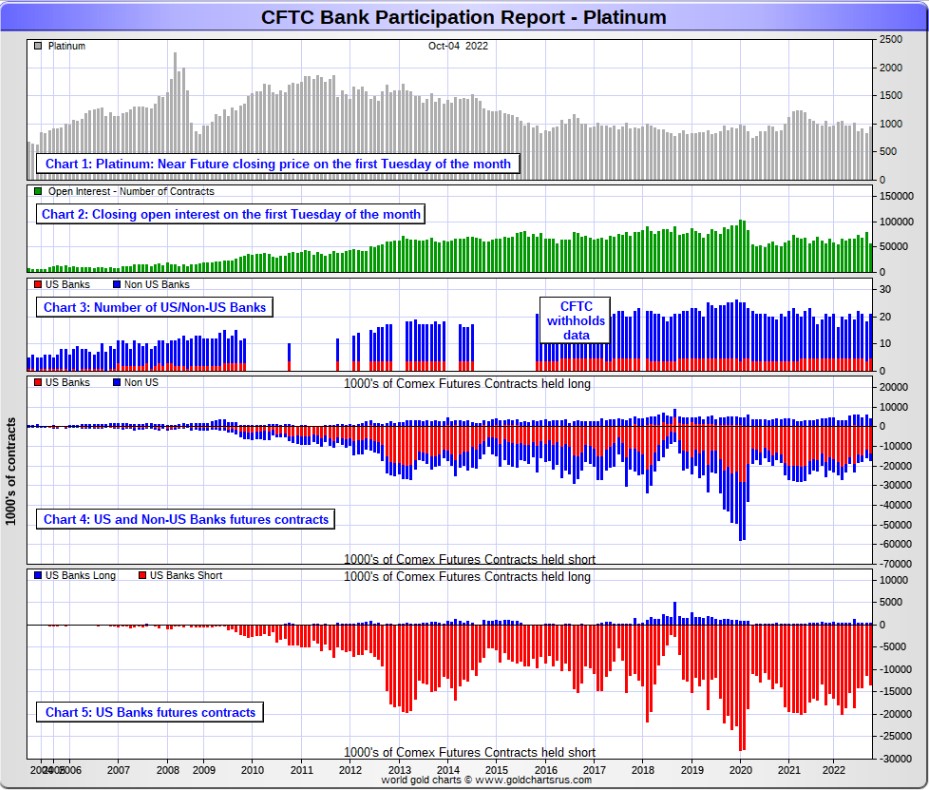
Here's the Bank Participation Report chart for platinum. Click to enlarge.
In palladium, 4 U.S. banks are net long 317 COMEX contracts, down 260 contracts from the 577 COMEX contracts that these same 4 U.S. banks were net long in September's BPR.
Also in palladium, 9 non-U.S. banks are net short 8 COMEX contracts in the October BPR, down 176 contracts from the 168 contracts that 8 non-U.S. banks were net long in September.
Except in this month's and February's Bank Participation Report, these non-U.S. banks have been net long palladium for more than two years now -- and the U.S. banks since December of last year.
But -- and as I've been commenting on for almost forever, the COMEX futures market in palladium is a market in name only, because it's so illiquid and thinly-traded. Its total open interest in yesterday's COT Report was only 7,080 contracts...compared to 55,682 contracts of total open interest in platinum... 129,524 contracts in silver -- and 437,065 COMEX contracts in gold.
The only reason that there's a futures market at all in palladium, is so that the Big 8 commercial traders can control its price. That's all there is, there ain't no more.
As of this Bank Participation Report, 13 banks [both U.S. and foreign] are net long 4.4 percent of the entire COMEX open interest in palladium... compared to the 12.2 percent of total open interest that 12 banks were net long in September's BPR.
And because of the small numbers of contracts involved, along with a tiny open interest, these numbers are pretty much meaningless.
But, having said that, for the last almost three years in a row now, the world's banks have not been involved in the palladium market in a material way. And with them now net long by a microscopic amount, it's all hedge funds and commodity trading houses that are left on the short side.
Here’s the palladium BPR chart. Although the world's banks are now net long at the moment, it remains to be seen if they return as big short sellers again at some point like they've done in the past. Click to enlarge.
Excluding palladium for obvious reasons -- and platinum in the non U.S. bank category...only a small handful of the world's banks, most likely four or so in total -- and mostly U.S.-based, except for HSBC, Barclays and maybe Standard Chartered...continue to have meaningful short positions in the precious metals. It's a near certainty that they run this price management scheme from within their own in-house/proprietary trading desks...although it's a given that some of their their clients are short these metals as well.
The futures positions in silver and gold that JPMorgan holds are immaterial -- and have been since March of 2020...according to Ted Butler. And what net positions they might hold, would certainly be on the long side of the market. It's the new 7+1 shorts et al. that are on the hook in everything precious metals-related.
And as has been the case for years now, the short positions held by the Big 4/8 traders/banks, is the only thing that matters...especially the short positions of the Big 4 -- and how this is ultimately resolved [as Ted said earlier] will be the sole determinant of precious metal prices going forward.
The Big 8 shorts, along with Ted's raptors...the small commercial traders other than the Big 8 commercial shorts...continue to have an iron grip on their respective prices -- and that fact was in your face in spades in yesterday's COT Report.
That 'iron grip' will persist until they either voluntarily give it up...or are told to step aside, as it now appears that there's no chance that they will ever get overrun. If that possibility had ever existed in reality, it would have happened already. However, considering the current state of affairs in the world today -- and the physical shortage in silver -- and possibly in gold as well, I suppose one shouldn't rule it out entirely.
I have a fairly decent number of stories, articles and videos for you today...including several that had to wait for today's column because of length and/or content reasons. I hope you can find the time to read the ones that interest you.

CRITICAL READS
Unemployment rate falls to 3.5% in September, payrolls rise by 263,000 as job market stays strong
Job growth fell just short of expectations in September and the unemployment rate declined despite efforts by the Federal Reserve to slow the economy, the Labor Department reported Friday.
Nonfarm payrolls increased 263,000 for the month, compared with the Dow Jones estimate of 275,000.
The unemployment rate was 3.5% versus the forecast of 3.7% as the labor force participation rate edged lower to 62.3% and the size of the labor force decreased by 57,000. A more encompassing measure that includes discouraged workers and those holding part-time jobs for economic reasons saw an even sharper decline, to 6.7% from 7%.
September’s payroll figure marked a deceleration from the 315,000 gain in August and tied for the lowest monthly increase since April 2021.
“Depending on your view of optimism vs. pessimism, on the economy, there’s a little bit of something for everyone in this report,” said Liz Ann Sonders, chief investment strategist at Charles Schwab. “Obviously, the market is not happy, but the market is not happy in general these days.”
“This puts the nail in the coffin for another 75 [basis point rate increase] in November,” said Jeffrey Roach, chief economist at LPL Financial.
Well, dear reader, I'll leave it up to you to decide whether you believe these numbers or not...keeping in mind that the mid-term elections in the U.S. are but a month away now. This news item appeared on the cnbc.com Internet site at 8:30 a.m. EDT on Friday morning -- and was updated a bit over two hours later. I thank Swedish reader Patrik Ekdahl for today's first story -- and another link to it is here. The Zero Hedge spin on this is headlined "September Unemployment Rate Tumbles as Payrolls Print Above Expectations, Lowest Since April 2021" -- and I thank Brad Robertson for sharing it with us. The link to it is here.
While it is traditionally viewed as a B-grade economic indicator, the August consumer credit report from the Federal Reserve was another shocker especially after last month’s unexpected slow down in credit card debt, which we attributed to the surge in credit card rates and wondered if this implicit deleveraging would continue as the US economy slid into recession, or if U.S. consumers are so desperate for liquidity they will max out their cards - without expecting to repay them - if it meant being able to pay for one more month of goods and services at record prices. We just got the answer when moments ago the Fed published the latest consumer credit data and it was a doozy.
Total consumer credit rose $32.2 billion, well above last month's $26 billion and also above the $25 billion consensus estimate.
And while non-revolving credit (student and car loans) rose by a relatively pedestrian$15.1 billion...
... the stunner again was revolving, or credit card debt, which soared from last month's sharp drop, rising by the second highest on record at $17.2 billion (from $10.4 billion last month) and only lower than the highest print on record, March’s downward revised $25.9 billion…
This sent total revolving consumer credit to new all time highs at just over $1.15 trillion, erasing all the post-covid credit card deleveraging just in time for those credit card APRs to hit record highs!
This multi-chart Zero Hedge news story was posted on their Internet site at 3:44 p.m. EDT -- and comes to us courtesy of Brad Robertson. Another link to it is here.
David Stockman on Why We’ll Continue to Have High & Sticky Inflation Ahead…
An examination of the CPI weighting scheme sheds further light on the high, sticky inflation readings which lie in the Fed’s inflation-fighting path ahead.
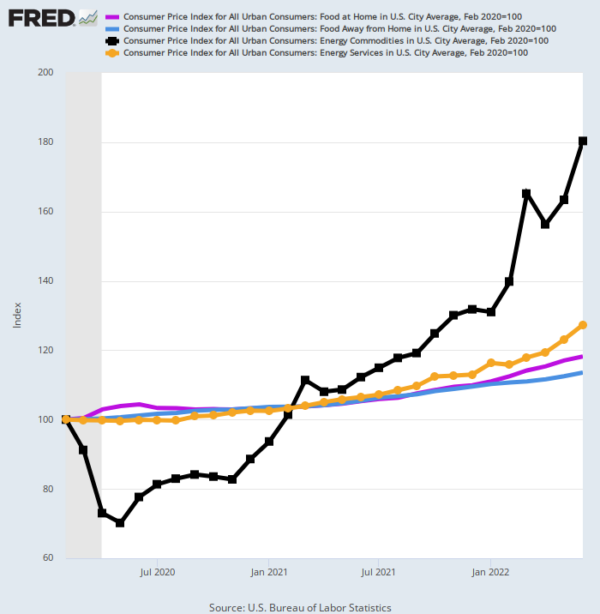
For instance, food and energy as a whole accounts for 22.1% of the CPI, but there is a clear difference between the pure commodity component of these items versus the portion in which services and domestic labor costs are mixed into the figures.
To wit, the food-at-home or grocery store portion of the food index above (purple line) is a largely commodity driven figure, and it accounts for 8.3% of the overall CPI. By contrast, the food-away-from-home index (blue line), which accounts for 5.1% of the CPI total, has a heavy services/labor component. That’s because it represents items purchased at restaurants and other labor-intensive food service establishments.
Since the pre-Covid peak in February 2020, there has been a considerable divergence between these two sub-components of the food index. The commodity-oriented portion is up at a 7.4% annual rate, while the restaurant portion is up by just 5.6%.
This commentary from David showed up on the internationalman.com Internet site on Friday -- and another link to it is here. Gregory Mannarino's almost always "ADULT" rated post market close rant for Friday is linked here -- and I thank Brad Robertson for sending it our way.
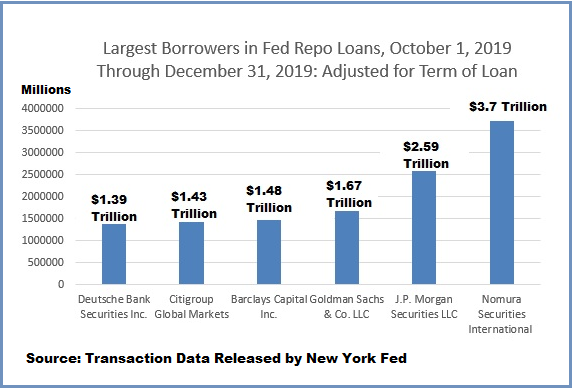
Nomura Holdings is tiny compared to the mega banks on Wall Street. According to its website, it had just $384 billion in assets as of March 31, 2021. On the same date, JPMorgan Chase had $3.2 trillion in assets. But for reasons that neither the Federal Reserve nor Congress have yet to explain, a unit of Nomura was allowed to borrow trillions of dollars in emergency repo loans from the Fed beginning on September 17, 2019 – months before there was any COVID crisis anywhere in the world.
The chart above shows that in the last three months of 2019, Nomura borrowed $3.7 trillion cumulatively under the Fed’s emergency repo loan program, topping the amount borrowed by JPMorgan Chase by $1.11 trillion.
The loan amounts come directly from the emergency repo loan data being released quarterly by the New York Fed, adjusted for the term of the loan. (Reverse repo amounts have to be deleted from the data released by the Fed.)
The Fed swung into emergency mode on September 17, 2019 when the rate on overnight repo loans suddenly spiked from around 2.25 percent to as high as 10 percent at one point, strongly suggesting the street was backing away from questionable borrowers. The Fed set up its own facility to make tens of billions of dollars in loans available to trading houses on Wall Street on a daily basis, and at very cheap interest rates that did not reflect the credit risk of the individual trading houses. (Repos, short for Repurchase Agreements, are a short-term form of borrowing where corporations, banks, brokerage firms and hedge funds secure loans, typically for one day, by providing safe forms of collateral such as Treasury notes.)
The distress being experienced by Nomura likely came from its large derivatives exposure. The fact that JPMorgan Chase and Goldman Sachs were, from the get-go, also borrowing heavily from the Fed, suggest that the three firms were counterparties to each other’s derivatives.
This very interesting commentary from Pam and Russ Martens put in an appearance on the wallstreetonparade.com Internet site on Friday morning EDT -- and I thank Brad Robertson for sharing it with us. Another link to it is here.
World Careening Toward "Dangerous New Normal", IMF Chief Warns
The world is facing the risk of a recession, with the global economy experiencing a “fundamental shift,” warned Kristalina Georgieva, managing director of the International Monetary Fund (IMF).
In just three years, the world has lived through “shock, after shock, after shock,” Georgieva said during a speech at Georgetown University in Washington on Oct. 6. The world had to deal with the COVID-19 pandemic, the Russian invasion of Ukraine, and “climate disasters on all continents,” she claimed, saying such shocks have caused “immeasurable harm” to people’s lives.
The combined effect has been a surge in the prices of goods, especially energy and foods, creating a cost-of-living crisis, she said.
The world is seeing a “fundamental shift” in the global economy, moving away from a world of relative predictability— which had a rules-based framework for international economic cooperation, low inflation, and low interest rates—to a world of more fragility, greater uncertainty, geopolitical confrontations, higher economic volatility, and more frequent devastating natural disasters, she said.
To prevent this period of heightened fragility from becoming a “dangerous new normal,” the world must focus on stabilizing the global economy, revitalizing cooperation, and transforming the economy to build resilience against any future shocks, Georgieva said.
Uncertainty remains “extremely high” in the context of the pandemic and Russia’s war in Ukraine. Georgieva raised the possibility of “even more” economic shocks, pointing out that financial stability risks are rising.
Another person with a keen grasp of the obvious, dear reader. This article showed up on the Zero Hedge website at 8:20 p.m. EDT on Friday evening -- and another link to it is here.
'By taking back control of the money we can begin regaining control of our world' -- Neil Oliver
'Now is the time to take back control of money – Its creation, its value and its flow. By so doing, we can begin the task of regaining control of our world.'
This very worthwhile 9:20 minute video commentary from Neil, put in an appearance on the youtube.com Internet site last Saturday -- and I though it best to wait for today's column to post it. Another link to is here.
The consequences of imploding credit -- Alasdair Macleod
There is a growing realisation that the world faces a combination of persistent inflation of prices and a recession at the same time. The factors driving both are visibly intensifying. Those of us versed in the cycle of bank credit are aware that it is the contraction of bank balance sheets which is driving the recession, while it is continuing currency debasement driving inflation.
Neo-Keynesians in the establishment think the current position is contradictory, that current rates of price inflation will decline back to their 2% target in a recession, and interest rates can then be reduced to stimulate economic activity.
The key to understanding why prices can continue to rise in a recession requires a fuller understanding of the role of credit in an economy and what it represents. Its role is far greater than commonly thought, with considerably more than several quadrillions of dollar equivalents outstanding. All economic activity and wealth are credit. This article sketches out the various types of credit, and how credit equates to our collective wealth.
It also requires us to differentiate between a currency which is anchored to gold specie and one without a specie anchor. The former imposes a discipline on the state of non-intervention, while the latter encourages intervention. It is that intervention which leads to fiat currencies and all credit based upon it finally collapsing.
This short and somewhat thick novel from Alasdair was posted on the goldmoney.com Internet site on Wednesday -- and for obvious length and content reasons, had to wait for today's column. I found it embedded in a GATA dispatch -- and another link to it is here.
McAlvany Wealth Management Client Conference -- Doug Noland
Meanwhile, our entire financial structure has been underpinned for years by the perception that the Fed will do “whatever it takes” to support the markets and grow the economy. The view holds that the Fed won’t allow a crisis. It will cut rates and deploy as much QE as necessary to thwart financial crisis.
But there’s a big problem: The Bubble has inflated to the point that it will take Trillions of additional QE to accommodate a serious de-risking/deleveraging. Recall how it required several Fed announcements of additional massive QE to thwart market collapse in March 2020. Five Trillion of QE later, the Bubble had grown only bigger and more unwieldy.
And the inflation problem is much more severe and deeply rooted. This means the Fed liquidity backstop has turned uncertain. I expect more QE, but the Fed will respond more slowly and cautiously. And I do not expect this to suffice in the markets.
There are many myths and misperceptions at stake. And I fear the “holy crap” moment – markets hit with the harsh reality that the Fed and global central bankers don’t have everything under control.
In particular, I fear concurrent crises of confidence in policy making and market structure. De-risking/deleveraging will feed illiquidity and market dislocation. Global derivatives markets will be severely tested.
I’ll also briefly speak to today’s alarming geopolitical backdrop. The Ukraine war, deteriorating relations with China, Taiwan, North Korea, Iran and such. Why are so many things coming to a head right now?
Keep in mind that boom periods engender perceptions of an expanding global pie. Cooperation, integration and alliances are viewed as mutually beneficial. But late in the cycle, perceptions begin to shift. Many see the pie stagnant or shrinking. Zero sum game thinking dominates. Insecurity, animosity, disintegration, fraught alliances and conflict take hold.
I see no end in sight for the extremely challenging market environment. We’ll have to continue to navigate through de-risking/deleveraging dynamics and chaotic market instability. The extraordinary environment demands intense daily focus, discipline, and a risk-management focus. It is time to be on alert and as prepared as possible.
This very long presentation by Doug at the above-mentioned conference is definitely worth reading -- and it was posted on his Internet site in the very wee hours of Saturday morning Pacific Daylight Time. Another link to it is here.
Vladimir Putin's Battle Cry Against the Deep State
The recent ceremony of accession of four Ukrainian regions to Russia brought a speech from President Putin that outlined the reasons behind Russia’s current struggles, the character and identify of its foes and, more importantly, laid the groundwork for Russia’s next level of confrontation with the West beyond the ongoing military conflict in Ukraine. In his speech, Putin clearly defined the present fight as a worldwide battle in which Russia plays a leading role against the Deep State that ultimately runs the West and which uses all available tools - including military, economic, cultural, and social – in its attempt to preserve unipolar world domination.
Putin’s words were directed to three distinctive audiences: the collective West, the Global South and Russia. He went back to Middle Ages history to remind the origins and impact of Western resource exploitation and colonialism in the Americas, Asia and Africa through imperialistic wars, racism, and slavery. He touched upon the military exploits of the 20th century led primarily by the U.S. and its allies and its impact in Germany and Japan at the end of the Second World War, Korea in the 1950s, Vietnam in the 1960-70s and its latest failed adventures in Iraq, Libya, Syria, and Afghanistan. He also highlighted the dire days of Russia during the 1990s and the Western powers’ attempts to turn it into a dismembered and passive cheap natural resources outlet. Putin’s message to Russians had nationalistic and religious tones, touching on the defence of traditional family values as a call to arms against the threat caused by dwindling population growth. He also named U.S. monetary printing as one of the key tools used by the Western establishment to achieve its self-preservation and supremacy goals, reminding that paper doesn’t feed nor warms human beings.
It would be tempting to see this speech narrowly as just another manifestation of Russia’s position in the big geopolitical battles, but what Putin has done is setting international rivalry in deep historical and cultural terms which have an undoubted appeal across the globe. Critics will see Putin’s benign characterization of Russia as a cynical ploy that hides the country’s role, through its commanding post in the Soviet Union, in the subjugation of Eastern European countries after World War II, but nevertheless the Global South will see things differently.
This very worthwhile commentary from The Ron Paul Institute for Peace & Prosperity website, was picked up by Zero Hedge on Thursday -- and it had to wait for today's column for content reasons. Another link to it is here. The full speech by Vladimir Putin on the accession of former Ukrainian territories was posted on the rt.com Internet site back on September 30th -- and I thank Roy Stephens for sharing it with. It's linked here.
Large Explosion Destroys Part of Key Bridge Linking Russia to Crimea; Zelensky: This is "The Beginning"
Russian authorities said that an explosion involving a truck on Saturday caused a fire and destroyed a section of a bridge linking Russia and Crimea.
The bridge is regarded as a key supply route for Russian troops in southern Ukraine.
The Crimean Bridge - also called Kerch Strait Bridge or Kerch Bridge - is a structure 19 kilometers (12 miles) in length that passes across the Kerch Strait and links southern Russia to the Crimean Peninsula. The Kerch Strait links the Black Sea and the Sea of Azov.
The Epoch Times' Mimi Nguyen reports that a truck exploded on the bridge around 6 a.m. local time. Russia’s National Anti-Terrorism Committee announced that the explosion caused a fire on the parallel rail section, where seven railway cars carrying fuel caught fire. The blast also caused a “partial collapse of two sections of the bridge.”
This proxy war against Russia by NATO and the U.S. just ramped up another notch. One has to wonder how soon this will turn into all-out war between Russia and the Ukraine? This Zero Hedge news story put in an appearance on their Internet site at 8:01 a.m. on Saturday morning EDT -- and another link to it is here.
India's Gold jewellery sales up 30% this Dussehra
Gold jewellery sales have shot up by 30% this Dussehra compared to last year, setting the tone for better sales in the upcoming Diwali and Dhanteras period. Jewellers attribute this surge in sales to drop in gold prices coupled with an upbeat mood among consumers as the economy has opened and the fear of covid waning across the country.
Prices of 22 karat gold, used for making jewellery, has fallen below Rs 50,000 per 10 gm and was hovering around Rs 49,000 per 10 gm during the Dussehra period.
“Our stores have witnessed more than 30% sales this Dussehra. There has been a lot of pent-up demand in the market and consumers have spent on the precious metal. The demand for lightweight contemporary jewellery was more. We have also seen people buying coins too as an instrument for investment,” said Joy Alukkas, CMD of Thrissur headquartered jewellery retail chain Joyalukkas Jewellery.
The above three paragraphs are all there is to this tiny gold-related news item. It appeared on the economictimesofindia.com Internet site at 12:33 a.m. Indian Standard Time on their Friday morning -- and I found it on Sharps Pixley. Another link to it is here.

The Photos and the Funnies
On Sunday, October 18, I headed south on B.C. Highway 5...known as the Coquihalla in these parts. It was a beautiful fall day -- and the colours...mostly shades of yellow...were at their peak. The sun, low in the southwestern sky, didn't hurt either. Photos one and two were taken from the same spot...the first looking west and over the town of Merritt...the second looking due north up the Nicola valley. Photos three and four were also taken from the same spot a little further down the road -- and a little higher in elevation...the first looking west and overlooking the Coldwater River valley -- and the second looking northeast down the Coquihalla. Click to enlarge.


The WRAP
"Understand this. Things are now in motion that cannot be undone." -- Gandalf the White
Today's pop 'blast from the past' is one that I've featured before, but it's been a long while, so it's time for a revist. The song, by Scottish singer/songwriter Gerry Rafferty, needs no introduction -- and the link is here. Of course there's a bass cover to this -- and it's far more intricate than I ever imagined it would be. It's linked here.
Today's classical 'blast from the past' features the pipe organ -- the "king of instruments"...so sayeth Wolfgang Amadeus Mozart -- and here's the most famous and well-know piece composed for it. It's Johann Sebastian Bach's Toccata & Fugue in D-minor [BWV 565] as performed by wunderkid Gert van Hoef on the 1802 Rudolf Knol organ at the Stephanuskerk in Hasselt in the Netherlands. He has two people pulling stops and turning pages for him. It's awesome -- and the link is here.
The Big 4/8 commercial shorts didn't waste any time when the jobs number came out at 8:30 a.m. in Washington on Friday morning -- and all four precious metals got the coup de grâce at that point...helped along by low volume.
Gold was closed even further below its 50-day moving average -- and as I mentioned in this space in my Friday column, it appears that the big commercial shorts have engineered a 'failure' at that moving average.
Whether or not this turns into a longer-term strategy, remains to be seen.
Silver touched it 100-day moving average intraday, but closed about two bits above it. Whether or not the Big 4/8 commercial shorts have more downside price action planned in this precious metal also remains to be seen.
Although platinum was closed down on the day, it still remains in no-man's land...half way between its 50 and 200-day moving averages. Palladium got whacked pretty good -- and both its 50 and 200-day moving averages...only 13 bucks apart...beckon.
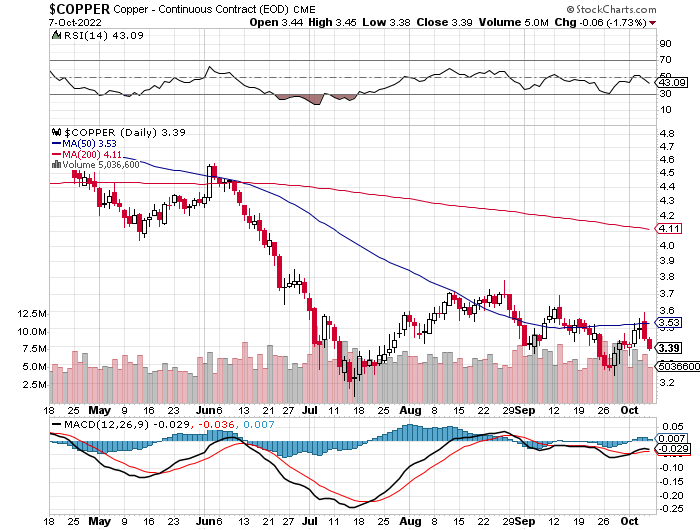
Copper was closed lower by another 6 cents at $3.39/pound -- and is now firmly back below any moving average that matters.
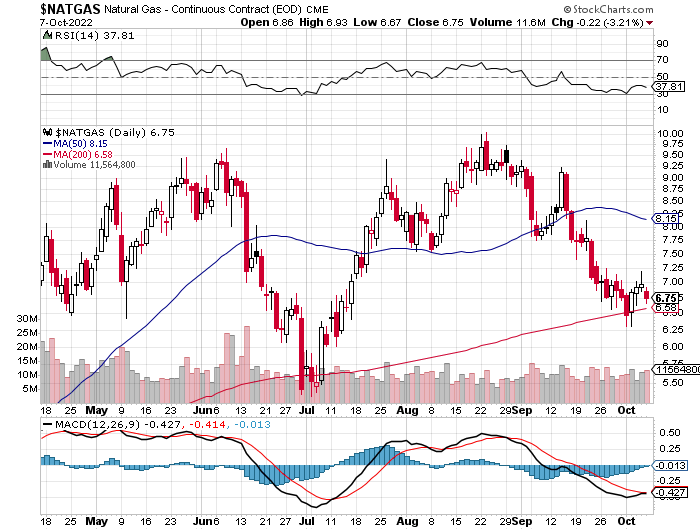
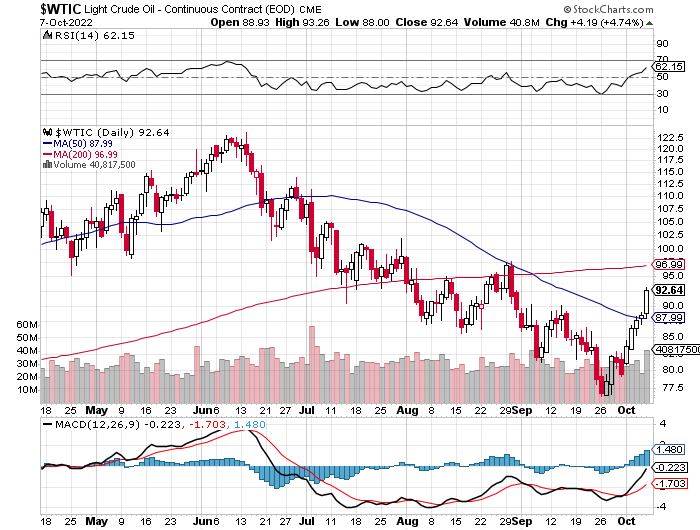
Natural gas [chart included] closed lower by 22 cents...finishing the Friday trading session at $6.75/1,000 cubic feet. WTIC finally got some respect, as it closed higher by $4.19/4.74% at $92.64/barrel -- and is now well above its 50-day moving average.
Here are the 6-month charts for the Big 6+1 commodities, thanks to the good folks over at the stockcharts.com Internet site. I'll point out here that the price declines that occurred in both silver and gold after the 1:30 p.m. COMEX close, do not appear on their respective candles. Click to enlarge.
The headline increase in the commercial net short position in silver in yesterday's COT Report came in at the bottom end of what Ted was expecting, although the Managed Money traders covered far more short positions than what the commercial traders sold.
But the real surprise was the fact that Ted's raptors, the small commercial traders other than the Big 8, sat on their hands and sold hardly any of their longs. Normally they are first out of the gate selling longs to the Managed Money traders for big profits -- and this is what both Ted and I were expecting ...but not this time. And why not, is the big question that now begs an answer.
If you're looking for a 'man bites dog' scenario, this was it.
The same can be said for gold, as the increase in the commercial net short position in that precious metal was far, far beyond anything that I was expecting...Ted too. And, like in silver, his raptors mostly sat on their hands. This forced the Big 4/8 shorts to step in order to prevent gold and silver prices from exploding to the moon.
So we're back to the "same old, same old" scenario for the moment...as the large commercial shorts stepped in big time.
However, since the Tuesday cut-off, it is a sure bet that the Managed Money traders have been back to their selling ways -- and the large commercial shorts have been buying all long contracts offered.
So they've been able to whittle away some of the damage that they did in this past week's COT Report...but have a long way to go to get back to their lows of a few weeks ago...if that's their intention.
But, regardless of this negative report, the set-up for major rallies in both silver and gold are still there from a COMEX futures market perspective. However, the fact that the big commercial shorts appeared with a vengeance in lieu of raptor selling, was completely unexpected.
So where we go from here remains to be seen -- and the fact that Ted's raptors were basically no-shows during this reporting week, just adds another Matryoshka doll to the precious metals rat's nest.
I'll be more than interested in what he has to say about all this in weekly review for his paying subscribers this afternoon.
Another week come and gone -- and the world's economic, financial and monetary systems continue to hang by that proverbial Damocles thread. Only massive interventions by the four major central banks of the world...singly, or as group...have prevented the world's bond and stock markets from melting down into a smouldering ruin.
It's now only a matter of when, not if, these events occur. As you are more than no doubt aware, we're long past the point of no return in either of these markets.
The system was designed to fail at the outset with the founding of the Federal Reserve back in 1913 -- and the clock was set ticking for the final countdown when Nixon cut into the Sunday night TV program "Bonanza" on August 15, 1971 to give the world the news about the end of the U.S. gold exchange standard.
The deep state/New World Order crowd has penetrated deeply into the power structures of governments and large corporations in the West. They're running the show now -- and aren't even trying to hide it anymore.
What they have planned for us is already well known. The nation state will disappear -- and we'll own nothing and be happy. A fascist dictatorship by the world's elite...with the middle class destroyed -- and then serfdom for all.
But in order to do that must destroy what currently exists -- and then present an already prepared in advance solution to the masses, who will be screaming to be saved. It will be sort of like the Patriot Act introduced in its complete form mere days after 9/11...except their solution will be global in scale...at least in the West. You can rest assured that at this state of the game, their 'solution' is pretty much cast in stone already.
Russia, China and India et al. have put the Western deep state on notice that they're not interested in playing this game -- and are already putting in plans to work around it and insulate themselves from it.
When the appointed time arrives, then -- and only then, will precious metal prices in particular -- and all commodity prices in general, be set free, regardless of what the set-up in the COMEX futures might be at that time. That act alone will guarantee a new world order of sorts, as all things paper are devalued against hard assets of one stripe or another.
Whatever plans these powers-that-be have cooked up for us, has a time table of sorts attached -- and as I've said before, none of us are privy to it. But the foreshocks of the upcoming main event have been rippling through the financial and monetary markets at an ever-increasing rate over the last three years or so -- and are coming almost by the week now.
It's still my opinion that whatever they have in store, will be upon us sometime before this year is out.
As always, I'm certainly expecting that the precious metals will be what saves us from the sad fate that awaits billions of our fellow travelers here on Planet Earth.
And, as I've been saying in this spot for at least the last ten years or so, I'm still "all in" -- and will remain that way to whatever end.
See you here on Tuesday.
Ed
About the author
