
Of course, Biden’s State of the Union Speech will include all kinds of bragging about the economy, as every president’s SOTU speech does. So, we’ll ignore all of that and look at the direction the economy is actually headed, using recent metrics in a rapid-fire revelation that looks like this:
American spending dropped in December, and American spending dropped in November. We’ll soon see where January went:
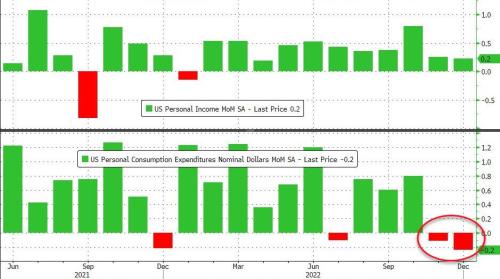
Two quarters of declining spending is even more than we saw just before the start of 2022, when GDP fell over the edge into recessionary numbers for two full quarters.
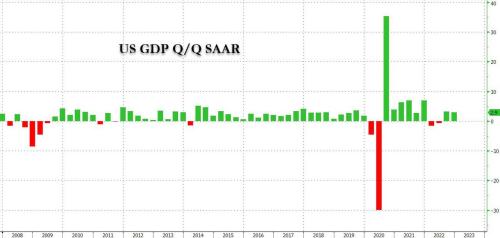
Speaking of GDP, you all remember how the final quarter of last year came in reasonably strong. Just one problem: As Zero Hedge reported, the largest part of the positive GDP print was due to inventory, and what happened in inventory last quarter is likely to reverse this quarter (or, in the very least, not going to happen again). Therefore, last quarter’s inventory build likely sets us up for negative GDP in the first quarter of this year (or, in the very least, flat) just like we had at the beginning of last year:
The BEA reported that in Q4, US GDP rose by a stronger than expected 2.9% (or 2.880% to be precise), a modest drop from the 3.2% in Q3 and well above consensus estimates of 2.6%….
While US GDP exceeded expectations by growing 2.9%, underlying private domestic demand was quite weak, coming in below consensus at 2.1% which however is likely enough to delay recession expectations to the back half of the year, when employment will be the last economic metric to break. The combined contributions of household consumption, capex, and residential investment was just 0.22% — the lowest since the second quarter of 2020.
Finally, talking of pivots: the inventory liquidation ended in Q3 and in Q4 inventories rose again. This means that in Q1 inventories will now slide again, pushing GDP negative. Here is CIBC economist Katherine Judge who sees the potential for a decline in GDP in the current quarter, partly thanks to the build-up in inventories:
“With inventories now elevated across many industries, and consumers running through excess savings, we see the potential for a contraction in the economy in the first quarter as the impact of past rate hikes materializes more fully, and consistent with a tapering off of momentum in recent monthly indicators.”
We shall see. Whether or not the National Bureau of Economic Research (NBER) — the outfit that officially declares recessions — will allow that to be called a “recession” this year, should it tag-team with a second quarter of decline as it did last year, is another matter. What was a technical recession in 2022 and would in normal times always have been officially called a “recession” was inconvenient as a call during a major election year since Americans almost always vote out whoever is in charge when a recession hits; so the NBER badly misapplied broken job metrics (as I’ll explain again at the end of this article) to justify not calling last year’s half year of negative GDP change a “recession.” For my part, I see a notable dip in production (definition of a “recession”) for half a year in 2022:
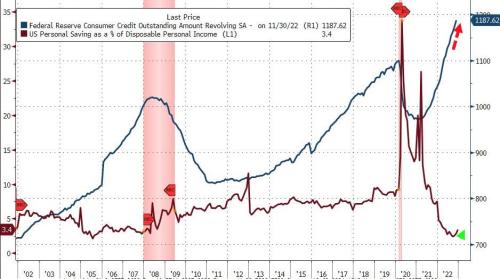
The savings rate is still down in the trenches as Americans no longer have much disposable income to sock away. Instead, they are rapidly ratcheting up their credit cards to try to maintain spending in face of the high costs of continuing inflation (which was how I said two years ago inflation would rise to rip the economy to shreds):
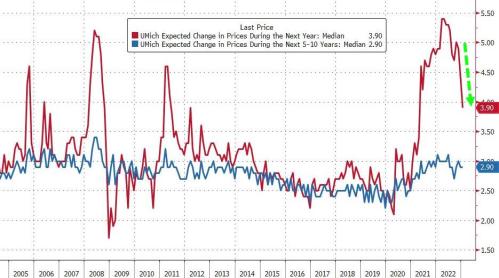
Consumer sentiment is, however, improving:
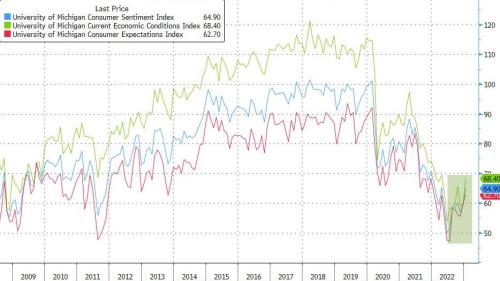
That is due likely to consumers believing the Fed is starting to make progress on inflation to where they are anticipating substantially less inflation in the year ahead:
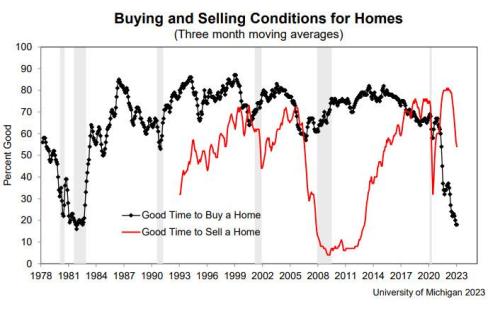
Nobody, however — buyers or sellers — is happy with the housing market:
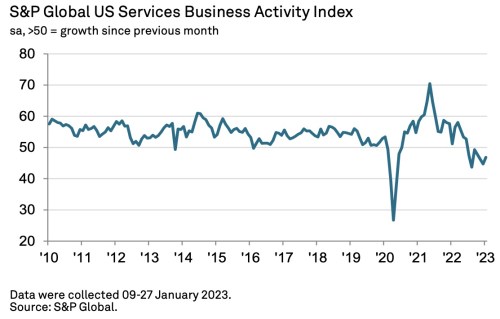
In terms of actual economic activity, services (the largest component of GDP) were a mixed bag in January but generally contracted:
January data signalled a solid contraction in business activity across the US service sector at the start of 2023, according to the latest PMITM data. Although easing, the fall in output stemmed from further weak domestic and external demand conditions, as new business and new export orders declined. Firms continued to expand their workforce numbers despite another fall in backlogs of work, but the pace of employment growth slowed further amid reports of cost-cutting efforts….
At the same time, cost inflation picked up for the first time in eight months. A sharper rise in input prices was not reflected in a quicker increase in output charges, however, as selling prices rose at the slowest pace since October 2020….
Weak client demand hampered business activity, as output fell at a solid pace. Firms noted that inflation and high interest rates weighed on customer spending, with further reports of hesitancy in placing new orders.…
New business fell for the sixth time in the last eight months, albeit at only a marginal pace. The decline in new orders was linked to lower purchasing power among customers amid strong inflationary pressures.
Alongside subdued domestic sales, new export orders also decreased in January. The rate of contraction in new business from abroad quickened and was among the sharpest since May 2020. Service sector firms stated that global economic uncertainty and high inflation in key export markets weighed on export sales.
In the graph below, any level below “50” is in contraction (recessionary in nature):
Belaboring labor blindness
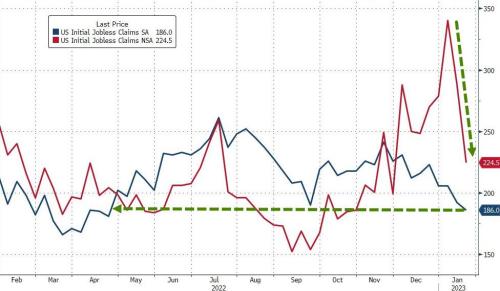
Meanwhile, the jobless rate/unemployment is still way, way, down, even though companies have started strings of layoffs around the nation: (Many of which are global layoffs, so don’t amount to a lot in the US … so far.)
That, of course, is to be expected in an environment where “tightness” in the labor market has absolutely nothing to do with “a strong economy” this time around but everything to do with an incredibly WEAK labor market. Again, the job of a “labor market” is to supply the market with the labor it needs to carry out production and services. If it cannot adequately supply because demand for goods and services is so strong, that kind of tightness is obviously evidence of a strong economy; and that is how everyone is used to thinking about “labor tightness.” If, however, it cannot adequately supply because there is a serious dearth of workers, that is only evidence of a sick labor market … a weak labor market that cannot maintain adequate labor supply even in an economy of falling demand and falling production.
So, one would expect when the tightness is almost all on the labor supply side, the economy will have to do a lot of receding in order to reconcile with available labor before you start to see much increase in unemployment because those whose jobs are eliminated still find they are in hot demand elsewhere due to the shortage of competition in labor. Also, many more people than usual in the present economy have 2-3 jobs; so, if they lose 1-2 jobs, they are typically not eligible for unemployment and, therefore, are not counted as “unemployed.”
I keep going over this because almost no one seems able to wrap their heads around the significance of the difference between the present labor shortage and the times of labor tightness they are accustomed to understanding; so, the NBER and the Fed and almost all economists look at it through their old-fashioned, now-pandemicly-mangled glasses to see it as they always have as a sign of a robust economy with strong demand, rather than as simply the crippled labor pool that it is, which is a labor pool UNABLE to produce up to snuff … so, production will stay in general decline.
You can see that quite easily below in this graph of the total labor force (not just the labor participation rate). You can see that the rise in the size of the total labor pool is basically constant with population growth, but the labor force broke significantly during the Great Recession, cataclysm as that was, and took several years for growth in the size of the labor force to get back on the trend (slope) that matches up with population growth, albeit at a lower level. Then the Covidcrisis with all its forced labor interference by government (lockdowns, vaccine mandates for workers) and chronic sickness and vaccine repercussions and early retirements hit, and labor has returned to growing, but very far below the former trend:
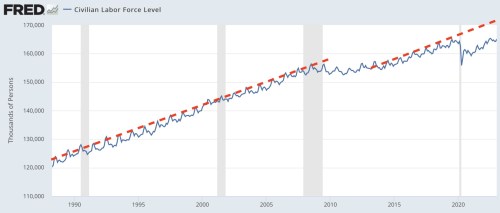
We are back to growing along the same slope (rate) as we had been, but stepped down to a much lower level. With the labor force that produces supplies and services now far below the level at which population continued to grow (as that hasn’t slowed) and efficiency stagnant, it is inevitable we are going to see supply shortages in labor, which will mean corresponding shortages in the goods and services that labor produces.
(Especially when most other nations are down, too, so we cannot make up the difference in imports, which do not impact GDP one way or the other anyway, as they are subtracted out because they were wrongly included in all the GDP inputs above that line in the first place and are not legitimately a part of “domestic” production. Their subtraction is nothing more than an accounting reconciliation for their wrong inclusion in all the inputs. In other words, for every billion subtracted in imports, there was a billion invisibly inputted in all the production lines — another fact that even some economists have a hard time wrapping their heads around. You’ll hear some economists say, “imports subtracted 100-billion from GDP this quarter.” No, they didn’t because first they added 100-billion invisibly, and then that amount merely got reconciled back out because it shouldn’t have been included in the first place. Rather than trying to parse out which items sold at a retailer were imported items and especially what portion of each individual item sold was made from imported parts, it’s much easier to just add up gross sales and then subtract out the contribution from imports as a lump sum based on port records for that quarter. See the Fed’s own “How Do Imports Affect GDP?“)
Powell may be perplexed, as the following article used for some of the charts above is titled, but I’m not: “Powell Perplexed: Initial Jobless Claims Plunge To 9-Month Lows.” The refusal of unemployment to change with the economy (or the unusual amount of lag) is exactly what I would expect to see under these unique post-Covidcrisis circumstances. (I’ve explained elsewhere why this chronic labor shrinkage (weakness) is NOT going to go away: “Powell’s Peril Lies in Lanquishing Labor Market.”)
This continues to be the Fed’s great blindspot and, apparently, everyone else’s, as I don’t see anyone anywhere really wrapping their head around what this kind of tightness means. It means guaranteed low production (declining GDP/recession) for a good time to come because the producers are not there! Moreover, if product and service demand doesn’t drop to reconcile with the significantly lower number of available producers of goods and services, eventually prices will go back up (unless we see a massive boost in the efficiency of workers, which so far is not happening).
To put it another way, we have to get demand for labor to match down to available labor supply before we start to see upward moves in unemployment. To get labor demand down that much, Powell is going to have to cause a lot of economic wreckage on the demand side.
If you want to keep up on the daily news that covers the longterm economic decline we are now in, you can become a Patron at the $10 level to support all the writing that happens on this site and receive access to every issue of The Daily Doom, which tries to cover all the news about our present global economic collapse, but condenses it to the most important or informative or best-written stories:
Liked it? Take a second to support David Haggith on Patreon!
 v
v
About the author


David Haggith is the publisher/editor-in-chief of The Daily Doom.
Economic, Social and Political News of Our Troubled Times -- a non-partisan daily collection of the most consequential stories about our complex times from multiple sources around the world plus daily editorials like the one you read here.
Liked it? Take a second to support David Haggith by subscribing on Substack!