The economist who predicted the financial crisis sees a “long and ugly” recession, including a sharp correction in the S&P 500, that could last all of 2023.
“Even in a plain vanilla recession, the S&P 500 can fall by 30%,” says Nouriel Roubini, quoted by Bloomberg in a September interview. In “a real hard landing,” which he expects, it could fall 40%.
Roubini, nicknamed “Dr. Doom” for correctly anticipating the housing crash of 2007-08, pointed to the large debt ratios of corporations and governments as particularly concerning.
This is due to the fact that as rates rise, debt servicing costs increase.
“Many zombie institutions, zombie households, corporates, banks, shadow banks and zombie countries are going to die,” he said. “So we’ll see who’s swimming naked.”
While some market observers believe the Fed will pivot to lowering interest rates, and restarting quantitative easing (QE), once the world is in recession, Roubini isn’t one of them.
He doesn’t expect fiscal stimulus remedies because governments are “running out of fiscal bullets,” and high inflation means that “if you do fiscal stimulus, you’re overheating the aggregate demand.” Roubini therefore sees stagflation like in the 1970s, and debt distress like in the global financial crisis.
“It’s not going to be a short and shallow recession, it’s going to be severe, long and ugly,” he said via Bloomberg, adding that his advice to investors is “to be light on equities and have more cash.”
On Monday US stock markets plunged on fears that the Federal Reserve will continue tightening until it causes a recession. All three indices slumped following a better-than-expected ISM Services print for November (other PMIs though were down — see below), fueling concerns the Fed will continue hiking interest rates.
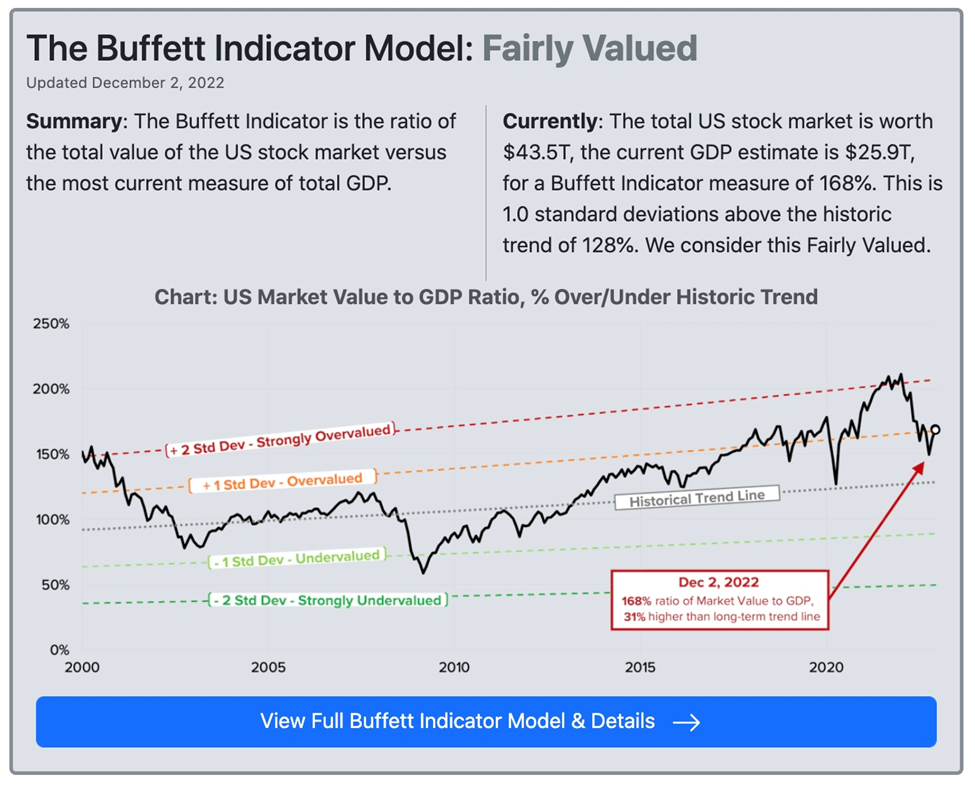
When markets swoon, many stockholders turn to Warren Buffett for investment advice. The “Buffett Indicator” is a valuation measure that compares the stock market’s capitalization to the Gross Domestic Product. The indicator currently sits at 168%, which is 31% higher than the current long-term trend line of 128%.
 Source: currentmarketvaluation.com
Overvaluation is when the market capitalization of stocks grows faster than what economic growth can support. Any number above 128% is overvalued, and below 128% is undervalued. Investors currently are paying 1.68X what the economy can generate in revenue and earnings, lower than the 2.44X in September but still higher than the 128% historical trend.
According to Real Investment Advice:
Stocks are far from cheap. Based on Buffett’s preferred valuation model and historical data, return expectations for the next ten years are as likely to be negative as they were for the ten years following the late ’90s.
Yikes. With the Buffett Indicator pointing to a “lost decade” of negative returns, and Nouriel Roubini predicting the recession will be “severe, long and ugly,” the obvious question is how to batten down the hatches and survive the coming storm. The answer is “real assets”, including commodities, versus “financial assets”.
Real vs financial assets
First we need to define our terms.
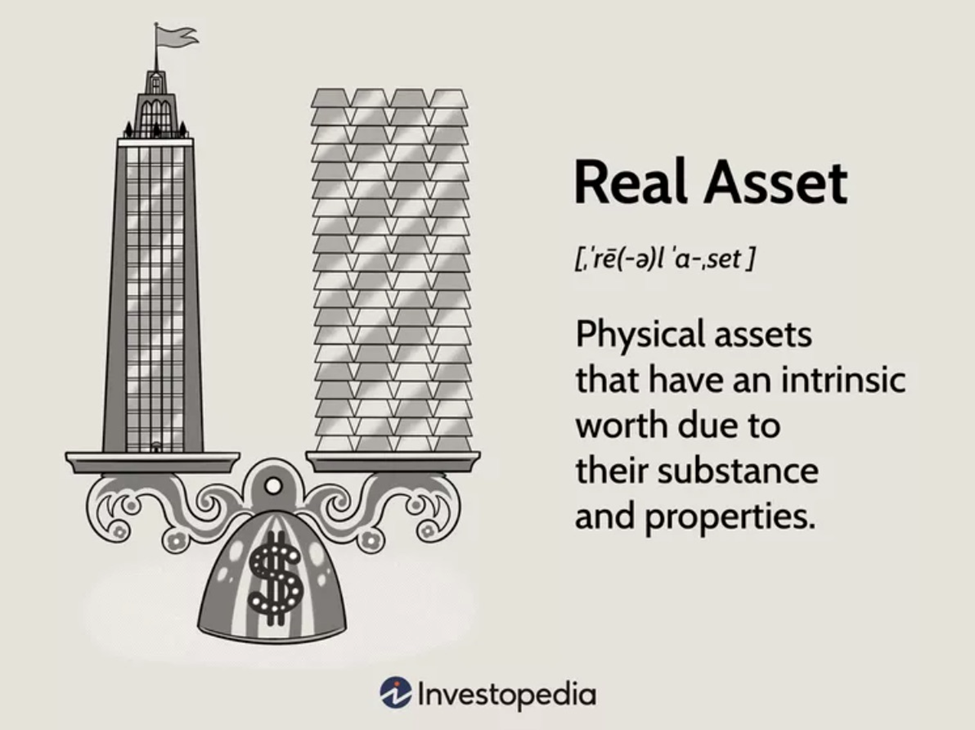
Investopedia defines real assets as physical assets that have an intrinsic worth due to their substance and properties. They include commodities, natural resources, equipment and real estate. Real assets provide portfolio diversification as they often move in the opposite direction as financial assets, which include stocks, bonds, mutual funds, savings and cash.
 Source: Investopedia/ Ellen Lindner
The two classes can overlap, for example commodity futures, exchange-traded funds (ETFs) and real estate investment trusts (REITs) are financial assets whose value depends on the underlying real assets.
The disadvantage of real assets is they are less liquid than financial assets. They take longer to sell and have higher transaction fees, carrying costs and storage costs. (e.g. bullion)
However, their main advantage over financial assets is they are more stable. Inflation, changes in currency values, and other macro-economic factors affect real assets less than financial assets. This makes them good investments during periods of high inflation. In addition, cash flow from real assets like real estate can provide predictable income streams for investors, states Investopedia.
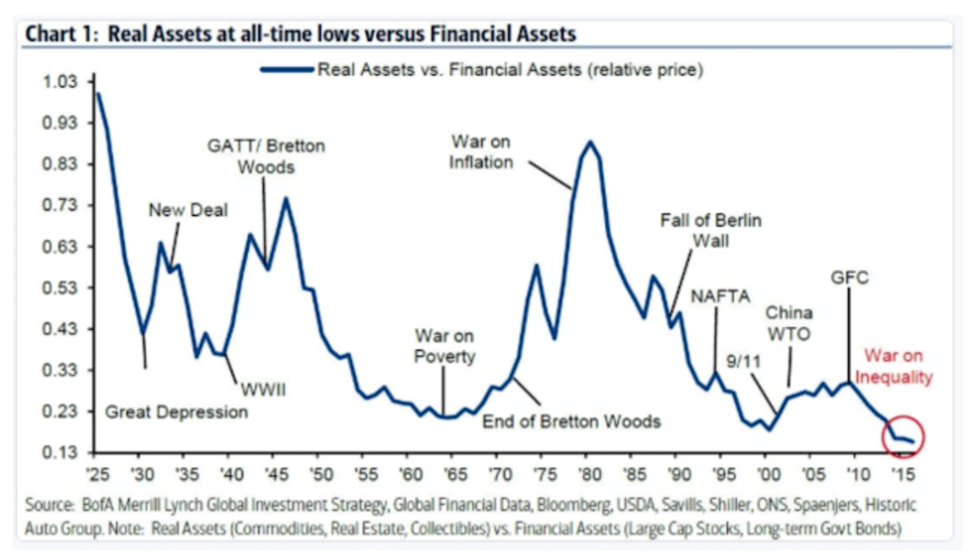
The chart below, via Harvest, graphs the price of real assts versus financial assets over time. We find that real assets explode in relative value during periods of inflation and war. This makes sense because more resources are needed, or commodities are scarce, relative to money. When the Harvest article was written in 2018, the author found that The flow of money has moved to financial assets especially those that are related to technologies that do not need capital.
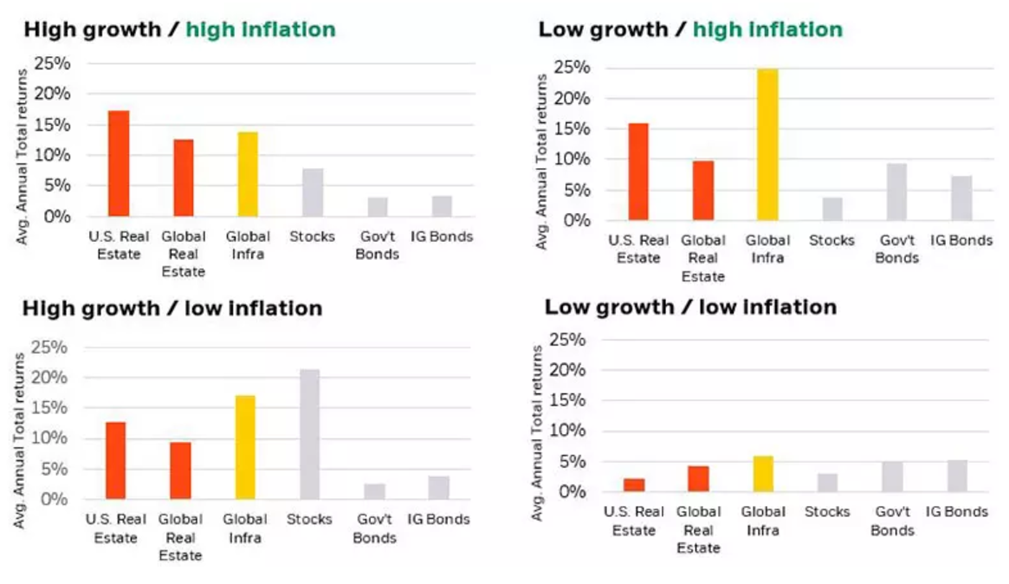 Real assets outperform traditional asset classes during high inflation environments
The chart below shows a wide dispersion between asset price inflation and real economy inflation. While real economy prices barely moved from 2009-18, asset prices exploded. Harvest states: The capital gains, dividends, or carry has favored these assets over investing in the real economy. Excess cash has used financial assets as a store of value. This is the collateral used for a levered economy.
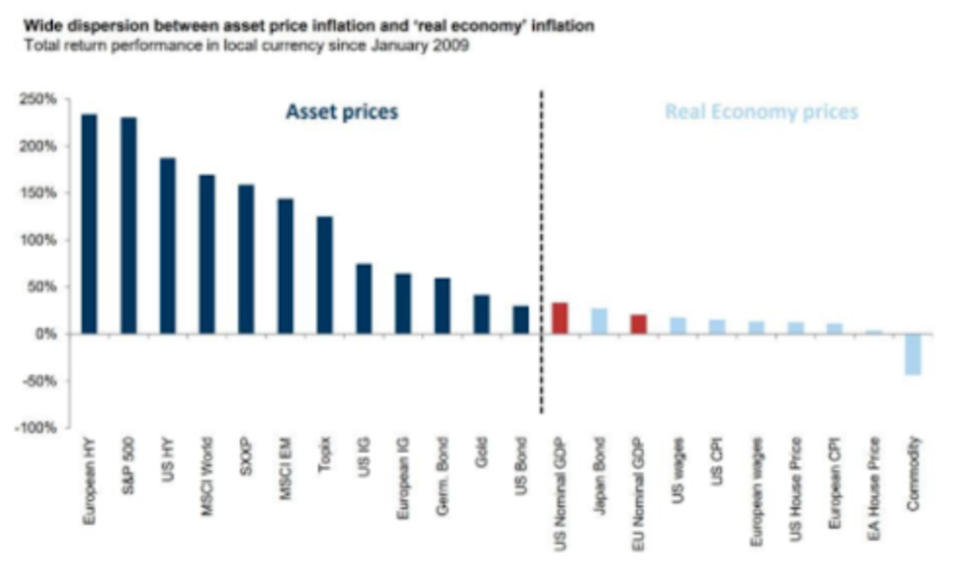
Undervalued commodities
Commodities protect investments from rising prices and currency debasement, making them a good place to park cash during inflationary periods.
Buy signal flashing for undervalued commodities
However, when investing in natural resource equities, the commodity capital cycle is more important than the broader economic cycle. I found the chart below in a recent report from Goehring & Rozencwajg, the Wall Street natural resource investment firm.
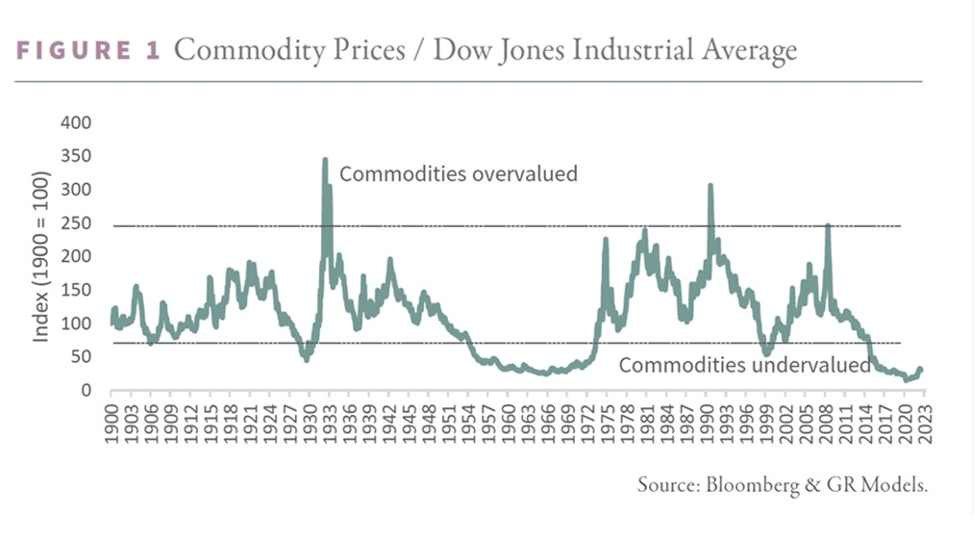
It shows the relationship between the Dow Jones Industrial Average and a commodity index going back several decades. It clearly indicates periods when commodities are extremely undervalued or overvalued — compared to the Dow. In places where the green line falls under 75, commodities are cheap relative to financial assets. These periods typically represent bear markets for commodities. The chart shows the most undervalued years for commodities were 1929, 1969, 1999 and 2020.
The following chart by Schroders is similar to G&R’s but tags key events at points in time when commodities have been overvalued.
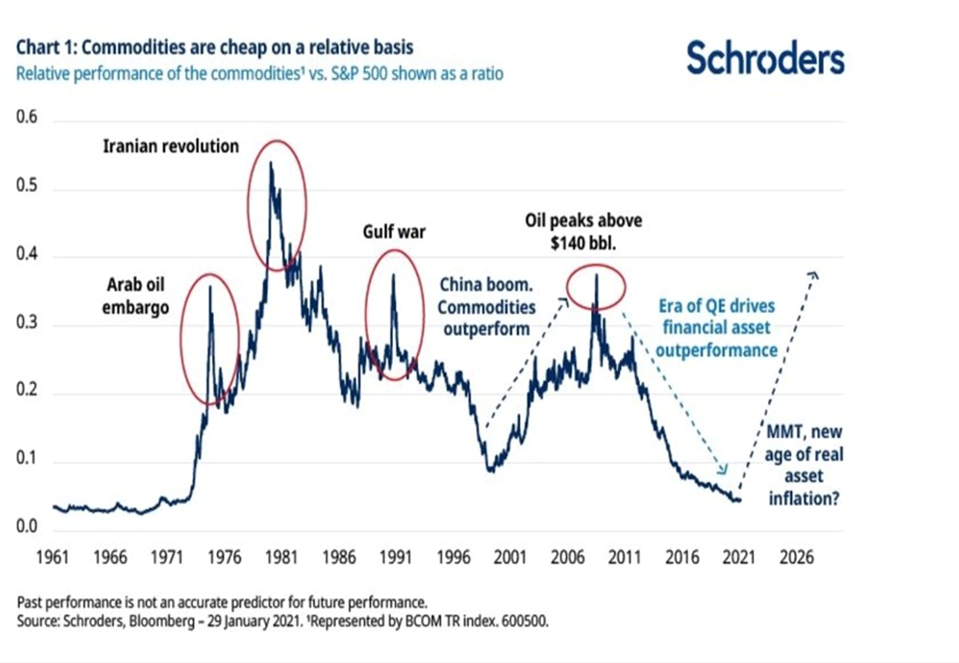
What makes commodities cheap, relative to financial assets? According to G&R, it has to do with natural resource capital spending:
A commodity price cycle usually follows a typical path. The industry might enjoy a period of very high energy or metal prices. Given their fixed cost base, the higher commodity prices fall directly to the bottom line resulting in a period of super-normal profits. High returns attract new capital and before long the industry begins a new cycle of exploration and development. Over time, increased spending leads to new supply which eventually outpaces demand growth and ushers in a period of commodity surplus. Prices fall, causing projects that were underwritten at higher prices to become impaired and written off. Often, another industry or investment strategy falls into favor around this time and investors rush to reallocate capital towards hot new speculative areas, leaving the resource industry even more capital starved. As depletion takes hold, supply falters, demand grows, and inventory gluts eventually get worked off. The stage is set for the next bullish cycle to start.
G&R’s advice is to buy resource stocks when commodities are cheap, and during bottoms in the natural resource capital investment cycle.
The key point is that even if we were to go into another recession, it doesn’t mean that commodity prices will fall in lockstep, as they did in 2008. In fact, they (and resource equities) are likely to hold their own and do quite well, because unlike in 2008, commodities are undervalued, shown on the chart as the green line below 75. (in 2008 the Commodity Prices/ Dow Jones Industrial Average was about 300, well into the “Commodities overvalued” range).
In terms of G&R’s commodity capital cycle described above, we are currently in the stage of depletion, when supply falters, demand grows, and inventory gluts get worked off. The stage is, imo, set for the next bullish cycle to start.
In their report, G&R maintain that The radical undervaluation of commodities and commodity-related equities is greater now than it was back in 1929, and the level of capital starvation is just as great. History tells us that commodities could again be an excellent place to seek high returns, even if the 2020s experience a period of economic turmoil as severe as the Great Depression — a scenario we consider unlikely.
Under-investment
I’ll say more about this “capital starvation” because it’s key to understanding what is happening with commodities right now.
As a result of the bear market in commodities from 2010-20, capital spending for the extractive industries — mining and oil and gas — has been severely curtailed. For example in the energy sector, capital spending in the S&P 500 has plummeted from $320 billion per year to less than $100B currently.
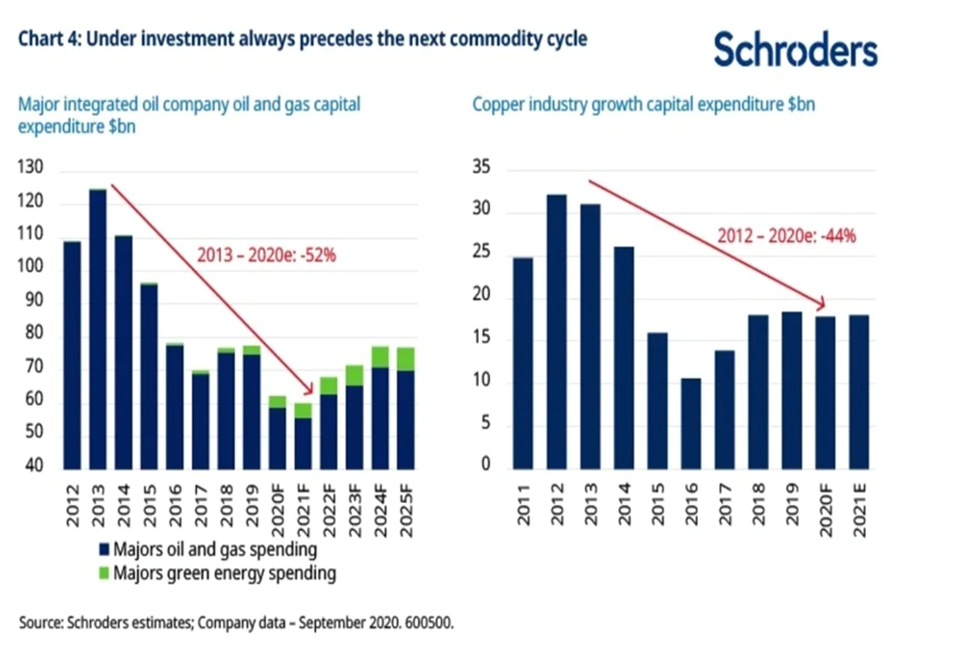
Another source found that capex in oil and gas and mining has fallen by about 40% since 2011. The 2021 article by Schroders notes that under-investment always precedes the next commodity cycle, with the chart below showing that capital investments in major integrated oil and gas companies declined by 52% between 2013 and 2020, and capex in the copper industry dropped by 44% between 2012 and 2020.
(The latter aligns with our research. As previously reported, global copper mine production will drop from the current 20Mt to below 12Mt by 2034, resulting in a supply shortfall of 15Mt. By then, over 200 copper mines are expected to run out of ore, with not enough new mines in the pipeline to take their place. S&P Global estimates that new copper discoveries have fallen by 80% since 2010.)
Conclusion
Inflation, changes in currency values, and other macro-economic factors affect real assets less than financial assets. This makes them good investments during periods of high inflation, like currently. In addition, cash flow from real assets like real estate can provide predictable income streams for investors.
Real assets explode in relative value to financial assets, during periods of inflation and war. This makes sense because commodities are scarce, relative to money.
G&R’s Commodity Prices/ Dow Jones Industrial Average chart shows there hasn’t been a better setup for commodities than now, over a time frame spanning 120 years.
There are many reasons to be bullish on commodities and, a lot to indicate that inflation is not going away anytime soon, thus setting up the conditions for a multi-year commodities up-trend.
Why the Fed is wrong about inflation coming down
First, there has been a lack of spending on exploration and development, leading to current and looming supply shortages for a number of metals. The mining companies in the mid-2010s basically ate each other and by shutting down exploration there was no accretive increase in reserves. Lower ore grades have also become an issue.
Second, natural resources are being used up faster than they can be replenished; this is another theme driving commodity prices higher.
Third, countries that have the metals needed to fuel economic growth are guarding them more closely than previously; resource nationalism is on the rise.
Bloomberg New Energy Finance estimates this transition will require about $173 trillion in investments over the next 30 years.
We are looking at elevated prices for certain critical and industrial metals that are central to the new green economy, like copper, lithium and graphite, for years if not decades to come. At Ahead of the Herd we also believe precious metals, and the junior resource companies who explore for gold and silver, are must owns.
Richard (Rick) Mills
aheadoftheherd.com
Legal Notice / Disclaimer
Ahead of the Herd newsletter, aheadoftheherd.com, hereafter known as AOTH.
Please read the entire Disclaimer carefully before you use this website or read the newsletter. If you do not agree to all the AOTH/Richard Mills Disclaimer, do not access/read this website/newsletter/article, or any of its pages. By reading/using this AOTH/Richard Mills website/newsletter/article, and whether you actually read this Disclaimer, you are deemed to have accepted it.
Any AOTH/Richard Mills document is not, and should not be, construed as an offer to sell or the solicitation of an offer to purchase or subscribe for any investment.
AOTH/Richard Mills has based this document on information obtained from sources he believes to be reliable, but which has not been independently verified.
AOTH/Richard Mills makes no guarantee, representation or warranty and accepts no responsibility or liability as to its accuracy or completeness.
Expressions of opinion are those of AOTH/Richard Mills only and are subject to change without notice.
AOTH/Richard Mills assumes no warranty, liability or guarantee for the current relevance, correctness or completeness of any information provided within this Report and will not be held liable for the consequence of reliance upon any opinion or statement contained herein or any omission.
Furthermore, AOTH/Richard Mills assumes no liability for any direct or indirect loss or damage for lost profit, which you may incur as a result of the use and existence of the information provided within this AOTH/Richard Mills Report.
You agree that by reading AOTH/Richard Mills articles, you are acting at your OWN RISK. In no event should AOTH/Richard Mills liable for any direct or indirect trading losses caused by any information contained in AOTH/Richard Mills articles. Information in AOTH/Richard Mills articles is not an offer to sell or a solicitation of an offer to buy any security. AOTH/Richard Mills is not suggesting the transacting of any financial instruments.
Our publications are not a recommendation to buy or sell a security – no information posted on this site is to be considered investment advice or a recommendation to do anything involving finance or money aside from performing your own due diligence and consulting with your personal registered broker/financial advisor.
AOTH/Richard Mills recommends that before investing in any securities, you consult with a professional financial planner or advisor, and that you should conduct a complete and independent investigation before investing in any security after prudent consideration of all pertinent risks. Ahead of the Herd is not a registered broker, dealer, analyst, or advisor. We hold no investment licenses and may not sell, offer to sell, or offer to buy any security.
 Subscribe to my free newsletter


