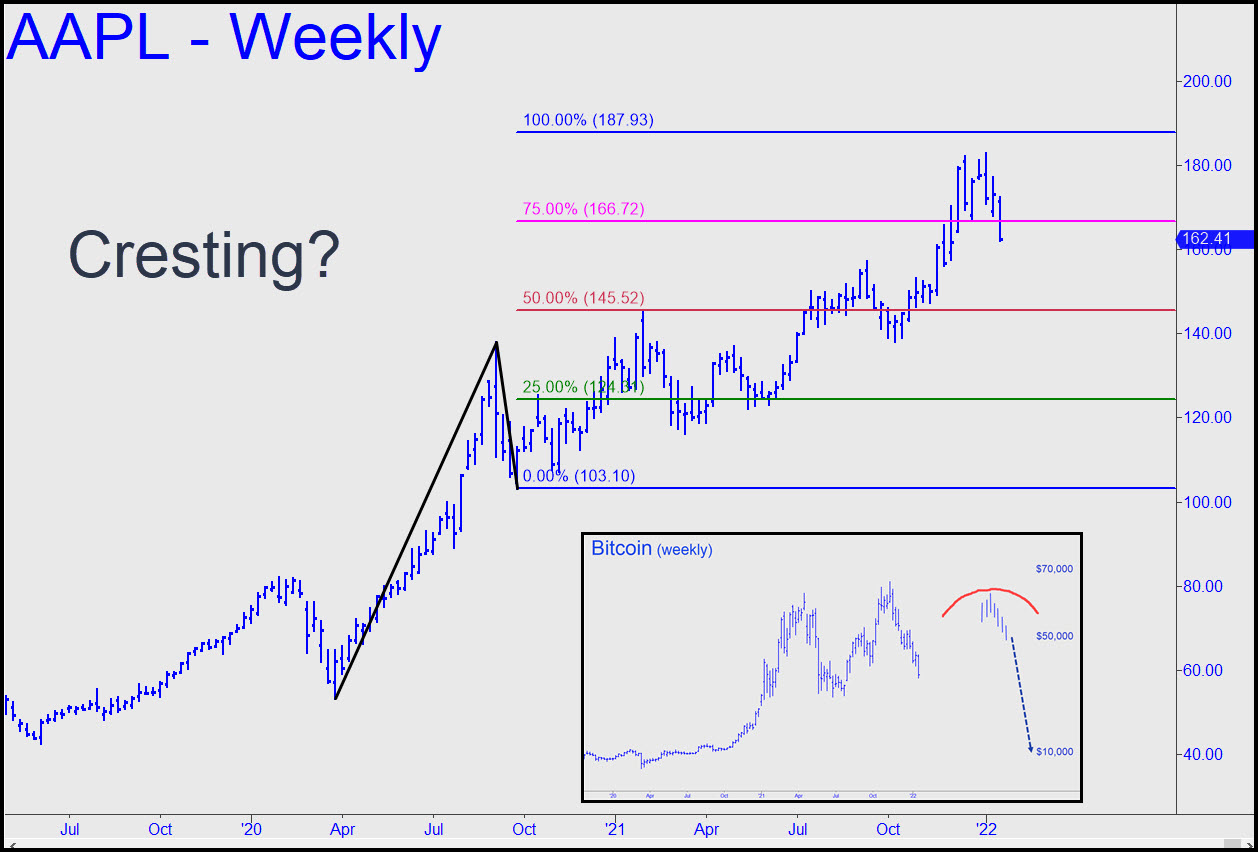
With the bull market in an apparent topping process, it will always be insightful to ponder Apple's chart. It offers a window into the minds of money managers, many of whom have staked their careers on the uptrend of just one stock. Some of these guys would be sorely challenged to analyze a game of Chutes and Ladders. Staying long in AAPL for the last 13 years, however, and robotically adding to positions the entire way up, has required no analytical skills whatsoever, only the hubris to believe the lucrative ride will last forever. But how much more growth can a company already valued at $3 trillion deliver? This question was bound to trouble portfolio managers eventually, and it would appear that time is now.
The first thing to notice in the chart is that the stock recently failed to reach a compelling Hidden Pivot rally target at 187.93 that was flagged here more than a year ago. It could still be achieved, although the weight of the topping pattern just beneath the target suggests the easy opportunity may be past. Under the best circumstances, chewing through the supply overhang would first require a consolidation at lower levels, then a confidence-building trek up a familiar slope that would take perhaps 4-6 months. This is by no means too much to hope for, but as my friend 'Trader Mike' Schurr always likes to remind me, hope is not a strategy.
AAPL's Cousin, Bitcoin
I've included a chart of bitcoin that stretches back two years. Bitcoin is AAPL's speculative cousin, the exuberantly irrational side of the bull market. It, too, appears to be in a topping pattern, which I've sketched speculatively as head-and-shoulders formation. This is fanciful although not farfetched. AAPL arguably was forming a head-and-shoulders itself until last week's plunge destroyed the would-be neckline. Even so, it's possible to extrapolate a fall in the stock that would correspond to bitcoin's implied head-and-shoulders plunge. It would bring Apple shares down to around $55.
None of this is chiseled and stone, of course. If AAPL and its canny handlers are going to prove me wrong, we should see evidence of this very soon in the form of a sharp reversal from either $160 or $156 that inflicts considerable pain and damage on bears. The former number represents a 50% correction of the run-up since October 8, the latter a 0.618 retracement. Such a rally would be startling, especially with the geopolitical world looking so similar to that of 1939, and with China's real estate bubble beginning to implode. Ironically, the rise in T-Bond rates to a predicted 3% could forestall the deflationary endgame I've long predicted, giving the central bank room to loosen and a temporary respite to investors.

