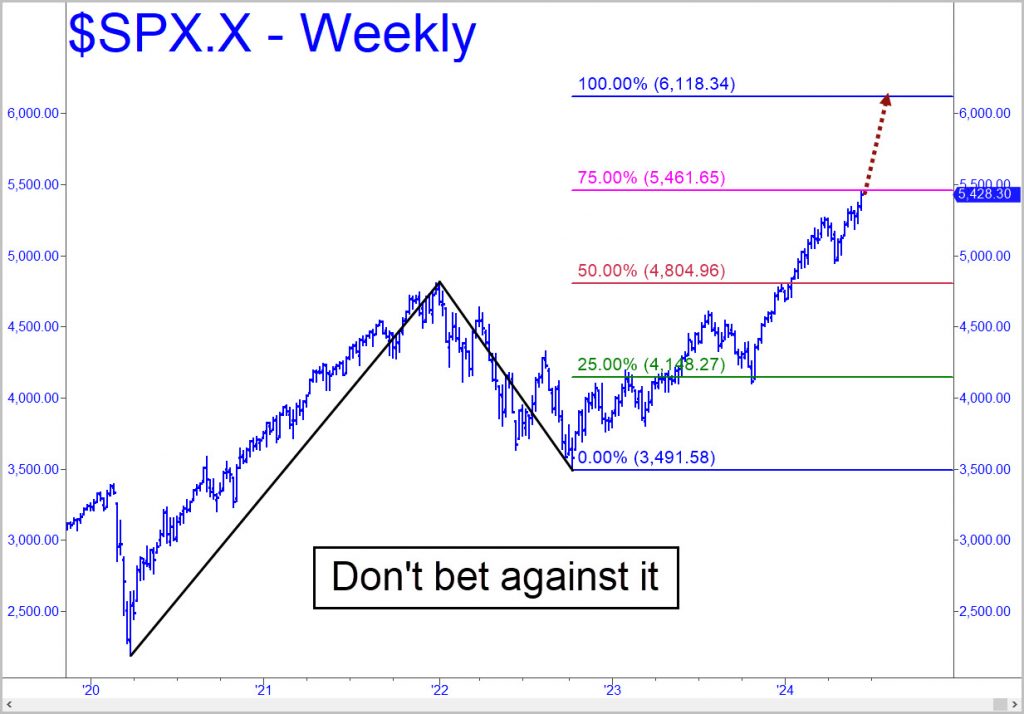
 Last week’s rabid short-squeeze punctured bull-market targets I’ve been drum-rolling for months in Microsoft, Apple and QQQ. Moreover, the bullish look of the S&P 500 chart shown above is so clear and compelling that even the most stubborn permabears will need to make room for more upside to at least 6118, a nearly 13% rally from these levels. If the uptrend maintains its current pitch, it would hit the target just in time for Papa Bear to come bellowing from his lair at the ‘correct’ time of year — i.e., when autumn leaves start to fall.
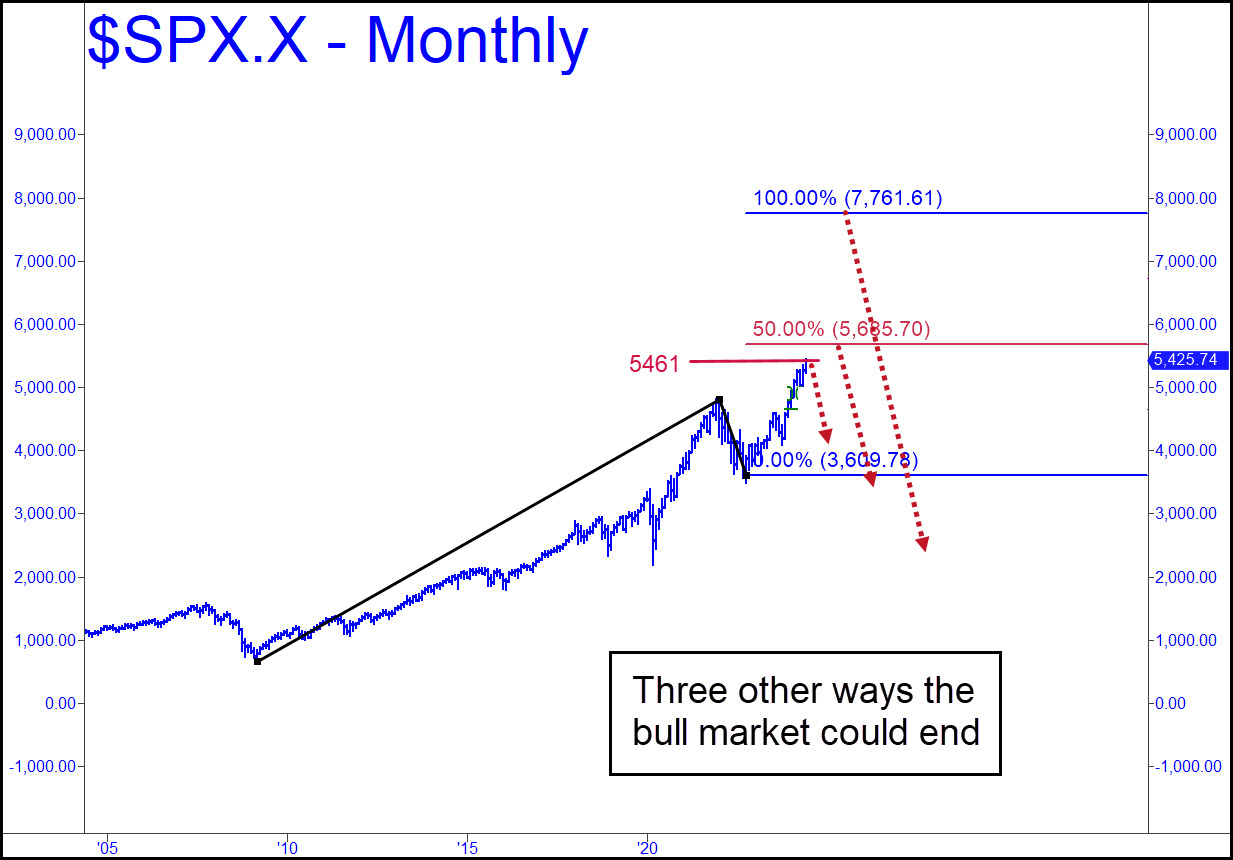
The long-term charts allow three other scenarios that should not be ruled out. The first would be for the bull market to flame out here and now, with the S&Ps lying just a split hair from the pattern’s ‘secondary Hidden Pivot resistance’ at 5461. I would rate this scenario a 40% possibility. More likely is a continuation to 6118, and then a major selloff. This is based, as are all Hidden Pivot forecasts, on price action at the red line, a ‘midpoint’ Hidden Pivot at 4804 that got shredded back in December. If a midpoint resistance is easily exceeded the first time it’s touched, that’s usually a sign that the target itself — in this case 6118 — will eventually be achieved. However, as you can see in the chart, the move through the red line was gradual rather than dramatic. This implies that although a further run-up to 6118 is likely, it is no a lead-pipe cinch.
Second Wind, and Then…
Given the pattern’s clarity, it is difficult to imagine that the S&Ps will quickly push past 6118 when they get there. There will almost certainly be a tradeable pullback, and the odds are about 60% that it will be the beginning of a bear market. However, a third possibility to which I alluded above would be for the S&Ps to get second wind, presumably after a plunge steep enough to given even permabulls a good scare. Then, if the subsequent run-up were to exceed 6118 by perhaps 200 points or more, or close above it for two consecutive months, I would infer that the S&Ps were on their way up to a bull market top at 7761. That’s shown in this chart. Notice that this pattern’s all-important ‘midpoint’ Hidden Pivot lies at 5685, so we must allow for a possible stall there, too, followed by a fatal plunge.
Here, then, is the sequence of key numbers to watch: 5461…5685…7761. A decisive upside penetration of one would be reason to presume the next will be reached. In any event, 7761 is as high as my technical methods ‘allow’ the S&Ps to go. That seems like a stretch, given that stocks are pumped full of hydrogen, and that rising interest rates have already set in motion a devastating collapse in commercial real estate. Even so, the market could continue to climb, not a wall of worry, but a tsunami of short-covering by bears who got everything right but the timing.
About the author