Muted reaction by the markets after the release of US June nonfarm payrolls suggest that traders are looking for more evidence of sustained hiring in US jobs. Wages are rising in USA, jobs are rising in USA but so is real inflation in USA. Usual factors like trend of US dollar index, bond yield difference between USA and rest of the world, trend of crypto assets will also affect bullion prices. May to October is a cyclical period for gold and silver investors.
Dissecting June to October trend of gold and silver (using past month end closing price from 2015-2020)

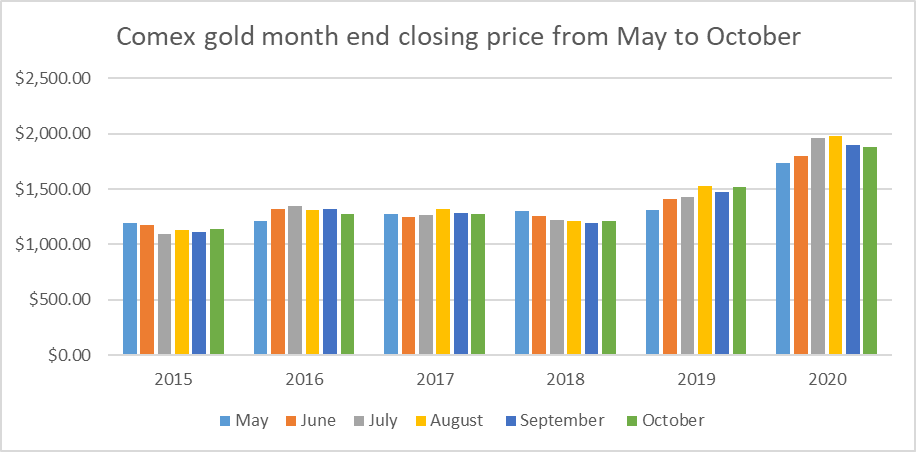
The above chart tells us that gold has not risen sharply between June to October every year if we compare the closing price on last trading day of the month. There has been very sharp rise but profit taking has historically pushed price lower or a very minimal rise. Even in 2020 gold price has corrected sharply from highs.
|
|
2015 |
2016 |
2017 |
2018 |
2019 |
2020 |
|
Gold % Gain/Loss between June to October (month end price comparison.) |
0.47% |
-0.58% |
0.02% |
0.85% |
-2.09% |
-1.43% |
If cyclical trends continue in the current quarter this year then gold price will rise but will be followed by an equally sharp fall. Interest rate expectation Economic news, and covid news will be the key market moving/market sharking factors.

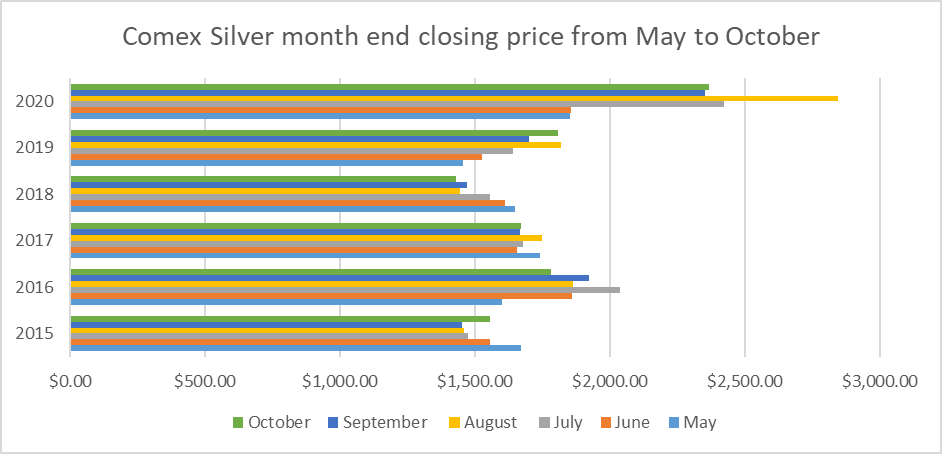
Just like gold, silver generally has had a lacklustre four months between June to October. Unlike precious five years, momentum for silver is very bullish. Silver price manipulation by JP Morgan and its associate banks and hedge funds are infective against reditt army. Reditt army is very bullish for silver. Silver will once get its “silver squeeze moment” in the current quarter.
|
|
2015 |
2016 |
2017 |
2018 |
2019 |
2020 |
|
Comex Silver % Gain/Loss between June to October (month end price comparison.) |
1.13% |
-1.80% |
0.71% |
2.18% |
-3.50% |
-5.15% |
Now let’s dissect the monthly high price and low price of gold and silver. It will give us the trading range. Below table gives us an indication
|
COMEX GOLD NEAR TERM FUTURES |
||||||||||||
|
|
2015 |
2016 |
2017 |
2018 |
2019 |
2020 |
||||||
|
Month |
HIGH |
LOW |
HIGH |
LOW |
HIGH |
LOW |
HIGH |
LOW |
HIGH |
LOW |
HIGH |
LOW |
|
MAY |
$1,232.00 |
$1,168.40 |
$1,306.00 |
$1,199.00 |
$1,273.20 |
$1,214.30 |
$1,326.30 |
$1,281.20 |
$1,306.40 |
$1,267.30 |
$1,775.80 |
$1,676.00 |
|
June |
$1,204.70 |
$1,162.10 |
$1,362.80 |
$1,208.20 |
$1,298.80 |
$1,236.50 |
$1,313.00 |
$1,246.90 |
$1,442.90 |
$1,310.90 |
$1,804.00 |
$1,671.70 |
|
July |
$1,174.40 |
$1,072.30 |
$1,377.50 |
$1,310.70 |
$1,270.80 |
$1,204.00 |
$1,266.90 |
$1,210.70 |
$1,454.40 |
$1,384.70 |
$1,981.10 |
$1,766.30 |
|
August |
$1,169.80 |
$1,080.20 |
$1,374.20 |
$1,306.90 |
$1,331.90 |
$1,253.90 |
$1,226.00 |
$1,167.10 |
$1,565.00 |
$1,412.10 |
$2,089.20 |
$1,874.20 |
|
September |
$1,156.40 |
$1,097.70 |
$1,357.60 |
$1,346.90 |
$1,362.40 |
$1,278.20 |
$1,218.00 |
$1,184.30 |
$1,566.20 |
$1,470.50 |
$2,001.20 |
$1,851.00 |
|
October |
$1,191.70 |
$1,103.80 |
$1,322.60 |
$1,243.20 |
$1,308.40 |
$1,262.80 |
$1,246.00 |
$1,186.00 |
$1,525.80 |
$1,465.00 |
$1,939.40 |
$1,859.20 |
|
|
MONTHLY HIGH-LOW BETWEEN MAY AND OCTOBER BETWEEN 2015-2020 |
|||||||||||
|
2015 |
$1,232.00 |
$1,072.30 |
|
|
|
|
|
|
|
|
|
|
|
2016 |
|
|
$1,377.50 |
$1,199.00 |
|
|
|
|
|
|
|
|
|
2017 |
|
|
|
|
$1,362.40 |
$1,204.00 |
|
|
|
|
|
|
|
2018 |
|
|
|
|
|
|
$1,326.30 |
$1,167.10 |
|
|
|
|
|
2019 |
|
|
|
|
|
|
|
|
$1,566.20 |
$1,267.30 |
|
|
|
2020 |
|
|
|
|
|
|
|
|
|
|
$2,089.20 |
$1,671.70 |
Average High-Low price difference will us give us the volatility and price band in US dollar terms. This will help us to make it easier to make trading decision. Average high-low price between May to October months in years 2015 to 2020 was at $228.70. This implies gold price will move a minimum $228.70 either side anytime end October of this year. Gold minimum risk is also gets known and also the trading range. Current price if gold is at $1792.00. Minimum high price should be $2020.70 ($1792+$228.70). If gold crashes then minimum low price will be $1563.30 ($1792-228.70). So now we have the potential range which is $1563.30-$2020.70. I expect an overshooting/undershooting of five percent. Financial markets are prone to excess. Now I will apply the same gold principle to silver.
|
COMEX SILVER NEAR TERM FUTURES |
||||||||||||
|
|
2015 |
2016 |
2017 |
2018 |
2019 |
2020 |
||||||
|
Month |
HIGH |
LOW |
HIGH |
LOW |
HIGH |
LOW |
HIGH |
LOW |
HIGH |
LOW |
HIGH |
LOW |
|
MAY |
$1,777.50 |
$1,589.50 |
$1,806.00 |
$1,591.50 |
$1,746.50 |
$1,606.00 |
$1,686.50 |
$1,604.50 |
$1,499.50 |
$1,426.50 |
$1,855.00 |
$1,476.00 |
|
June |
$1,717.00 |
$1,541.50 |
$1,885.50 |
$1,583.00 |
$1,774.50 |
$1,622.50 |
$1,735.00 |
$1,588.00 |
$1,555.55 |
$1,456.50 |
$1,895.00 |
$1,701.50 |
|
July |
$1,590.00 |
$1,433.00 |
$2,122.50 |
$1,878.00 |
$1,687.00 |
$1,434.00 |
$1,626.00 |
$1,518.50 |
$1,668.50 |
$1,491.50 |
$2,627.50 |
$1,799.50 |
|
August |
$1,571.50 |
$1,391.00 |
$2,083.50 |
$1,837.00 |
$1,766.50 |
$1,609.50 |
$1,557.50 |
$1,431.50 |
$1,861.50 |
$1,593.50 |
$2,991.50 |
$2,358.00 |
|
September |
$1,543.50 |
$1,424.00 |
$2,023.50 |
$1,981.80 |
$1,829.00 |
$1,664.00 |
$1,475.50 |
$1,393.50 |
$1,975.00 |
$1,698.00 |
$2,923.50 |
$2,181.00 |
|
October |
$1,637.00 |
$1,436.00 |
$1,938.50 |
$1,711.50 |
$1,749.50 |
$1,634.50 |
$1,495.00 |
$1,424.00 |
$1,835.00 |
$1,694.00 |
$2,571.00 |
$2,262.50 |
|
|
MONTHLY HIGH-LOW BETWEEN MAY AND OCTOBER BETWEEN 2015-2020 |
|||||||||||
|
2015 |
$1,777.50 |
$1,391.00 |
|
|
|
|
|
|
|
|
|
|
|
2016 |
|
|
$2,122.50 |
$1,583.00 |
|
|
|
|
|
|
|
|
|
2017 |
|
|
|
|
$1,829.00 |
$1,434.00 |
|
|
|
|
|
|
|
2018 |
|
|
|
|
|
|
$1,735.00 |
$1,393.50 |
|
|
|
|
|
2019 |
|
|
|
|
|
|
|
|
$1,975.00 |
$1,426.50 |
|
|
|
2020 |
|
|
|
|
|
|
|
|
|
|
$2,991.50 |
$1,476.00 |
Silver’s Average high-low price between May to October months in years 2015 to 2020 was at $621.10. This implies silver price will move a minimum $621.10 either side anytime end October of this year. Silver minimum risk is also gets known and also the trading range. Current price of Silver is at $2660.00. Minimum high price should be $3281.10 ($2660+$621.10). If Silver crashes then minimum low price will be $2038.90 ($2660-$621.10). So now we have the potential range which is $2038.90-$3281.10. I expect an overshooting/undershooting of five percent.
|
Average High-Low Price difference between May and October |
||
|
|
Gold |
Silver |
|
2015 |
$159.70 |
$386.50 |
|
2016 |
$178.50 |
$539.50 |
|
2017 |
$158.40 |
$395.00 |
|
2018 |
$159.20 |
$341.50 |
|
2019 |
$298.90 |
$548.50 |
|
2020 |
$417.50 |
$1,515.50 |
|
Average |
$228.70 |
$621.08 |
A lot of silver traders and investors will get goose bumps in their stomach after reading the lowest price projection of silver (2038.90). I do not expect silver to fall to $2038.90 minimum price projection. But the emphasis here is to prepare yourself for the margin call in futures investment and option investment just in case there is a sell off.
Fear, panic and lack of margin money creates most losses in trading and investment. Most of us panic when price crashes of any investment and not just gold and silver. If we get to know the lowest price then fear and panic will get evaporated from our mind. We also get to know the margin money if price crashes or price zooms. (There are short sellers as well). Investment decisions will also be made if we know the potential margin money needed. Economics of “Opportunity Cost” or cost of next best alternate investment has to be looked as well.
The world is going through a period of transition from a “coronavirus world” to a “coronavirus free world”. There will be small bouts of new covid infections. In my view world has seen peak infections. This transition phase will be there till early next year. Volatility will rise in all asset classes and not just bullion. Knowing the wider trading range using historical price data can be one of the tools to make prudent investment decisions. In the long term fundamentals dictate technical. In the very short term the reverse happens, it is the technical which dictates every investment. One should also never ignore the fundamentals.

