The reason for the plunge in gold and silver are (a) Sharp rise in bitcoin, ethereum and other crypto currencies. Crypto currencies are once again set for a daily new high if the rise continues till tomorrow. Crypto currencies are very bullish. (b) Some bullion traders have once again moved to crypto currencies trading. (c) Massive sell stop losses were triggered once gold fell below $1737 and silver fell below $23.87. (d) Closing of major Asian markets of Tokyo and Singapore added to the woes of gold and silver bulls. (e) A robust US July nonfarm payrolls and historically high credit card spending in the USA suggest that the US economy will remain robust. Taper as early as early November is getting factored in by traders.
What to look for the rest of the day and this week.
- Physical demand and investment demand for gold and silver.
- Price stabilization is the key. Gold and silver prices have to stabilize (if not fall) to attract very high physical demand and investment demand. Remember no one invests in a falling market.
- Look for signs of short covering in London and USA in bullion.
- US inflation numbers on Wednesday and Thursday. A higher number will result IN gold and silver paring most of the losses after payrolls and vice-versa.
- Copper and industrial metals price is sitting on news on passage of US infrastructure bill. Cautious optimism in copper and industrial metals till tomorrow.
- Any sustained sharp rise in coronavirus variant cases in USA, Japan and other developed nations and subsequent lockdown will ensure a quick turnaround in gold and silver price direction to bullish (from bearish).
- Gold and silver have to trade over $1676 and $23.78 on daily closing basis till Friday to be in a short term bullish zone. Failure to do so will result in another five percent sell off from the current price.
COMEX SILVER SEPTEMBER (current market price $2388.30)
- One hundred week moving average is at $2221.20.
- Silver needs to trade over $2221.20 on daily closing basis to be in a short term bullish zone and rise to $2580.70.
- However a daily close below $2370 for four consecutive days will result in fall to $2221.20 and 1942.90 in the short term. (highly unlikely but this is the technical).
Risk to return ratio for bullion
Under the worst case scenario the downside risk for gold is sixteen percent and a upside target of twenty five percent for gold. Silver has a downside risk to twelve percent under the worst case scenario and an upside potential of thirty percent before end November.
A bit on MCX Gold October –December price spreads/badla
I have never traded in MCX gold October futures due to lack of parity with comex gold December futures. It is only since 2020 that comex gold October futures has commanded some value. Comex gold December and MCX gold December future is relevant for hedging purpose. MCX gold October future will end on 30th September. Let’s look at the spread trend for the last three years.
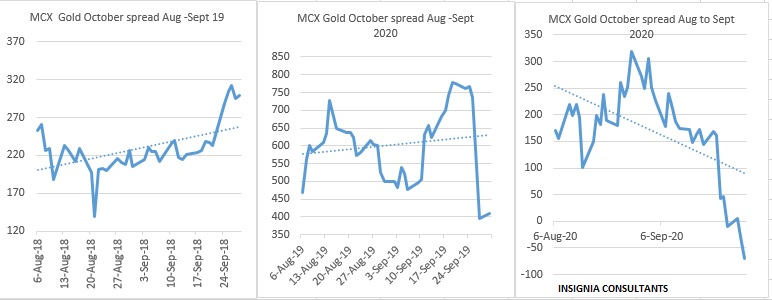
The above graph is from 6th August to 30th September of 2018, 2019 and 2020. This will give us an idea where MCX gold spreads traded in August and September months.
|
MCX Gold December-October |
|||
|
|
Closing Spread/Badla |
||
|
Year |
Average |
Maximum |
Minimum |
|
2018 |
₹ 229.00 |
₹ 312.00 |
₹ 140.00 |
|
2019 |
₹ 602.00 |
₹ 779.00 |
₹ 396.00 |
|
2020 |
₹ 171.00 |
₹ 319.00 |
-₹ 70.00 |
In 2018 MCX gold October future had bullish trend between 6th August and 30th September.
In 2019, MCX gold price October had an “inverted V shaped” price move between 6th August and 30th September.
In 2020, MCX Gold October had a falling price trend between 6th August and 30th September.
The conclusion which I can derive for MCX gold December –MCx Gold October spread/badla are
- Spread/badla move in a narrow range if gold price moves in a one way price trend with low volatility.
- The more volatile and directionless gold price are the higher will be the spread/badla.
- MCX gold spread between two near months contracts rise when gold price are in a bullish trend or price are nearing a short term bottom.
- Spread/badla falls (between two near term MCX gold futures) or there is even backwardation when gold prices are in a bearish trend.
- MCX gold December – MCX gold October closing spread/badla is at Rs.152. Spread/badla will be negative if gold price move into a medium term bearish trend. However if gold price appears to form a medium term top then this spread/badla will rise to Rs.313 and Rs.725.
About the author