
Using three vantage points, the US dollar, the Gold/Silver ratio and the 10yr-2yr Yield Curve, broad markets are indicated to be at an important decision point
There sure are a lot more indicators NFTRH uses to gauge the macro, but these three will suffice for the point of this article, which is that change is coming and the nature of that change could not be more different in its two potentials.
Thing 1: Anti-USD, inflation trades as gold under-performs silver, or Thing 2: USD and the Gold/Silver ratio get unruly to the upside. The best part, and to keep the analysis challenging (i.e. not for ‘set it and forget it’ ideologues or dogmatists), is that a third indication, the 10yr-2yr Yield Curve can steepen under either situation, inflationary or deflationary.
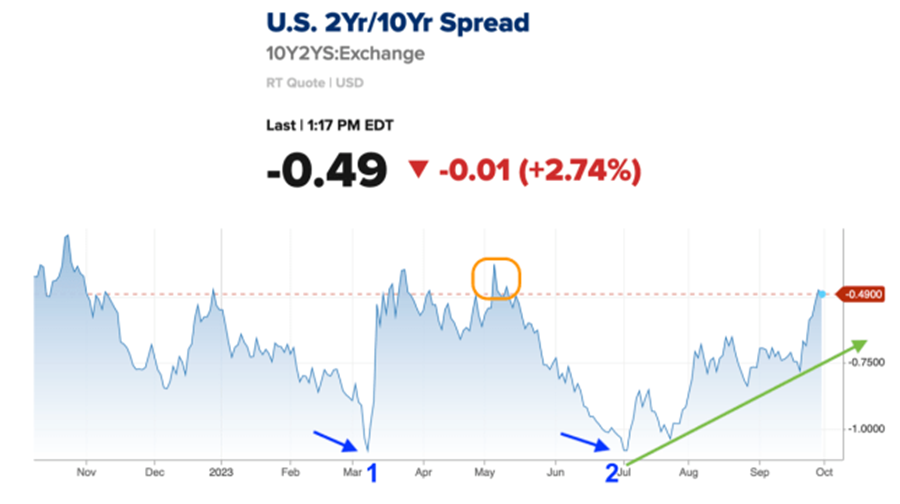
Let’s start with the Yield Curve, which has been steepening from a secondary extreme inversion (blue arrows) since July. This week the curve lunged higher. The point marked in orange would likely set the steepener’s uptrend if it is taken out. As it stands, it is still a well inverted curve, but a steepener would have to start somewhere, and that secondary extreme looks to me like that somewhere.
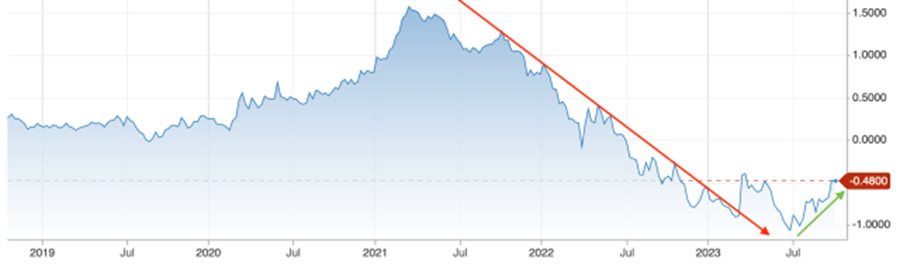
Here is a longer-term view of the Yield Curve for reference. Of note, the 2020 steepener started out deflationary (short-term yields dropped harder than long-term yields) as the herds rampaged to the liquidity of the US dollar and its T-bill and short-term Treasury equivalents harder than they speculated in long-term Treasury bonds.
Then as we all know, the expected inflation problem then materialized shortly thereafter, and that drove the curve higher as long-term yields were driven impulsively upward in large part due to inflation fears. The tardy Fed then donned its hawk costume and began tightening sternly, which drove the curve back into a flattener, in which a Goldilocks phase, which we projected in Q4, 2022, has prospered. That will end with a curve steepener.
Regardless of whether or not the curve steepens inflationary or deflationary, a steepening would eventually be economically corrosive at best, as the classic interpretation is that the curve flattens with a boom and steepens with a bust.
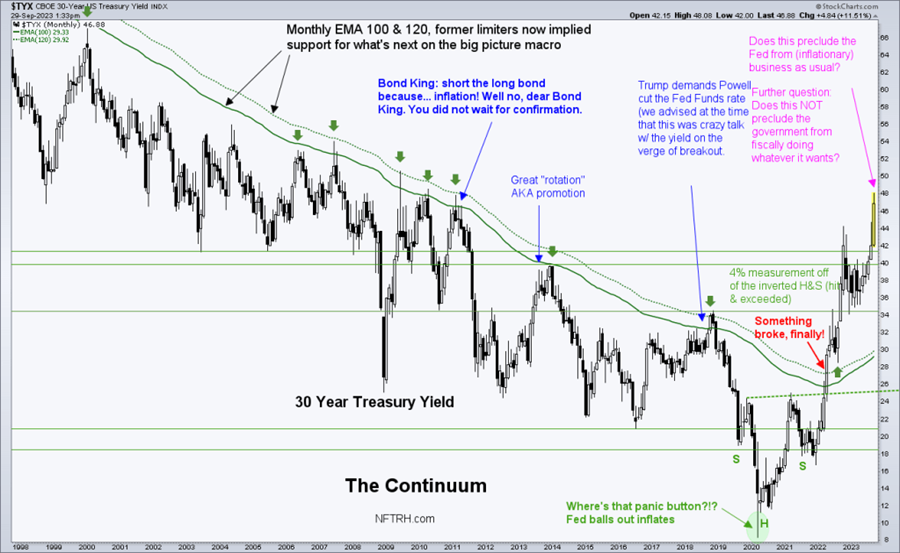
Here is the picture of the Continuum (30yr Treasury yield) that I never get tired of looking at and contemplating the interpretations and implications of. Talk about impulsive!
Moving on, the 2 (would-be) Horsemen of the macro liquidity Apocalypse, the US dollar and the Gold/Silver ratio are in decision mode about whether to move up together or down together. When gold rises vs. silver and the reserve currency also rises, liquidity stress is indicated.
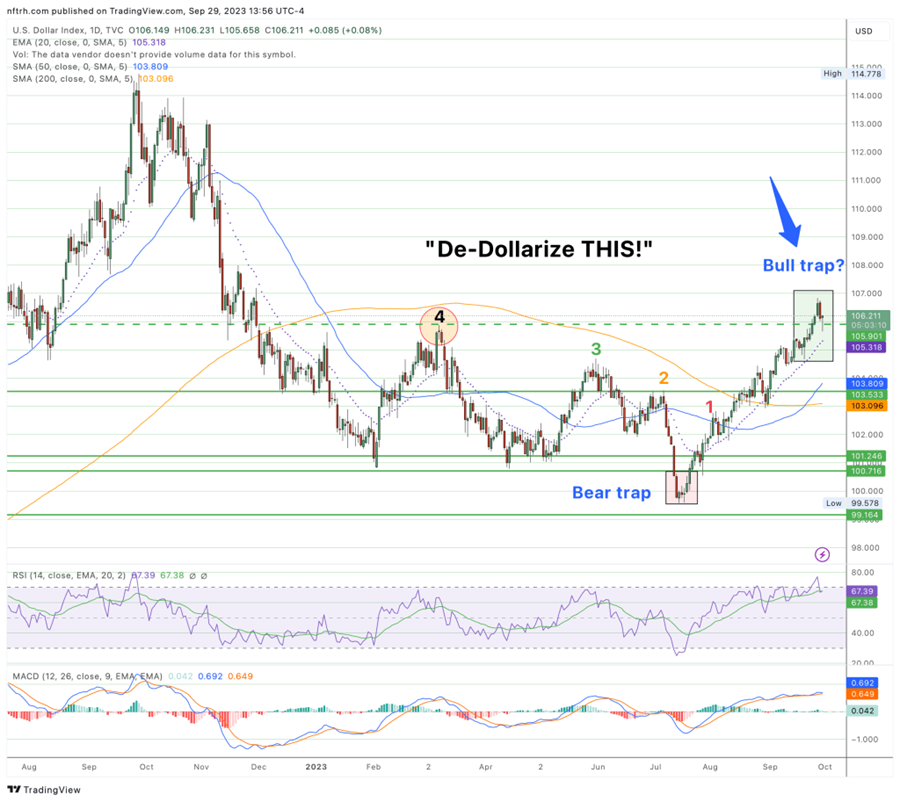
USD (DXY) took out point 4, effectively eliminating the intermediate daily chart downtrend with a higher high to the March high (point 4). But it is overbought and subject to pullback, which it is already doing. If this is a USD bull trap (USD declines) to the degree that the July breakdown was a bear trap, then it’s probably going to be party on, Garth, and party on with an inflation trade flavor (commodity/resources producers, precious metals as silver leads gold, EM, Asia, etc.).
But if silver fails to lead gold and instead the Gold/Silver ratio regathers itself and impulses upward to eliminate the current negative divergence to USD, then all inflationary bets will be off for a while and the interim deflation scare scenario would be in play.
Here is the Gold/Silver ratio today (Friday) having gotten hit along with USD on some tame inflation news out earlier. But that in-day upward reversal candle along with USD’s drop and reversal at least keep the forces of liquidity destruction in play.

I should note that I am not making predictions or promoting a favored outcome. I am simply waiting for answers from the market in the form of these indications to come, and others. Taking out the grimacing emoji would set a caution, the poop emoji would really bring on concern and the praying hands emoji, well, it speaks for itself. If a deflation scare manifests, it would be viewed as interim to the next inflation phase, which could be ever more intense.
Meanwhile, in the near-term the question is liquidity destruction or market relief and rallies with an ‘inflation trade’ flavor? The 10-2 Yield Curve is posturing to steepen and as such, one of these two options is likely. Another implication of an inflationary steepener could be eventual Stagflation, in which economies falter while key prices rise. That may not favor many sectors of the stock market, but probably would favor gold, possibly even in relation to more economically cyclical commodities.
As the 30 year yield Continuum clearly shows, we are off the trend of the last several decades (that trend, while not shown on the chart above, extended back to the early 1980s), and anyone pretending to define with 100% clarity what is in play right now is defining little more than ideology, bias or dogma. But by watching multiple signals like the three above and others, we can and will get a leg up on the probabilities out ahead. In fact, NFTRH has already had that leg up, since Q4, 2022 in this most recent, and though battered lately, unbroken ‘Goldilocks’ flavored market phase.
Look forward, not backward and here’s a word of advice to avoid automatic thinking in a macro environment that has changed so radically over the last year. The market’s signaling will guide. It’s just that now the signals can no longer be extrapolated along a continuum of what was, but what no longer is. It’s wide open, baby.
About the author
