Jerome Powell: “I think it’s pretty clear we’ve avoided a recession”
In response to a media member, who at Wednesday’s post-FOMC press conference, asked Jerome Powell if he thinks we’ve avoided the recession that everyone [read: the media and its obsession with the supposed negative indications of the former Yield Curve inversion] was talking about a couple of years ago, the Fed chief replied without missing a beat. Not only have we avoided a recession, but it’s “pretty clear“.
“Pretty Clear”? I don’t think so. At least not in the direction you indicate. It is clear to me that the macro continues to swing toward the counter-cyclical, recessionary “bust” end of the spectrum. Below are two indications toward that. There are many other negative signals in play as well. But it’s only one article and I’ll update the two I consider among the most important to my macro analysis.
Yield Curves
The mainstream financial media made a big deal about the supposed recessionary signals of the curve inversion, which we noted at the time was incorrect (it’s the subsequent steepening that lifts the bust side of the boom/bust seesaw), and humorously enough the media then gave the “all clear!” after the curve steepened and un-inverted. See…
“Bond Market Yield Curve Returns to Normal”? Signals for Gold, Stocks, Economy
Really Mr. Powell? How is it “pretty clear”? I’d like to know because I have two items below currently begging to differ with your view. There are plenty of others as well.
We’ll start with the 10yr-2yr Yield Curve, which has steepened as expected since the media’s big negative “inversion” hype campaign of 2022 into 2023. The flattening into inversion runs with the economic boom, the steepening that comes after runs with the bust. The 10-2 Yield Curve says it’s coming, as the steepening resumes just lately.
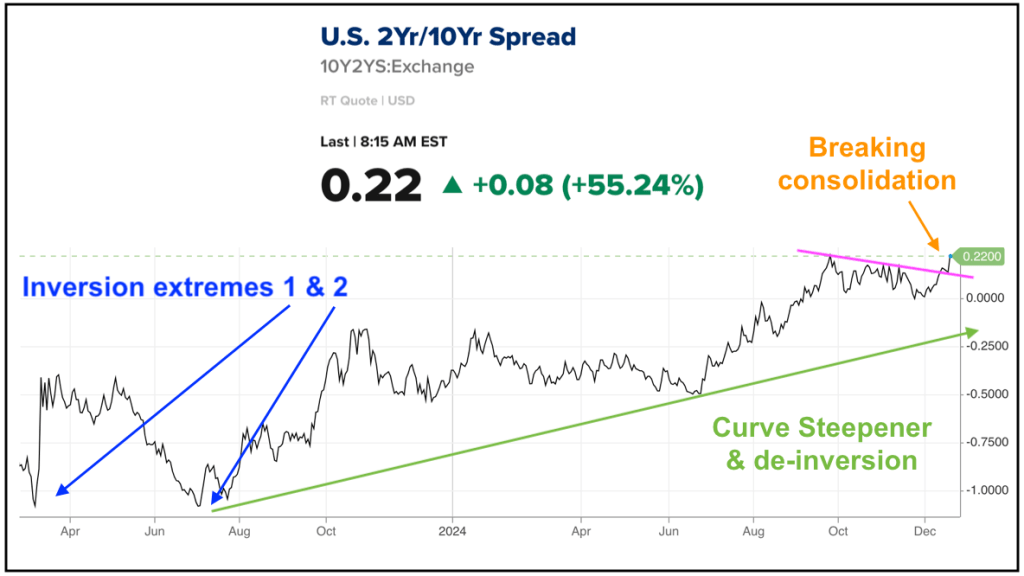 cnbc.com (my markups)
Dialing out to a wider macro view the last two primary bear markets began in conjunction with a new curve steepener (2000) and 11 months after a steepener began (2007). 2020 was a quick crash and reversal on steroidal inflationary policies by Fed and government. Hence, the inflationary curve steepener into 2021. Yield curves can steepen under either deflationary or inflationary conditions, with the key being whether nominal yields are falling (deflationary) or rising (inflationary).
Today we have an un-inverted Yield Curve steepening under alternating disinflationary and moderately inflationary pressure. Most recently, the signaling has been inflationary. Yesterday the Fed introduced some talk about inflation and put the brakes on the dove routine, at least for a bit.
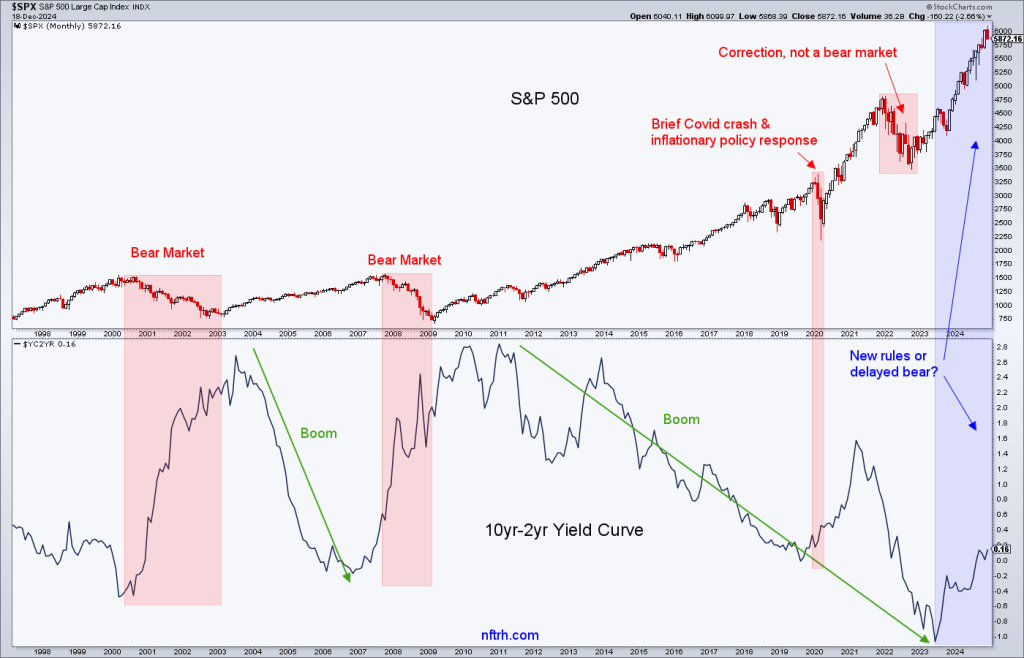
From an NFTRH+ update on Wednesday, before the FOMC release:
This FOMC day feels different than those we’ve had all year as the Fed leaned into its dovish stance with the diminishing of inflation signals and oh yes, the oncoming presidential election. This FOMC day comes post-election with the battle lost (by the democrats). I am not theorizing that the Fed and Biden admin (with former Fed chief Yellen in its side car at Treasury) conspired to create a stable macro into the election, but I am also not beyond believing that such politics can be played to some degree behind the scenes.
Long story short, Biden is done. Yellen is done. Long-term Treasury yields have been kicking upward, although they have not broken the flag on a monthly basis:
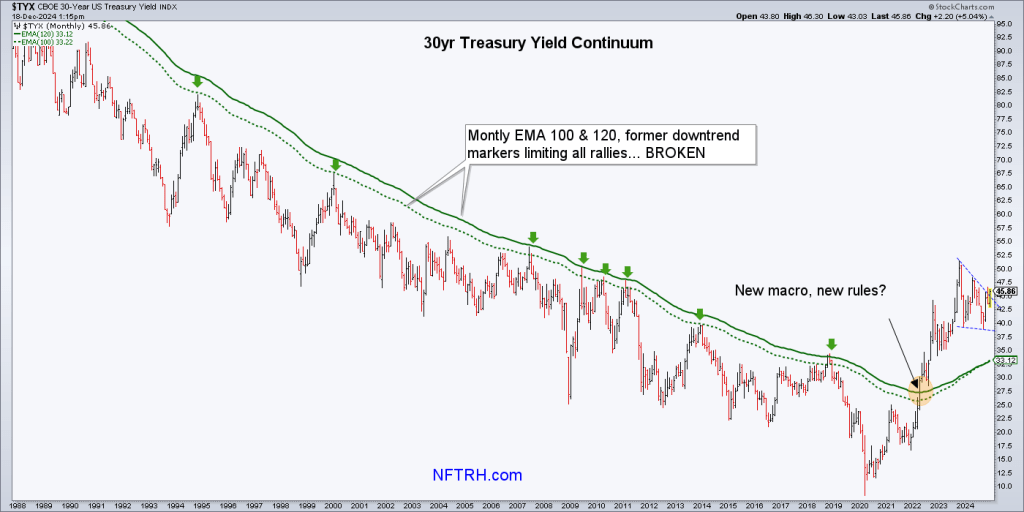
[Note that one day later the flag is breaking higher, still needing to close December that way for a breakout signal, but posturing bullish for the yield at this time]
Bottom Line
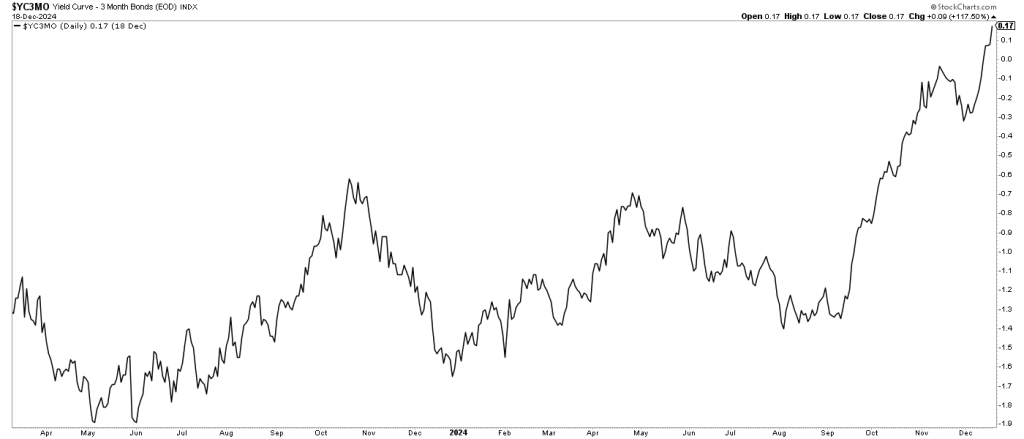
Yield curves are steepening and curve steepeners preceded the last two major bear markets. To boot, those claiming the steepener and de-inversion of the 10-2 was invalid because the 3 month curve was still inverted may want to reconsider that notion. As we have noted for months now, the 10yr-2yr was guiding the tardy 10yr-3mo upward. An economic bust signal is in play, with only its timing at issue.
Gold/Silver Ratio & USD
When gold leads silver (drops less than) and the US dollar is rising the indication can be anything from disinflationary Goldilocks to severe liquidity constraint in markets. Bob Hoye called the relationship between gold and silver a “metallic credit spread”, which is a great way to describe it. The Gold/Silver ratio (GSR) is the spread between a metal with less inflation sensitivity and less cyclicality/industrial use vs. a metal with more of those things. Hence, it is a counter-cyclical indication when rising.
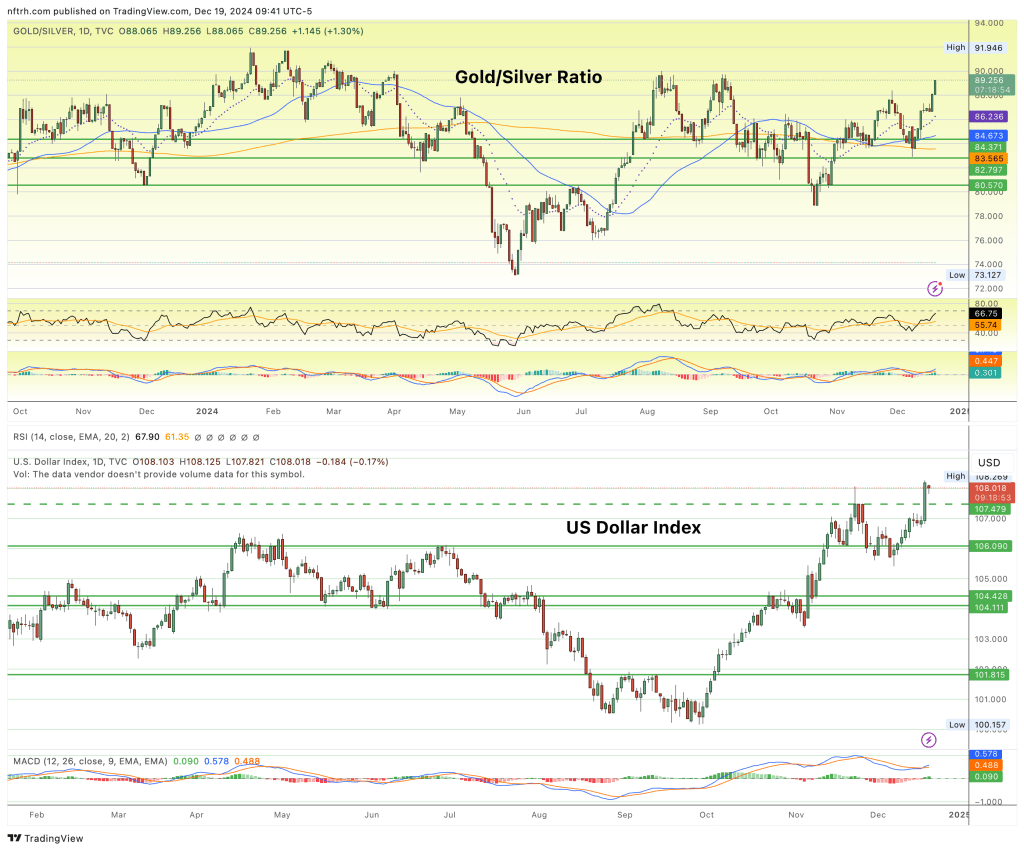
The GSR and USD oversaw bear markets and bear phases in 2000 (GSR rose while USD was rising toward a major top), 2008 (both GSR and USD ramped hard during the worst of the market destruction) and 2020 (GSR rose impulsively and USD merely continued its long-term bull market). Bad things tend to come with concurrent strength in these two, especially if the strength is impulsive.
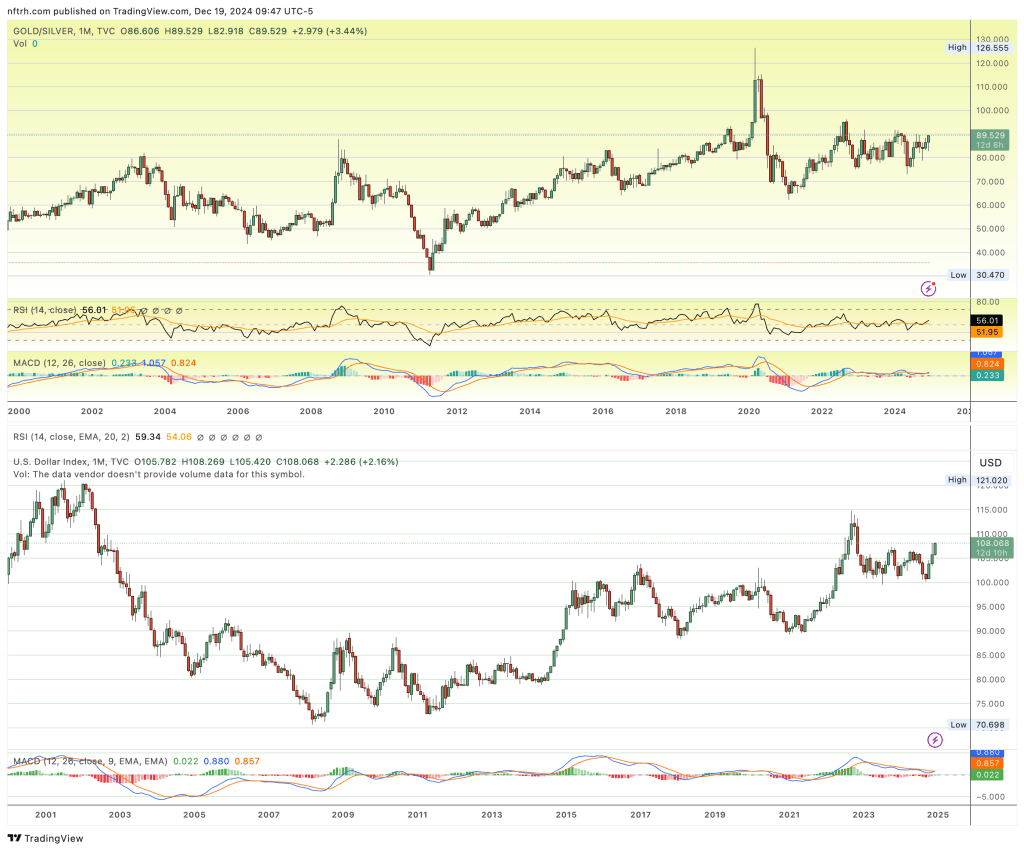
USD & GSR Bottom Line
While USD and GSR have not become impulsive yet, they are pointing in a northerly direction. USD is and has been bullish since October and the GSR has been going sideways with alternating negative and positive bias. Right now it is on a positive bias. If these two settle down, we can have a window for a year-end Santa party into 2025, including the precious metals and probably commodities. But if they hold firm or impulse up from here, people might want to accept the gains of 2024 and manage risk.
 2 Horsemen of the Liquidity Apocalypse
Bottom Line
Two indicators I consider primary to macro boom/bust signaling are forecasting an oncoming bust and market liquidity contraction, respectively. These indicators are not necessarily good timers, but they are conditions that will likely be in effect when the next economic bust and market liquidity problems manifest. NFTRH had properly remained bull biased all year long for reasons beyond the scope of this article. But markets go both ways and the above and other indicators will keep us on the right side of things, no matter which way the go.
There is a lot of energy in the markets right now, at a time that is usually bullish. So we can be open to resumed bull activity in the short-term. But we most definitely have not clearly “avoided a recession”, and the markets are indicated to go bearish before long.
For “best of breed” top down analysis of all major markets, subscribe to NFTRH Premium, which includes an in-depth weekly market report, detailed market updates and NFTRH+ dynamic updates and chart/trade setup ideas. You can easily subscribe by Credit Card or PayPal (see all info and options). Keep up to date with actionable public content at NFTRH.com by using the email form on the right sidebar, or take it to another (intermediate) level with our free eLetter. Follow via Twitter@NFTRHgt.

