
Last weekend, I questioned whether a crash can still set up for much later this year? And, the answer is, "of course." This week, I question the opposite - that is, can we still get to the all-time high? And, the answer is also "of course."
Now, I have probably confused most of you reading the opening paragraph. But, I will explain my point below, and I do not need to utilize Talmudic logic to provide the explanation.
But, before I provide my explanation, I want to again address a few fallacies that I read this past week.
First, we have all heard that the premise that the stock market is "forward-looking," which is why many believe the market is a leading indicator for the economy. And, in order to believe this premise, one has to accept an underlying premise that the stock market or the investor community is somewhat omniscient or clairvoyant to be able to foresee the future. I do not subscribe to such premises. Rather, in the past, I have outlined a much more reasonable premise as to why the market leads all other indicators and have quoted it in my last article, which you can read here:
Sentiment Speaks: Is The Market Disconnected From Reality, Or Are You?
But, last week, I read an article which not only turned this premise on its head but which also argued that the market is "disconnected" because it has not been following a long-standing correlation.
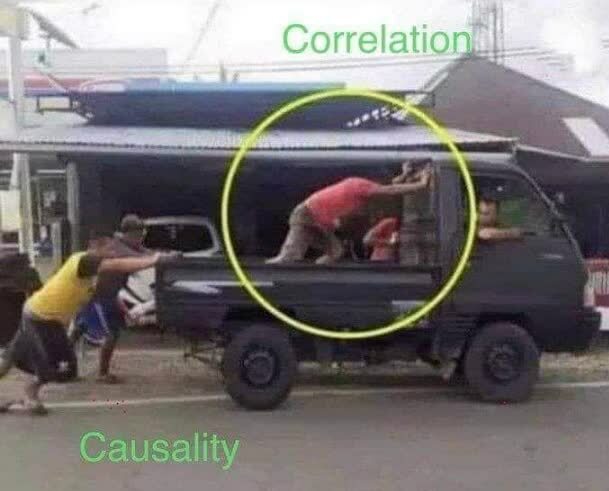
So, first, I would like to address the correlation argument. This is something I discuss with my clients and subscribers all the time.
When we see two different charts moving in the same direction, we automatically assume some relationship. Or, if we see two different charts moving in the exact opposite directions, we also automatically assume some relationship. Unfortunately, this is a major mistake made by most market participants.
@eairoldi and @erikbryn
You see, each chart moves in its own "pattern." For example, one chart may be rallying in a 3rd wave (Elliott Wave technical term, which is a 3rd wave out of a 5-wave structure), whereas another chart may be rallying in a c-wave (Elliott Wave technical term, which is a 3rd wave in a 3-wave corrective structure). Therefore, when each of them completes their respective rally structure, both will pull back together. Yet, the difference will come with the first chart then rallying higher after the pullback completes, whereas the 2nd chart may provide an initial "bounce," it will then diverge from the first chart and continue much lower, thereby breaking the seeming correlation.
And, when you are able to understand the individual patterns for each chart, you really have no need for seeming correlations. Moreover, understanding each chart on its own will allow you to even predict when the seeming correlations will break. And, I have done this many times throughout my career.
In fact, I wrote an analysis in the middle of 2016, outlining my expectations for a breakdown of a number of the seeming correlations that many followed to that point. And, the basis of my analysis was the underlying chart patterns that were set up to begin diverging. Then, one of my subscribers forwarded me this article in early 2017 after the breakdowns had begun, with just a smile in the body of his message:
Morgan Stanley: "We Haven't Seen A Shift This Severe In Over A Decade" (subscription required)
So, when I hear others write about how surprised they are about some seeming correlation breaking, well, the reason is that they are only looking at the market from a very superficial perspective.
And, if you still believe in correlations, then I suggest you train more pirates so that we can finally deal with global warming.
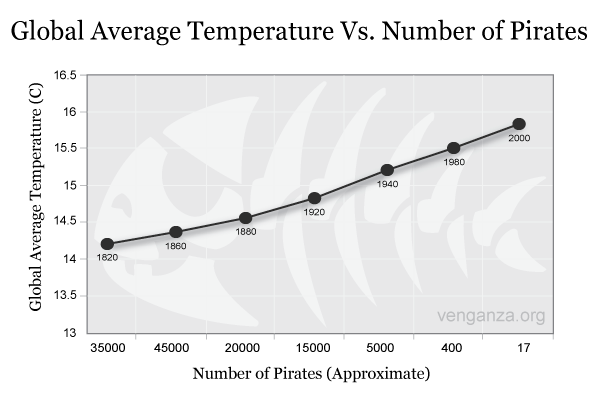
venganza.org
This now brings me to the second point I wanted to make about the market being "forward-looking." And, in this particular article I read, the argument presented was that the market really is not forward-looking because it did not take into account what the author deemed important.
Ladies and gentlemen, one cannot impose one's own perspective upon the market and then make a straw-man argument based upon that perspective. Too many in the media assign what they believe to be the reason why a market is moving in one direction or another. And, if we are being honest with ourselves, we must recognize that they are simply blowing hot air.
There is no way one can know why a market moved in one direction or another unless you poll each and every person who bought and sold that day, and asked them why they engaged in their specific buy/sell action. To believe that you "know" the specific reason why someone does something in the market is the height of hubris. To then base an argument upon that perspective is just silly.
So, when I read an article that explains to me that the market really did not take X into account but was more focused on Y, well, it tells me that the author is attempting to impose their own judgements and assessments upon the market. Moreover, when that author makes this attempt to explain why the market is wrong and moving in the opposite direction of their expectation, it only bolsters my view of their "analysis."
As human beings, we have a desire to be in control. And, we believe we are in control of the markets when we think we can come up with a reason as to why the market moves in one way or another. But, this brings me to another opportunity I can present the wise words of Robert Prechter from one of the best books I have ever read on the market - The Socionomic Theory of Finance (which will change your entire view of how markets really work):
"Observers' job, as they see it, is simply to identify which external events caused whatever price changes occur. When news seems to coincide sensibly with market movement, they presume a causal relationship. When news doesn't fit, they attempt to devise a cause-and-effect structure to make it fit. When they cannot even devise a plausible way to twist the news into justifying market action, they chalk up the market moves to "psychology," which means that, despite a plethora of news and numerous inventive ways to interpret it, their imaginations aren't prodigious enough to concoct a credible causal story.
Most of the time it is easy for observers to believe in news causality. Financial markets fluctuate constantly, and news comes out constantly, and sometimes the two elements coincide well enough to reinforce commentators' mental bias towards mechanical cause and effect. When news and the market fail to coincide, they shrug and disregard the inconsistency. Those operating under the mechanics paradigm in finance never seem to see or care that these glaring anomalies exist."
As far as the market is concerned, I am taking a step back and going to just give you a bigger picture view. I will need to see a breakdown below the 4450SPX region in order to make an assessment of the next major multi-month trending move in the market. Should that break down be impulsive in nature (5 wave downside structure), then it can set up a market crash for later this year. However, if that pullback is clearly corrective in nature, then I will be preparing for the market to head up next to the 4800SPX region.
In the smaller degree, as long as we remain over support of 4485-4515SPX, then our next resistance overhead is 4615-4647SPX. And, one way or another, either from the top we struck this past week, or from a top struck at that next resistance, I am expecting a breakdown below 4450SPX from these points in order to make a determination as to the next multi-month trending move.
About the author
