
Over the last few months, we have written several articles outlining our views of banks in general. We explained the relationship that you, as a depositor, have with your bank is in line with a debtor/creditor relationship. This places you in a precarious position should the bank encounter financial or liquidity issues. Moreover, we also outlined why reliance on the FDIC may not be wholly advisable. And, finally, we explained that the next time there is a financial meltdown, your deposits may be turned into equity to assist the bank in reorganizing.
So, at the end of the day, it behooves you, as a depositor, to seek out the strongest banks you can find, and to avoid banks which have questionable stability.
While we outlined in our last articles the potential pitfalls we foresee with regard to various banks in the foreseeable future, we have not provided you with a deeper understanding as to why we see the larger banks as having questionable stability. Over the coming months, we intend to publish articles outlining our views on this matter.
First, we want to explain the process with which we review the stability of a bank.
We focus on four main categories which are crucial to any bank’s operating performance. These are: 1) Balance Sheet Strength; 2) Margins and Cost Efficiency; 3) Asset Quality; 4) Capital and Profitability. Each of these four categories is divided into five subcategories, and then a score ranging from 1-5 is assigned for each of these 20 sub-categories:
If a bank looks much better than the peer group in the sub-category, it receives a score of 5.
If a bank looks better than the peer group in the sub-category, it receives a score of 4.
If a bank looks in-line with the peer group in the sub-category, it receives a score of 3.
If a bank looks worse than the peer group in the sub-category, it receives a score of 2.
If a bank looks much worse than the peer group in the sub-category, it receives a score of 1.
Afterwards, we add up all the scores to get our total rating score. To make our analysis objective and straightforward, all the scores are equally weighted. As a result, an ideal bank gets 100 points, an average one 60 points, and a bad one 20 points.
If you would like to read more detail on our process for evaluating a bank, feel free to read it here:
Our Methodology & Ranking System: Banks - SaferBankingResearch
But, there also are certain “gate-keeping” issues which a bank must overcome before we even score that particular bank. And, many banks present “red flags,” which cause us to shy away from even considering them in our ranking system.
As mentioned before, it's difficult to overestimate the importance of a deeper analysis when it comes to choosing a really strong and safe bank. There are quite a lot of red flags to which many retail depositors may not pay attention, especially in a stable market environment. However, those red flags are likely to lead to major issues in a volatile environment. Below we highlight some of the key issues that we are currently seeing when we take a closer look at Capital One Bank (NYSE:COF).
Credit Card business: Rising delinquencies and above-average exposure to subprime borrowers
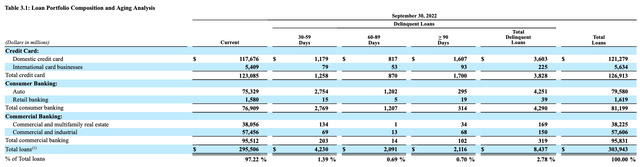
Credit Card business is the largest segment of Capital One’s portfolio as it represented 42% of the bank’s total loans as of the end of 9M22. Domestic credit cards corresponded to 96% of the segment’s outstanding loans.
Company Data
Source: Company data
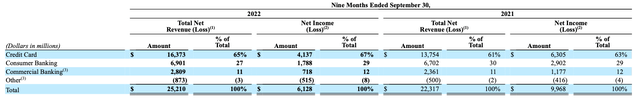
This business also is the largest contributor to COF’s P&L. For the nine months of the year, it generated 65% of the bank’s total revenue and 67% of net income, above 61% and 63% respectively for the nine months of 2021.
Company Data
Source: Company data
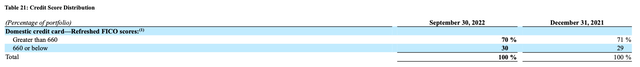
COF provides a limited breakdown of its credit score distribution for the card business as the bank discloses only two categories: “FICO of greater than 660” and "FICO of 660 or below."
Company Data
Source: Company data
However, even this limited disclosure suggests that COF has above-average exposure to subprime borrowers, given that, according to the latest available data, the national average FICO score is 716. This implies that at least 30% of COF’s credit card holders have a FICO of lower than the average of the sector. Obviously, some borrowers that are recorded in the “Greater than 660” category also have a FICO of below 716.
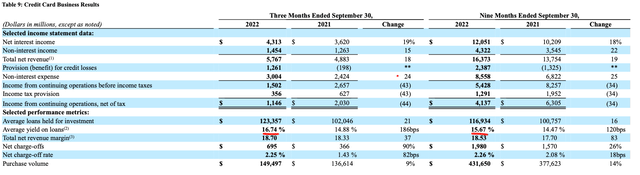
The average blended yield of COF’s credit card segment is also quite high. It was 15.67% for 9M22 and 16.74% for 3Q22, up by 120 bps YoY and 186 bps YoY, respectively.
Company Data
Source: Company data
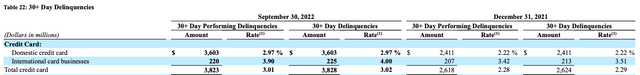
Rising delinquencies is another factor that would lead to serious issues for the bank in a systemic crisis environment. As the table below shows, the credit cards’ 30-plus day delinquency ratio rose from 2.29% as of the end of 2021 to 3.02% as of the end of 9M22. This is quite a high increase given that the current stage of the cycle is still not that bad for credit card issuers. Without a doubt, a rise in delinquencies would be much higher a crisis environment.
Company Data
Source: Company data
Auto Loans segment looks even worse than Credit Card Business from a credit quality perspective
Capital One is viewed by many as a monoliner focused on credit cards. However, the bank also has exposure to car loans. COF includes auto lending in the segment “Consumer Banking”; however, 98% of the segment’s portfolio are car loans.
As of the end of 9M22, Consumer Banking business represented 26% of the total bank’s credit portfolio. For the 9M22, the segment generated 27% of the bank’s total revenue and 29% of its total net income, compared to 30% and 29% for 9M21, respectively.
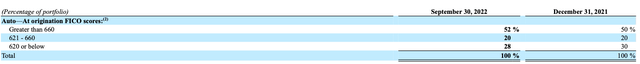
While COF disclosed two categories of FICO distribution for credit cards, it provides three categories for auto loans: “Greater than 660”, “621-660," and “620 or below."
Company Data
Source: Company data
As mentioned earlier, the national average FICO is 716. The disclosure provided by COF suggests that at least 48% of borrowers have a FICO of lower than then the national average, and 28% of borrowers are subprime ones. This implies that the average FICO of COF’s auto loans is even worse than that of credit cards.
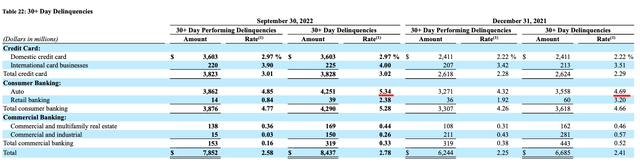
Unsurprisingly, such a weak FICO of COF’s auto loans already has resulted in a rise of delinquencies. As the table below shows, auto loans’ 30 day-plus delinquency ratio was already 5.34% as of 9M22, up 65 bps YTD. Given a negative outlook for auto lending, especially used car loans, COF is likely to face significant credit issues on this part of its book even in the near-term. Obviously, the issues would be much worse in a recessionary environment.
Company Data
Source: Company data
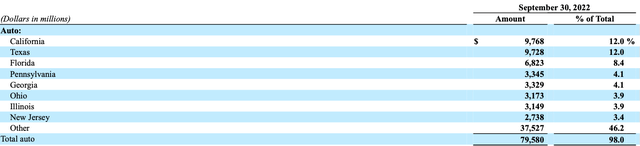
It's also worth mentioning a geographical breakdown of COF’s auto lending. As shown, Georgia has the fifth-highest share. At the same time, Georgia has the second-highest percentage of residents with 70% or greater revolving utilization. According to a report provided by the FICO, the higher the percentage of available revolving credit being utilized by a consumer, the greater their risk of defaulting on a credit obligation in the future. This suggests that COF’s auto book is also risky from a geographical breakdown perspective.
Company Data
Source: Company data
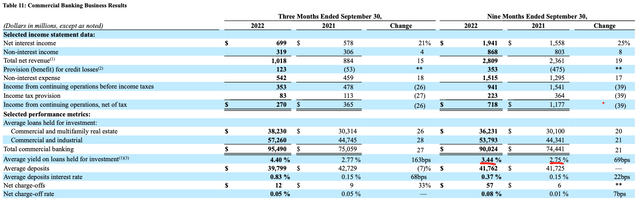
8.5% of commercial and multifamily real estate book has signs of credit quality issues
Another part of COF’s credit business is commercial lending, which is even larger than its auto book based on total outstanding loans. Commercial lending represented 32% of COF’s credit portfolio as of 9M22. However, its contribution to the bank’s P&L is smaller compared to auto lending. For 9M22, the segment generated 11% of the bank’s total revenue and 12% of its total net income, both figures are unchanged compared to the respective ones for 9M21.
The segment’s low contribution to both the bank’s revenue and net income is mostly due to lower lending rates. As shown below, the average blended loan yield for 9M22 was 3.44%, much below than the average blended yield of credit cards, which was 15.67%, and lower than that of car lending, which was a bit higher than 7% for the same time period.
Company Data
Source: Company data
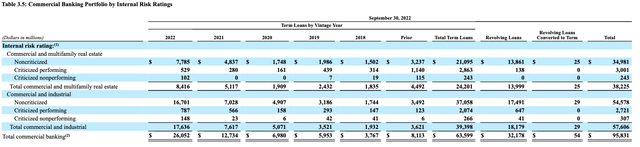
Such a low rate on COF’s commercial loans suggests that the segment should look excellent from a credit quality perspective. However, a breakdown of the commercial book based on the bank’s own rating system shows that if we sum up “criticized performing loans” and “criticized nonperforming loans,” then 8.5% of commercial and multifamily real estate book have signs of credit quality issues. COF defines criticized performing loans as “loans in which the financial condition of the obligor is stressed, affecting earnings, cash flows or collateral values,” and criticized nonperforming loans are defined as “loans that are not adequately protected by the current net worth and paying capacity of the obligor or the collateral pledged.” In other words, the share of problem loans in this segment is as high as 8.5%.
Company Data
Source: Company data
If we look at the bank’s commercial & industrial book, then criticized performing loans and criticized nonperforming loans together correspond to 5.3% of the portfolio, which is also quite high, although lower than the respective metric of the bank’s commercial and multifamily real estate book. Even in this environment, which is still relatively benign for commercial lending, COF has such a high share of problem loans. Obviously, this share would spike should a major recession come.
Ongoing repricing of deposits will lead to a sharp spike in funding costs
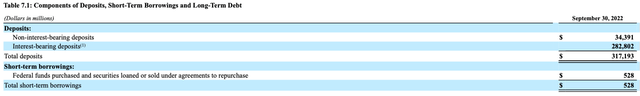
Almost 90% of COF’s deposit are interest-bearing, and 82% of the bank’s total deposit book are retail deposits.
Company Data
Source: Company data
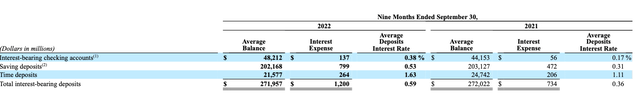
It's interesting that COF’s average blended deposit rates are still very low. For the nine months of the year, the average rates on interest-bearing checking accounts, savings deposits and time deposits were 0.38 % (+21 bps YoY), 0.53% (+22 bps YoY) and 1.63% (up 52 bps YoY) respectively. As a result, the bank’s total deposit cost was just 0.59% (up +23 bps YoY).
Company Data
Source: Company data
Given that COF currently offers a 4% rate on 12-month CDs, its funding cost will rise significantly over the next several quarters due to a deposit re-pricing. The key factor here is that banks with a focus on online/digital deposit attraction, such as COF, have the highest deposit betas in the sector. As a reminder, this ratio shows how much of the increase in interest rates banks expect they will pass on to depositors. Online/digital banks have to pass on the largest part of the Fed’s rate increases to its clients compared to other banks. This is especially relevant for COF given that the bank had a loan-to-deposit of 96% as of the end of 9M22, which is quite high and underpins the fact that COF has to offer higher deposit rates to keep its funding base. Otherwise, the bank is very likely to face liquidity issues, and have to attract more wholesale funding, which is both more expensive and more volatile.
There's a significant maturity mismatch due to long duration bonds on the balance sheet
As of 9M22, the amortized cost of COF’s securities portfolio was $87B. The bank’s unrealized loss from securities was $11B, and, as a result, fair value of the book was $75B. Based on the amortized cost, 84% of the bank’s portfolio were RMBS (residential mortgage-backed securities).
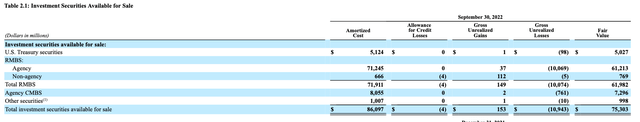
Company Data
Source: Company data
The major issue here is that majority of COF’s bonds have long duration. As the table below shows, 84% of the bank’s securities have maturities of than 10 years.
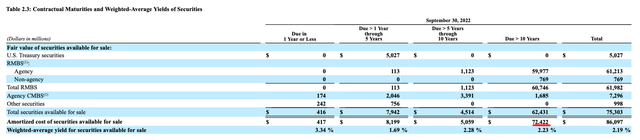
Company Data
Source: Company data
Longer-duration bonds are very sensitive to changes in the market yields, and for 9M22, COF has already recorded an unrealized loss of $10B from its securities portfolio. Even the larger issue here is that the bank’s long duration bonds are largely funded by retail deposits. COF does not disclose average maturity of its deposit book; however, it's highly likely that it is much less than 10 years, especially given that COF currently does not offer deposits with a term of more than five years. Such a maturity mismatch between the bank’s assets and liabilities would likely lead to major liquidity issues in a crisis environment.
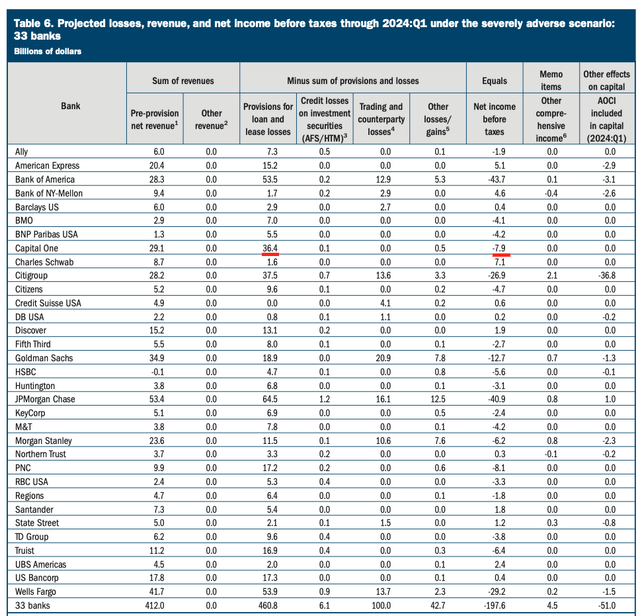
The 2022 Fed stress tests suggest a 18% capital loss
In June, the Fed published stress-test results for 33 U.S banks. As shown below, under the severely adverse scenario COF posted a net loss of $7.9B or 18% of the bank’s CET1 capital as of the end of 9M22. With that being said, as we noted before in our articles, the Fed’s assumptions for its severely adverse scenario are quite mild, in our view.
The Fed
Source: The Fed
The bottom line
In contrast to Capital One, the Top-15 U.S banks we have found at Saferbankingresearch.com have very low exposure to credit cards, other unsecured retail loans, and car loans, while quality of their credit portfolios are much better compared to COF. The banks we have identified also have shares of longer duration bonds, and liquid balance sheets with loan-to-deposit ratios well below of COF. Moreover, COF has more red flags, which we did not discuss in detail due to the limitations of the article, such as its subpar operational efficiency, which looks especially weak for an online-focused bank. By comparison, all our Top-15 banks have very efficient business modes.
So, we strongly urge caution for those that choose to deposit their money in Capital One Bank.
About the author
