
- With gold consolidating in the $2000 area, tomorrow’s Fed decision is likely the catalyst for the next move…
- Which could be a surge towards the $2080 highs!
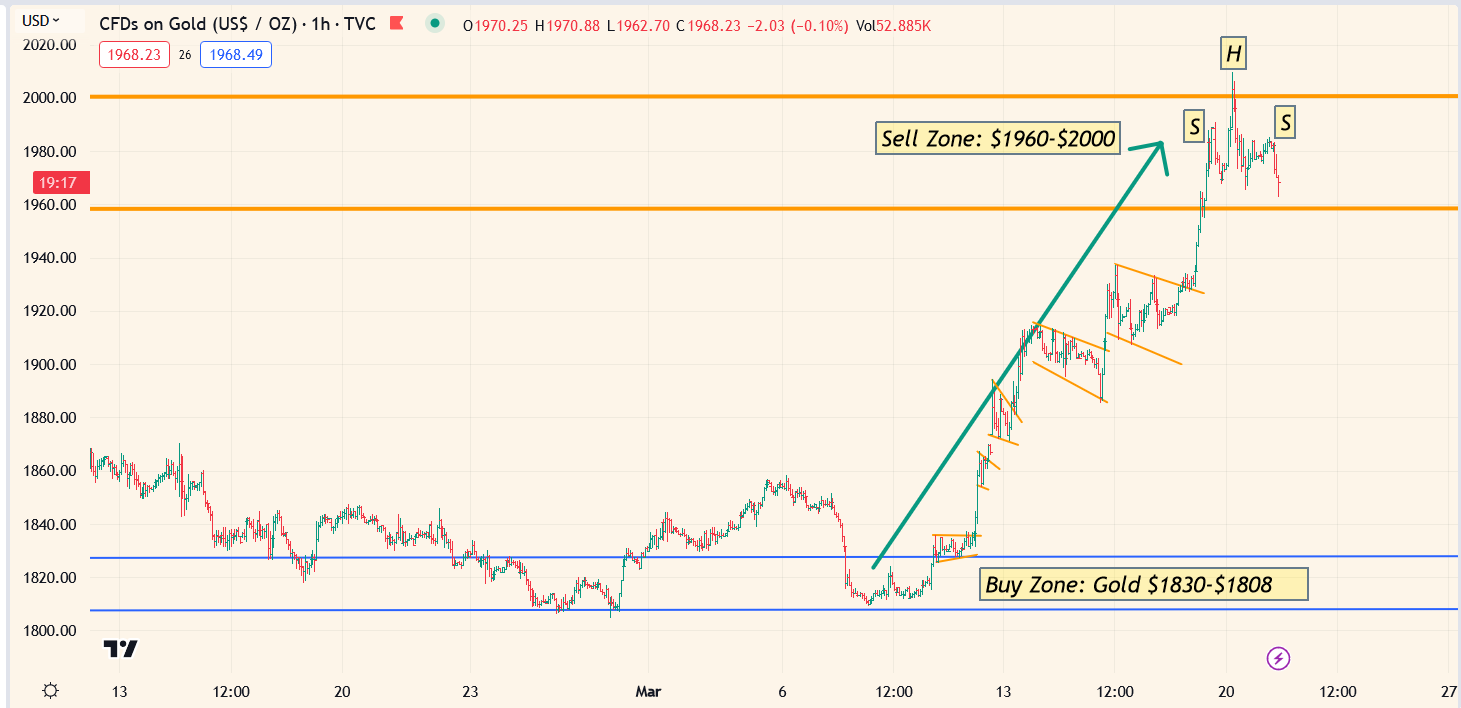 Click to enlarge this short-term chart. As the mark to model bank accounting albatross finally came home to roost, my $1808 buy zone turned into a key launchpad for the metals and miners.
- The $1960-$2000 sell zone was hit very quickly.
- What’s next for gold from here? Well, for a look at the daily chart for gold, please click here now. Double-click to enlarge. There are amber lights all over this chart; RSI and Stochastics are both overbought, and gold is far above the 618MA. There’s also trendline and round number ($2000) resistance in play.
- Clearly, profit booking is a solid plan of action right now, given the imminent Fed announcement and technical state of the daily gold chart.
- Having said that, I’ll dare to suggest the profit booking should be modest, and that’s because of the stunning action occurring on the weekly chart.
- To view it, please click here now. Double-click to enlarge. The $2000 area is obviously major resistance but the action of my key 14,5,5 Stochastics oscillator (in the momentum zone of 50) suggests investors need to consider a scenario… where gold is about to surge to $2080, $2200, or even $2500.
- Gold is consolidating sideways in a rough $400 rectangular range trade between $2000 and $1600. Basis the Edwards & Magee technical analysis handbook, the rectangle formation has roughly a 67% chance of breaking out in the direction of the existing trend…
- Which has been up since the $1167 low.
- What about the US stock market? Please click here now. Double-click to enlarge. In the short and medium term, the market is oversold. A rally seems imminent.
- Since the 2008 OTC derivatives fiasco, the US stock market has morphed from a solid leading indicator for the economy, to a macabre soup kitchen for a new class of welfare bum; the stock market investors of America.
- Events like the destruction of the average citizen’s purchasing power are celebrated as huge buy signals for stocks.
- The central bank then prints massive amounts of fiat, not to help the citizens, but to generate another rally for stock and bond market investors!
- A daily focus on the big picture is critical for investors as inflation, the 2021-2025 war cycle, a wildly overvalued stock market, and empire transition dominate the investing landscape. I cover this big picture 5-6 times a week in my flagship Galactic Updates newsletter. At $199/year, investors feel the price is too low, but I’m offering a $179/15mths “super special” that investors can use to get in on the action, or to extend their existing subscription. Click this link to get the offer or send me an email and I’ll get you a payment link. Thanks!
- What about real estate? In the medium term, it’s likely to be relatively stable. Real estate brokers are offering lower rate mortgages to entice buyers, and as failed stock market investors race to the “safe haven” bond market, rates fall.
- Please click here now. Double-click to enlarge this long-term bond chart. Ultimately, stock market investors will realize they’ve jumped out of a stock market fry pan and into an end of empire US government bond market fire.
- For another look at the same chart, please click here now. Double-click to enlarge. It can be argued that a US bond market “super top” has been forming since 2011.
- The bottom line: When empires die, their currencies collapse, and they hike rates to try to put out the fire. That makes the situation worse because the economy struggles and global investors shy away.
- I’ve urged gold bugs to play the “long game”; the banking system is corrupt and failing, but it’s a slow-motion train wreck that could take one or two decades to reach the fireball stage.
- Gold stocks will become the go-to asset for money managers, but the road to that “honey pot” is paved with as much molasses as it is with gold. A significant amount of investor patience is required.
- Please click here now. Double-click to enlarge this daily GDX chart. I targeted a gain of 10% for GDX from the buy zone of gold $1808.
- I usually project a 20% gain (or more) for GDX from my buy zones, but this buy zone was “Grade C” quality, and the banking crisis created a rush to the safety of gold bullion rather than to the miners.
- For a look at the weekly chart, please click here now. Double-click to enlarge. Note the action of the 14,5,5 Stochastics oscillator at the bottom of the chart. It’s in sync with the weekly gold chart. Once the Fed meet is in the rear-view mirror, a rally to $33, and then $40, may be in the cards!
Thanks!
Cheers
St
About the author
