
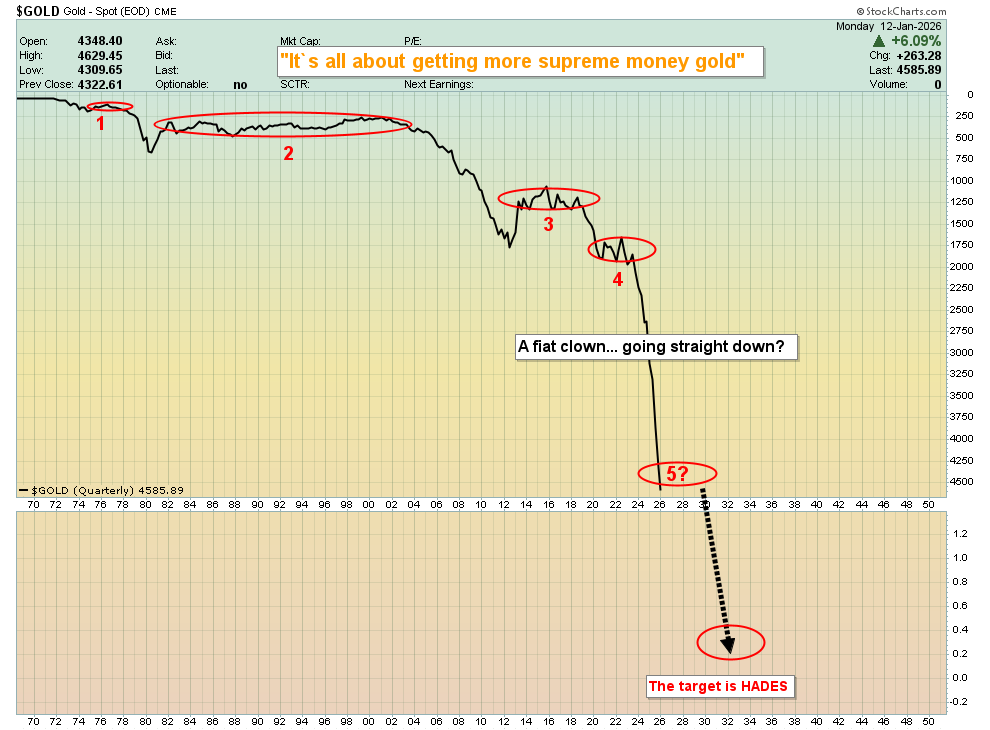
- Big round numbers are in play, and in that regard, one question for investors to consider is this: Could gold hit $5000 while the Dow hits 50,000 and silver hits $100? It seems likely, and gold stock enthusiasts may also want to note that GDX is also closing in on the $100 marker.
- Does this mean that red-hot geopolitical action is reaching a crescendo, and a significant lull will soon occur?
- Well, nothing goes up in a straight line forever, but what about… straight down? Please click here now. Click to enlarge this “Death of the Dollar.” Clearly, investors (and regular citizens) need to focus on getting more gold rather than more dying fiat.
- For somebody just starting out, a 10% allocation is probably enough, and from there, significant dips in the price can be bought until the allocation reaches the 20% marker.
- At that point, additional items like silver and mining stocks can be added to the mix. The key is to seek an allocation that allows the investor to remain emotionally stable during extended periods of disappointing price action.
- That allocation should vary from one investor to another… and sometimes quite dramatically.
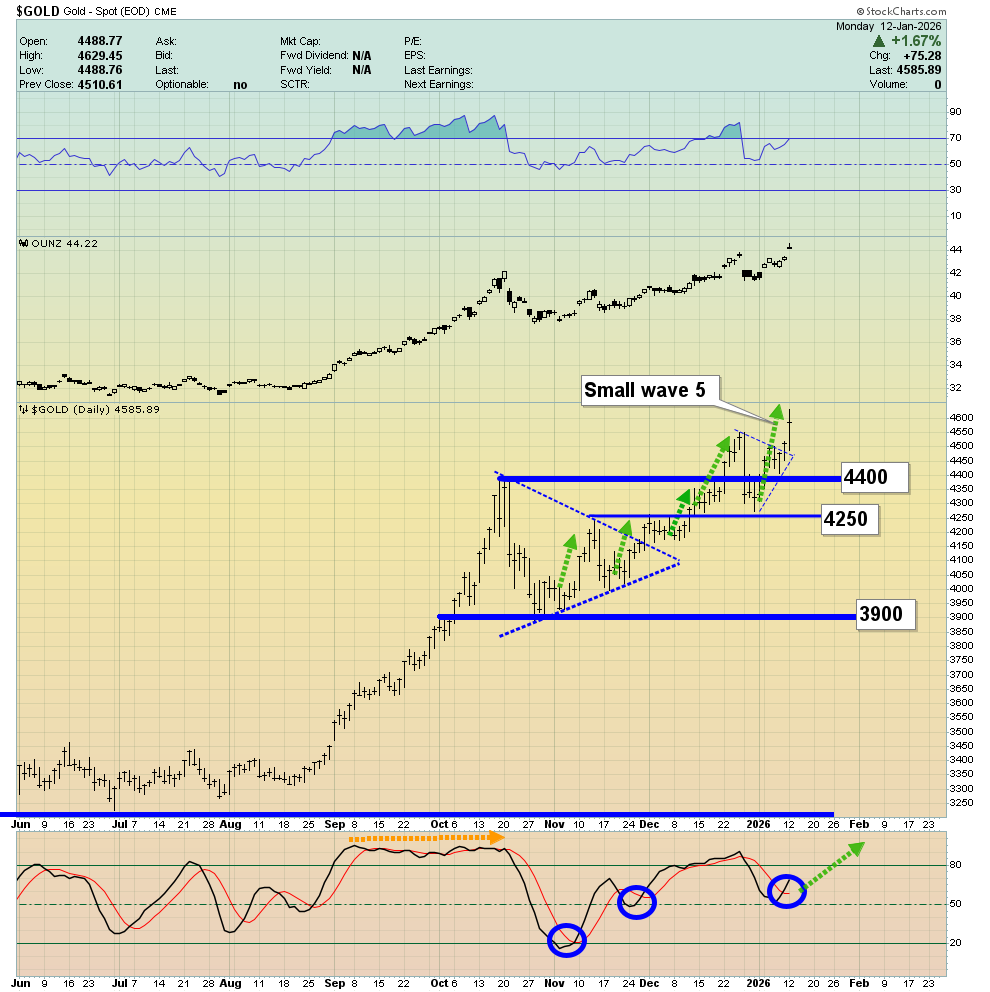
- Please click here now. Click to enlarge this daily chart for gold. The positive action continues. Note the fresh buy signal in the momentum zone for Stochastics.
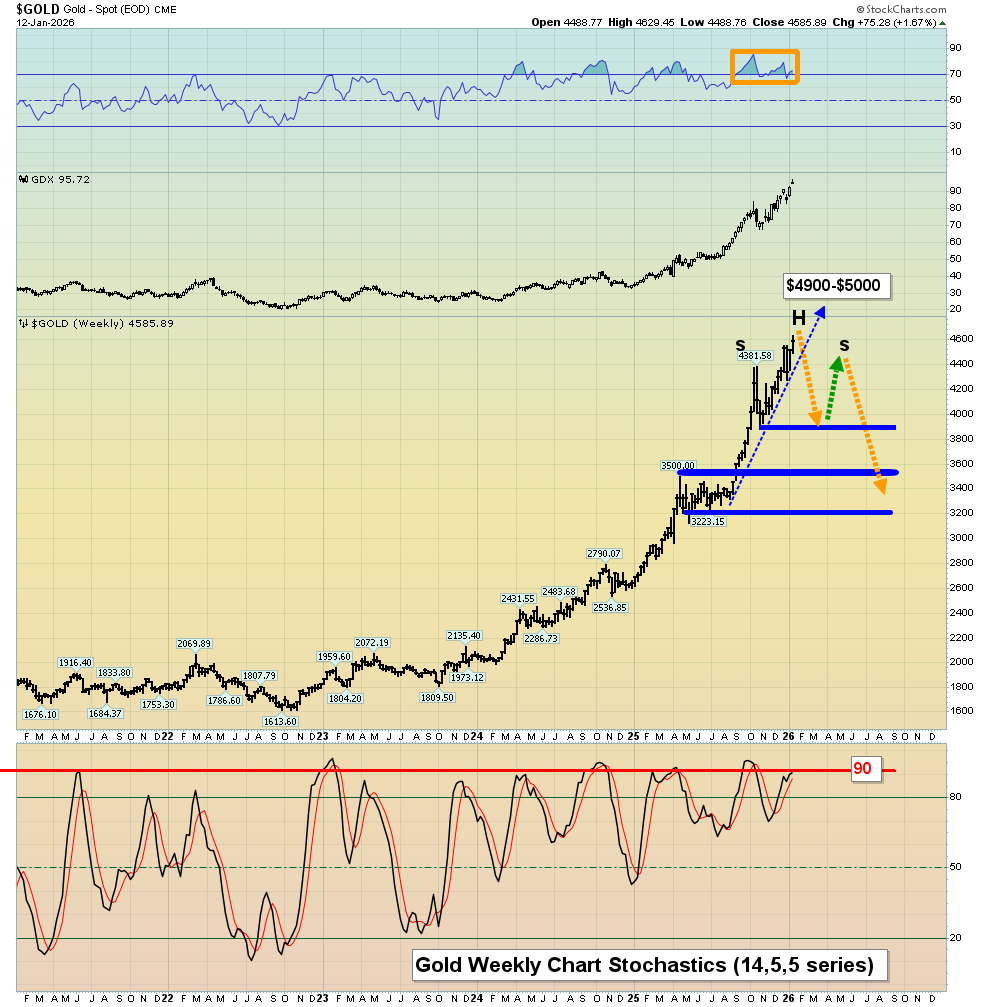
- For a look at the weekly chart, please click here now. Click to enlarge. If gold is to experience a significant correction, it will likely play out something like this.
- Investors who bought at much lower prices many years ago could consider selling 30% of their holdings, which is what I’ve done.
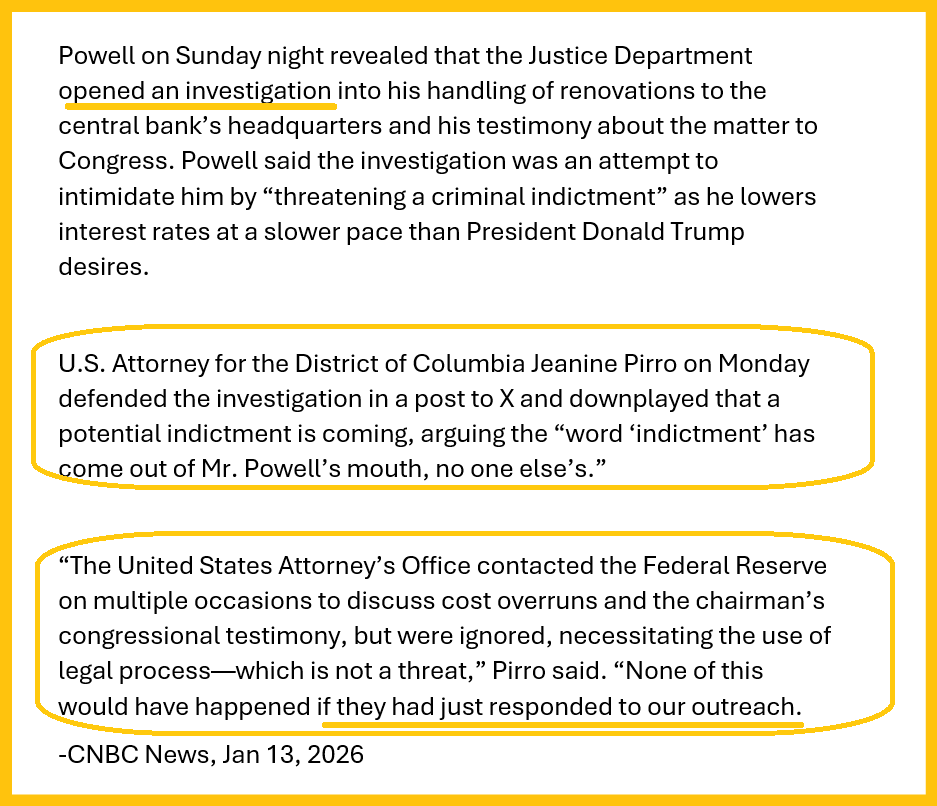
- For more insight into the gold market, please click here now. Click to enlarge. The DOJ probably should open a criminal investigation (and indictment) into both the Fed and the Treasury… for their promotion of fiat as money instead of gold.
- Regardless, with both these entities committed to fiat, a 70% allocation to gold, silver, and miners gives investors plenty of potential upside reward… and the flexibility to buy any significant sales in the price.
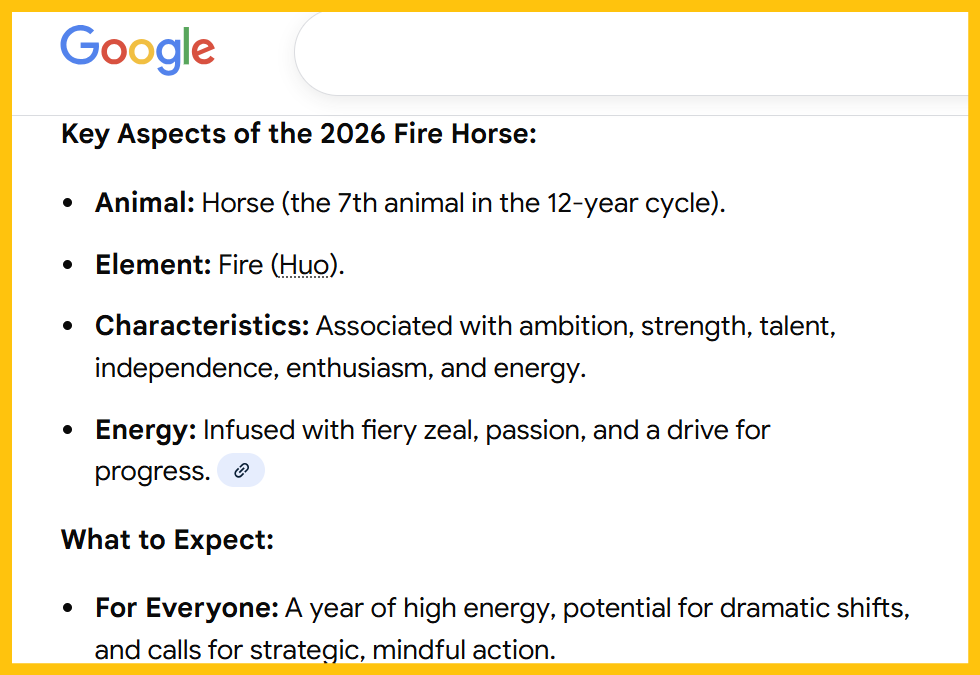
- Please click here now. Click to enlarge. In the Chinese zodiac, last year was the year of the snake (think tariff taxes), and this year is the year of the flaming horse, which can be interpreted as citizens fighting for freedom.
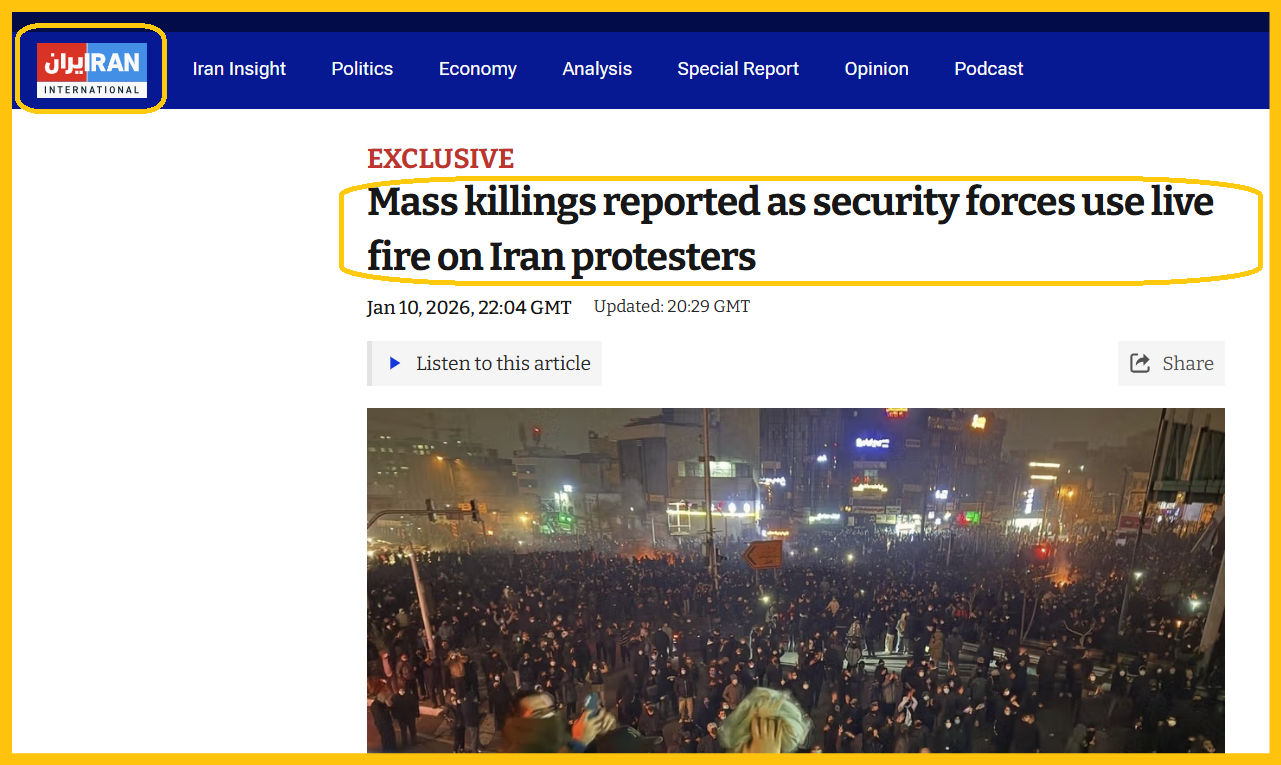
- Please click here now. Click to enlarge. The fight for freedom in Iran, Cuba, and Venezuela could continue for many years. An initial peak in the action is probably just a few months away, and it is highly likely to coincide with an intermediate peak in the fiat price of gold.
- I’ve suggested the most likely time for that to occur is in the month of April. For the past year, I’ve called that the most likely time for the event, and nothing has changed since then.
- How will it affect the miners? That’s a great question, and for some key insight, please click here now. Click to enlarge this spectacular CDNX daily chart, which is a key indicator not just for the juniors, but for all the miners.
- As good as this chart looks, it only tells one small part of the big bull era story for mining stocks, and on that note…
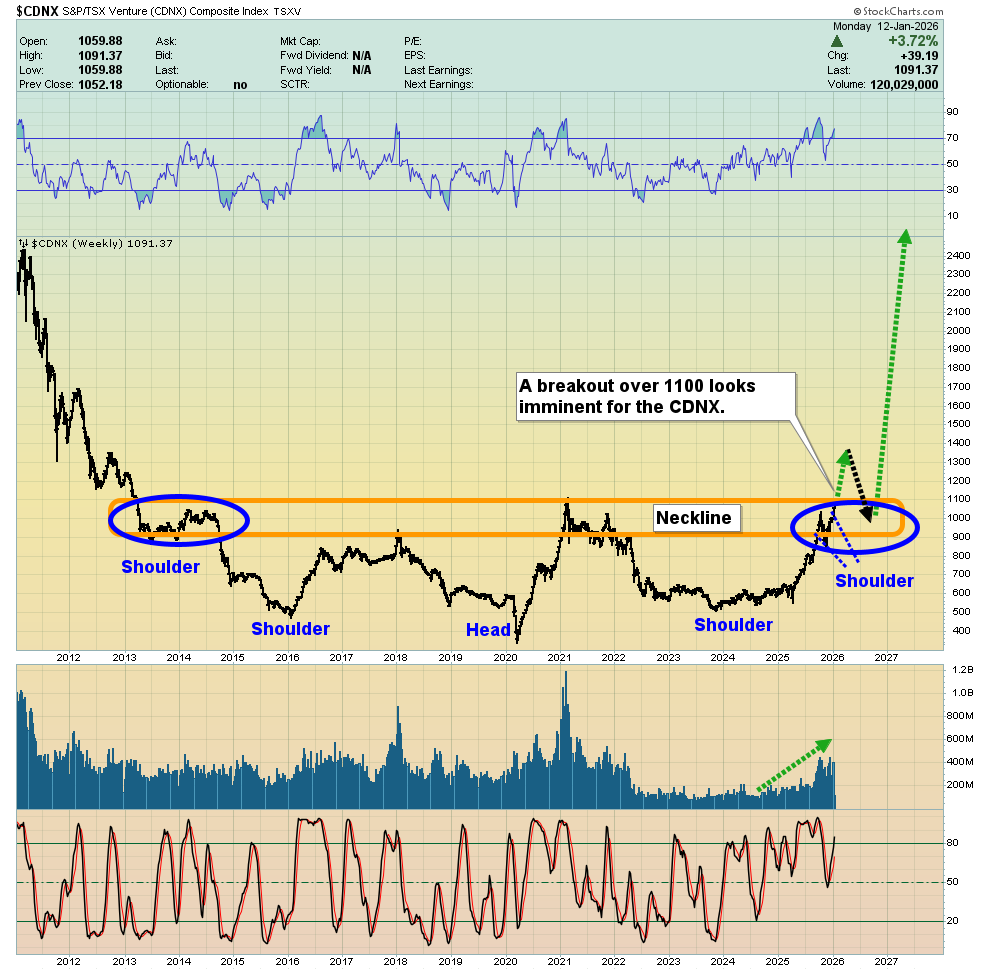
- Please click here now. Click to enlarge this long-term weekly chart. I urged investors to be patient until 2024. That was when the trading volume began to rise with the price.
- It now looks like the junior miners are poised for what is likely to be seen (in hindsight by mainstream money managers) as the greatest technical breakout in the history of markets. An April peak is likely to mark the end of the breakout move, and a classic pullback to the neckline of the immense base pattern should unfold from there.
- Junior mine stock investors may soon find themselves not just on cloud nine but on cloud nine bagger… with that kind of performance being the norm for most of their stocks!
- Junior mine stock investing isn’t for everyone, especially with size, but as this gargantuan gold bull era rollout continues, these miners look set to outperform everything!
- As noted, the rise in the volume of the juniors over the past two years signalled that the seniors were also set to soar.
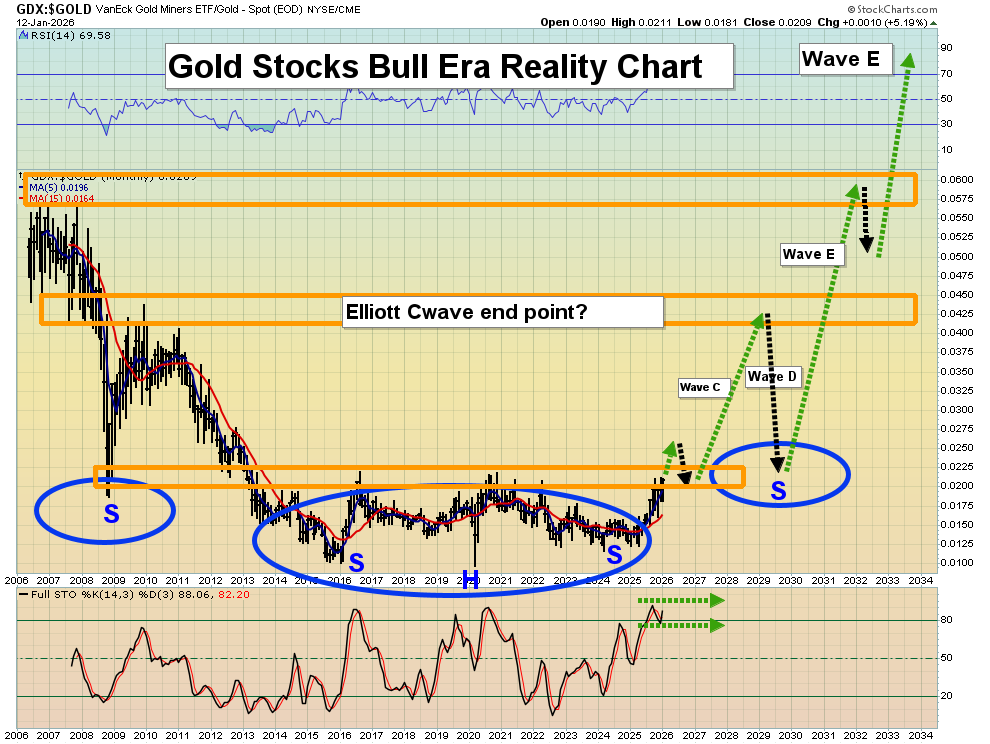
- For a look at those, via the GDX ETF, please click here now. Click to enlarge. Priced against gold, GDX sports the same fabulous inverse H&S pattern as the CDNX does against fiat, and after a breakout and rally, an April peak also looks likely to mark an intermediate-term pause in the action.
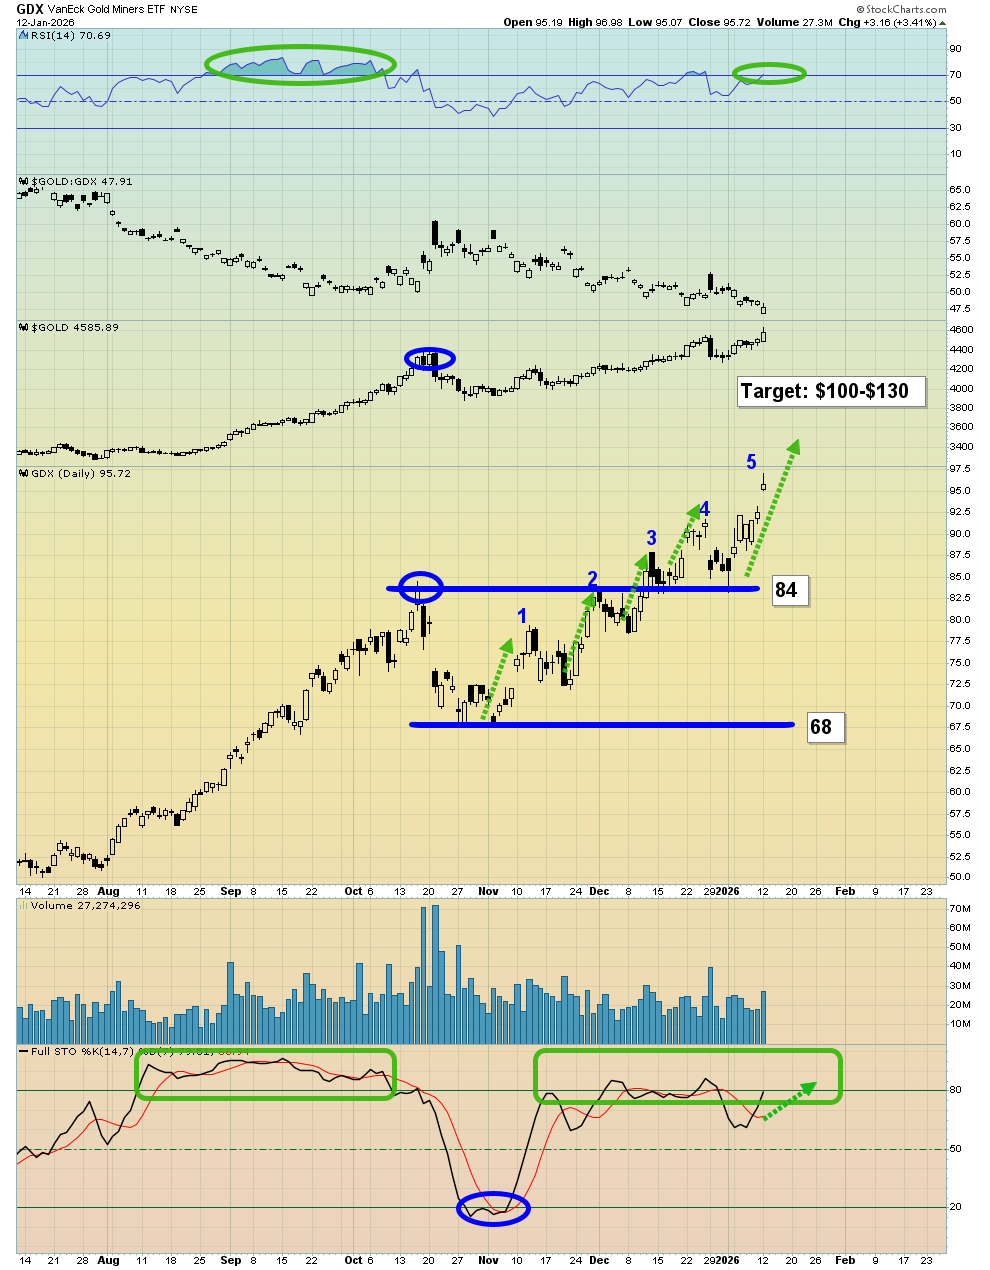
- Please click here now. Click to enlarge this GDX daily chart. While the round number of $100 is significant, the price action suggests that any pause before April is likely to be shallow.
- It’s likely that GDX doesn’t reach an intermediate-term peak until it rises to $120-$130, turning the $100 zone into a potential floor and launchpad… for a surge to $200 and more!
Thanks!
Cheers
St
About the author
