
- As another day of the 2021-2025 war cycle begins, the world’s gold and commodity market bugs are in great shape, but what about the fiat, crypto, real estate, and stock market bugs
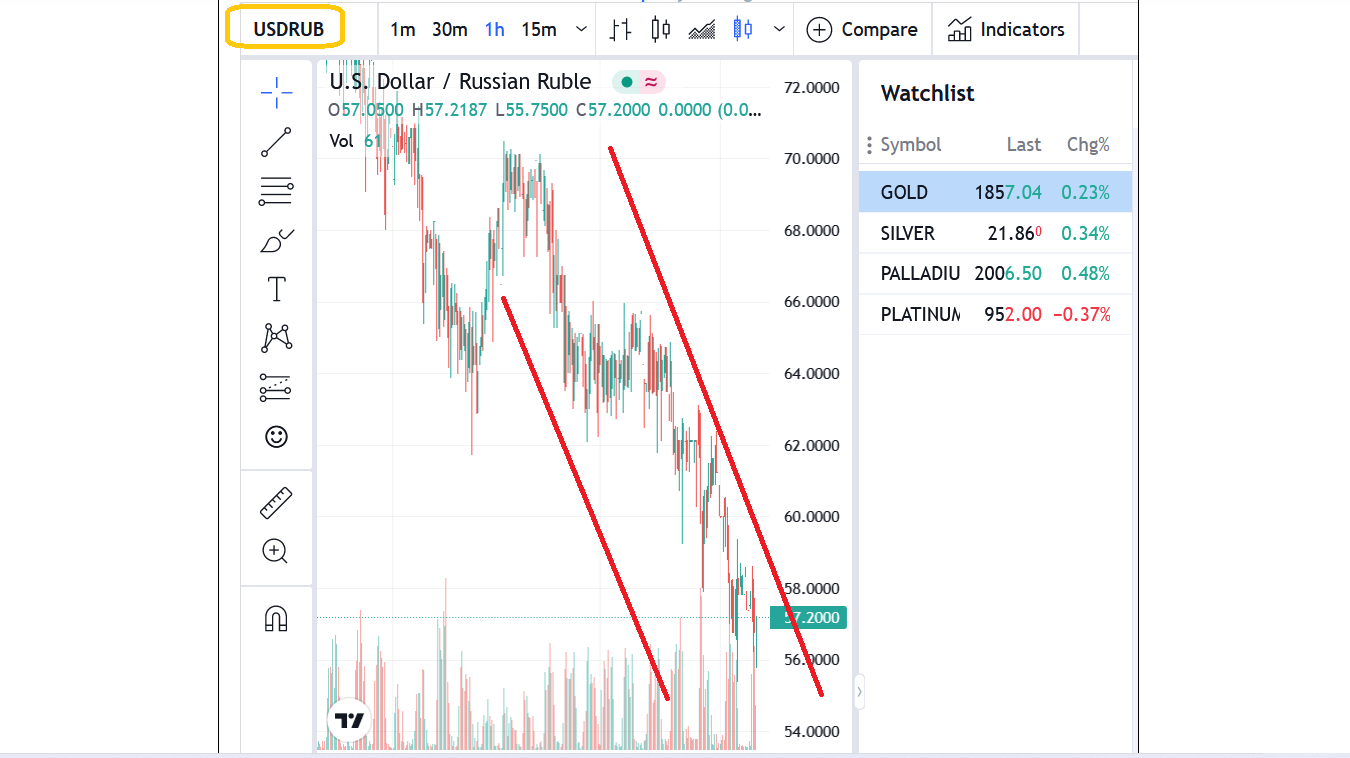
 Click to enlarge what looks like a death chart for the dollar versus the ruble.
 - Western governments promised to essentially wipe the ruble off the map… and the opposite has occurred.
- They wanted to impoverish Russian citizens to the point of starvation and civil war, and instead hundreds of millions of innocent citizens outside of Russia now face that risk of starvation. It’s another huge loss for the vile meddlers, but they refuse to surrender. All they care about is getting more debt-funded bombs into Ukraine while billing the potential mass starvation event as, “a magnificent fight for freedom”.
- Starving citizens want the freedom to eat, but the losers of the fiat money war do not care. For the meddlers, freedom is only what they say it is, and anyone who disagrees is labelled a “vessel of disinformation”.
- Real Estate? Well, interest rates have only just started to rise, and that created even more demand for a limited supply of homes. Potential buyers panic-bought in fear of even higher rates to come.
- It will take quite a few more central bank rate hikes before the housing market begins to really swoon.
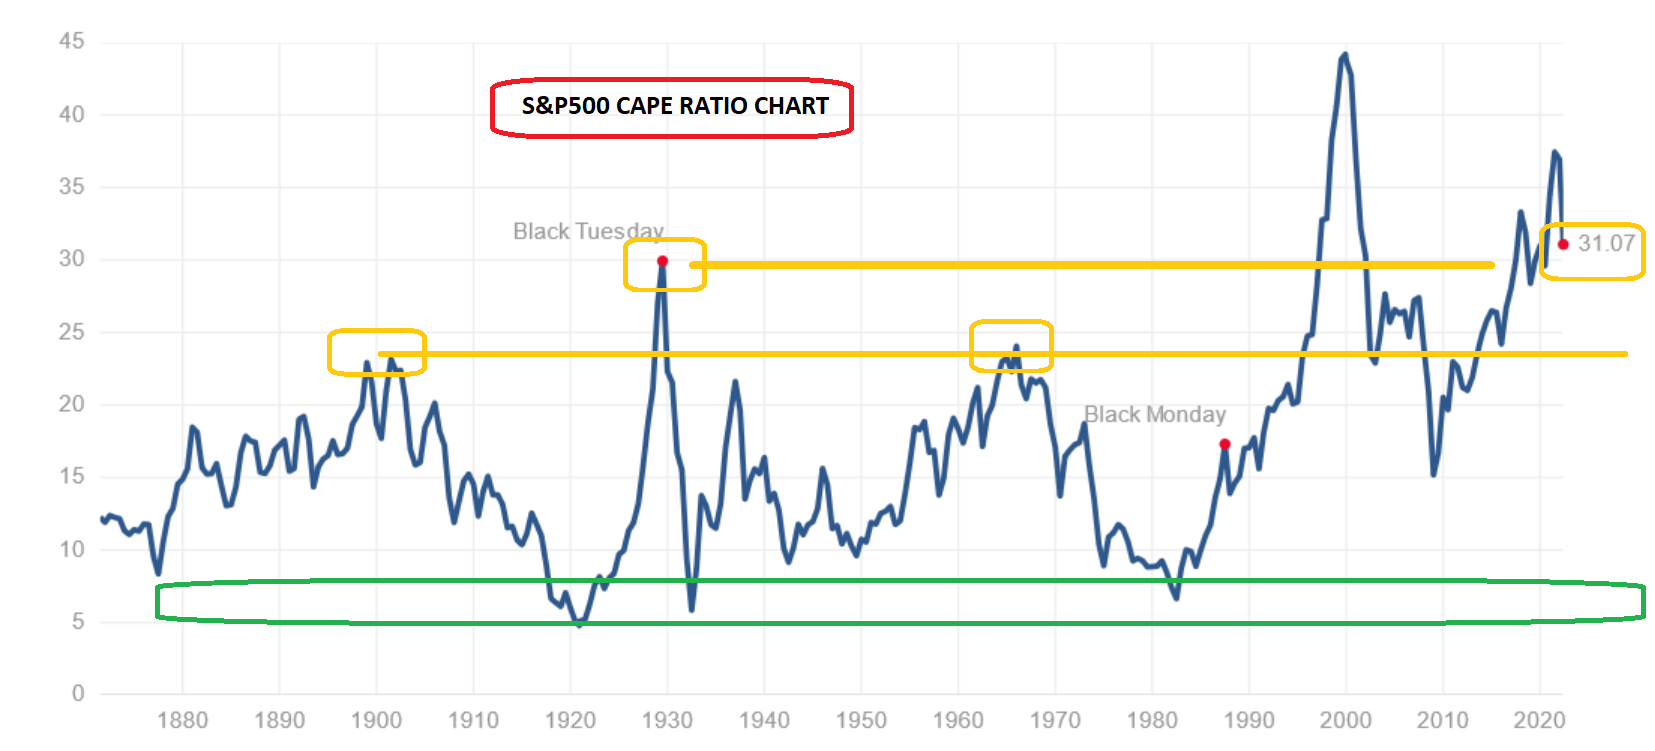
- The stock market? This is the market of most immediate concern. Please click here now. Double-click to enlarge this disturbing CAPE ratio chart for the S&P500. Great value for investors doesn’t appear until the CAPE ratio falls to the 10 area or lower.
- It sits at about 31 now, which is a ridiculous number that needs to be sold. Even at the lows of 2008, the CAPE ratio was still at 15, but central bank welfare in the form of QE for OTC derivative and stock market gamblers allowed the market to put in a significant low.
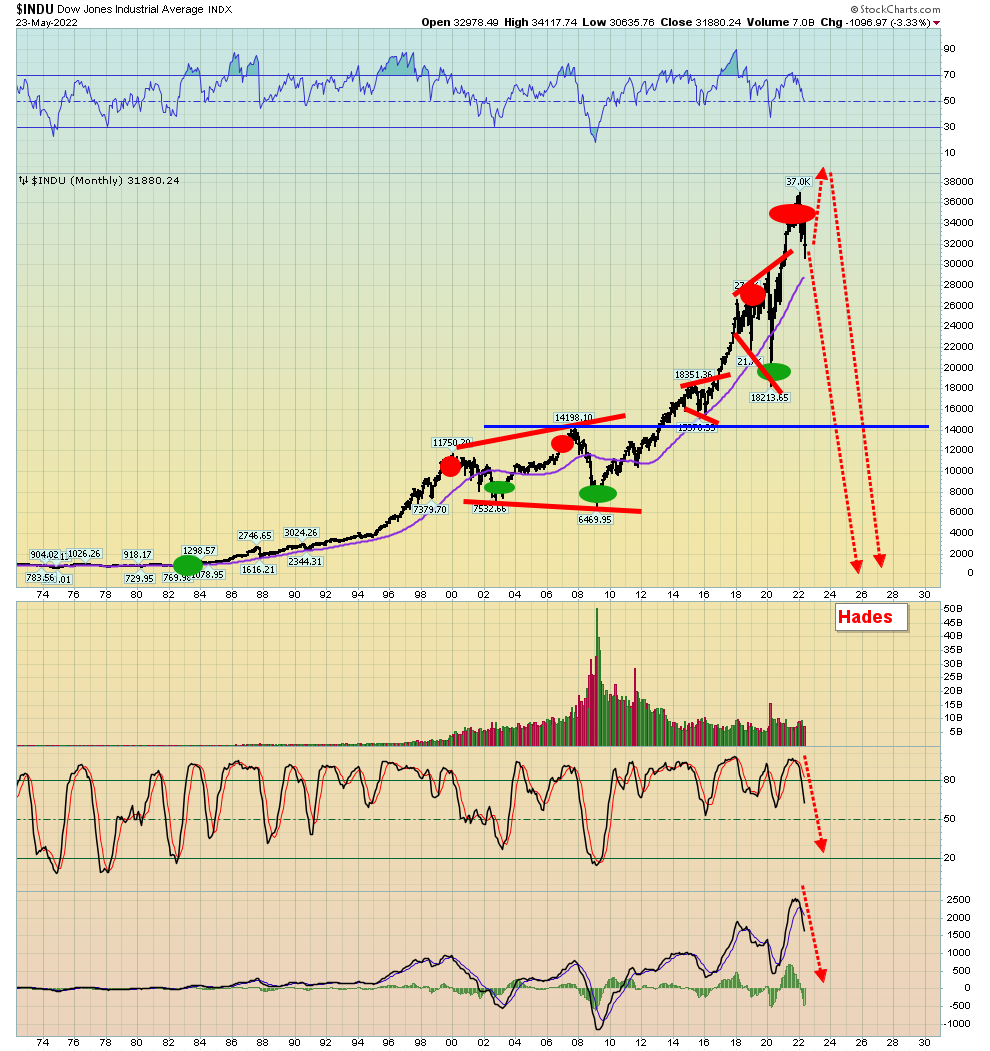
- Please click here now. Double-click to enlarge this Dow chart. There were rallies in the ridiculously overvalued markets of the past, and there will be rallies in this one.
- The US government may cut tariff taxes on some Chinese products and that could give the failed price chasers the stock market rally they are demanding, but I’ll dare to suggest they will use the rally to buy even more positions rather than selling out of the market.
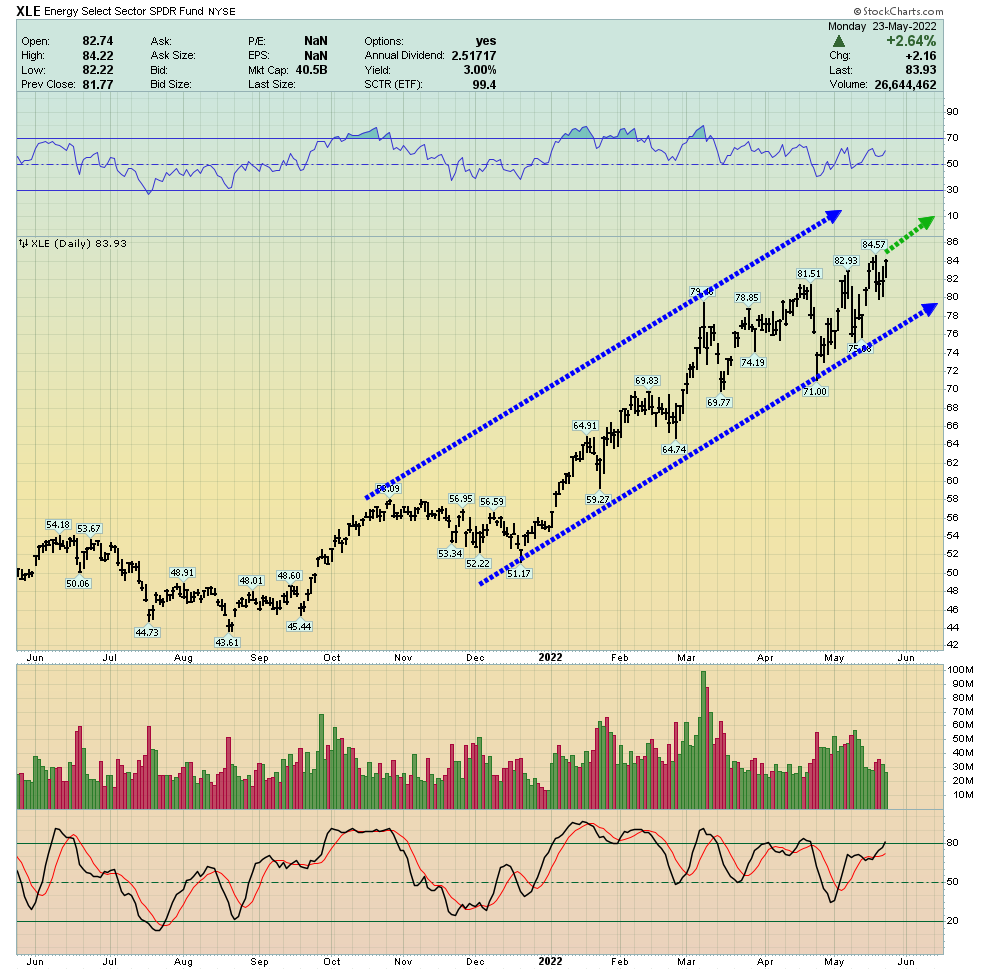
- Please click here now. Double-click to enlarge this oil stocks ETF chart. Investors who are focused on commodities like oil and gas rather than tech sector “hotties”… they look good…
- And are poised to look even better in the stagflation and war-oriented years ahead. Dips in oil and gas stocks need to be bought!
- Crypto? Please click here now. Double-click to enlarge this bitcoin “buy zones of champions” chart. Most gold bugs missed the bitcoin surge to $60,000 and others failed to follow me and sell into that key area.
- Investing is about the KISS (Keep it simple, superstar!) principle, regardless of whether it’s crypto, the stock market, or gold. To keep things simple, significant patience is required.
- Investing in gold is the simplest endeavour because gold is the ultimate currency. It’s the ultimate cash.
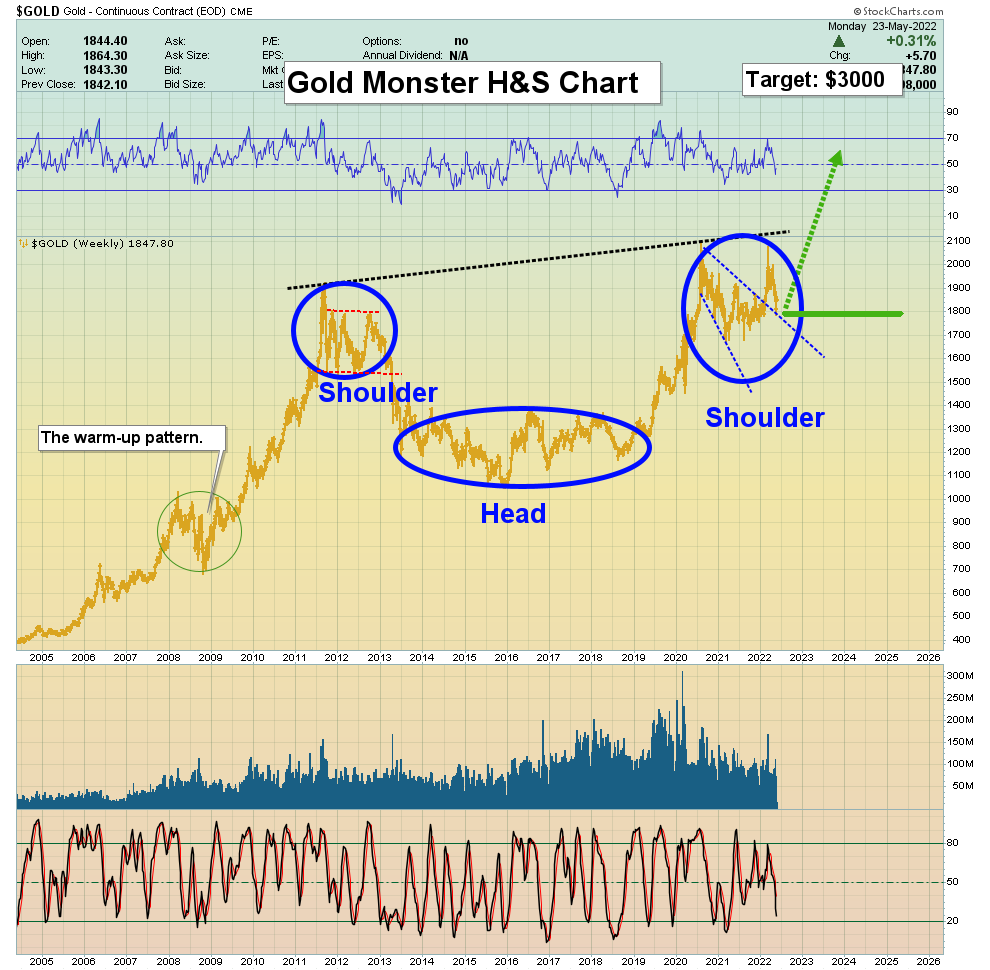
- Please click here now. Double-click to enlarge this big picture chart for gold. Out of control inflation in America (coming, but likely many years away), war, or a cut in the Indian gold import tax are the three big price drivers that could send gold to $3000, and war seems the most likely in the medium term.
- Please click here now. There are many areas of tension between governments, and what’s most disturbing is that the main approach is fast becoming… aggressive confrontation.
- As my “ode to the war cycle and stagflation”, I’m doing a special subscription offer this week (for both renewing and existing subscribers) for my flagship big picture newsletter that is already priced too low at just $199/yr. The offer is 15months for only $179, and I cover gold, the stock markets, commodities, energy and the senior mining stocks and ETFs with cyclical, fundamental, and technical analysis. Please click this link or send me an Email if you want the offer. Thanks!
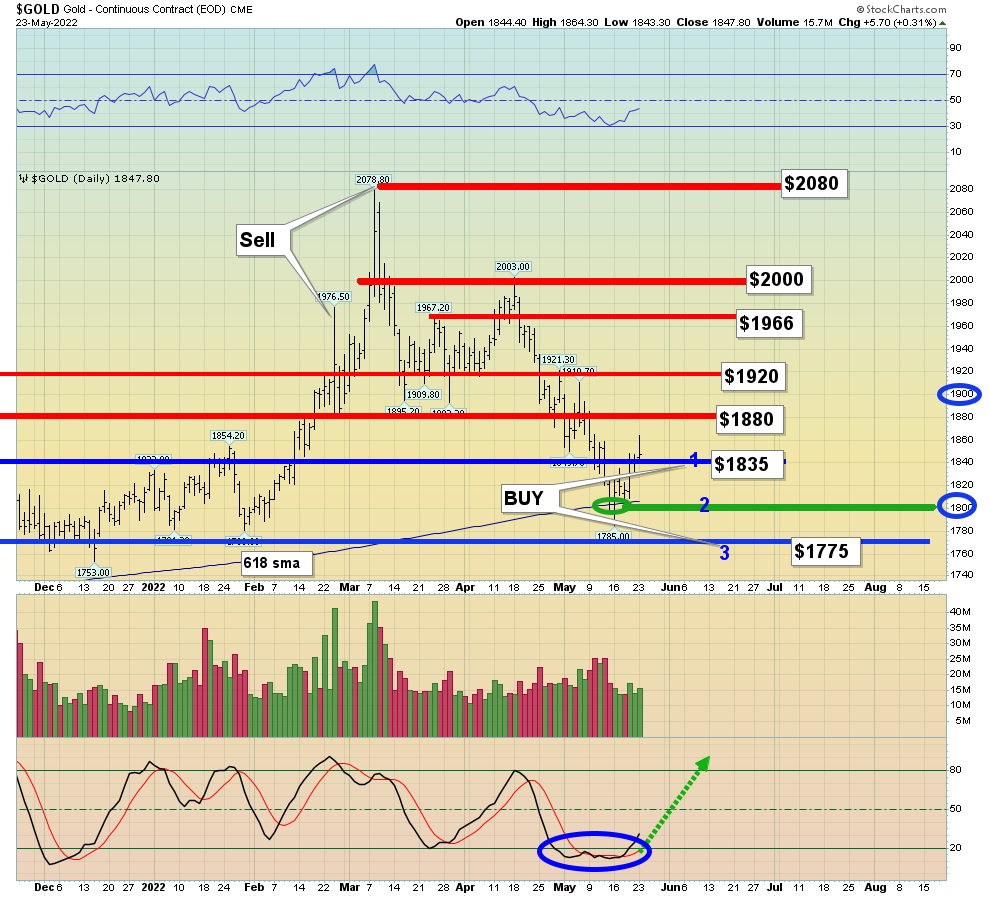
- To view the key zones for action in gold, and for silver and the miners, please click here now. Double-click to enlarge this gold market “zones for action” chart. The $1835, $1800, and $1775 price areas were key buy zones for investors, and $1835 and $1800 were hit.
- The red lines are resistance zones. Investors don’t have to sell at every red line or buy every blue or green one, but they should expect a pause in the trend there.
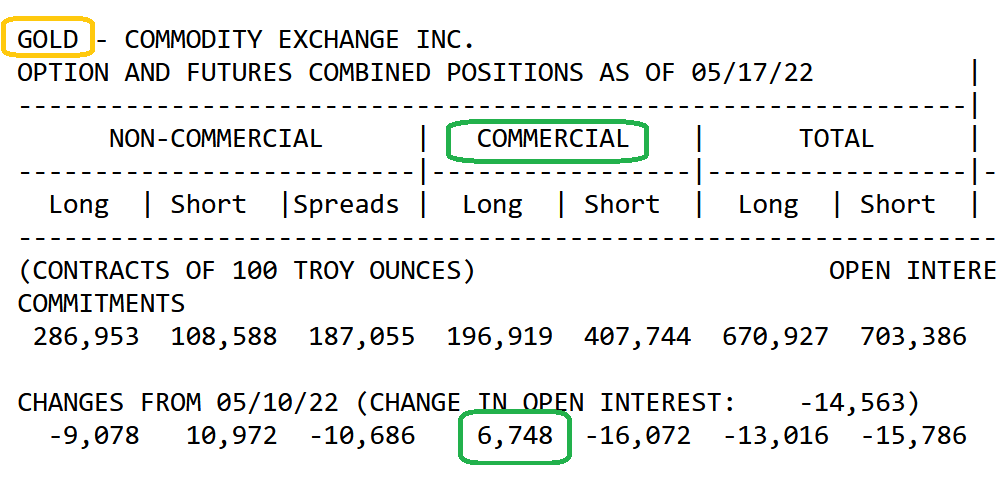
- Please click here now. My Indian jewellery dealers were enthusiastic at $1800, and the COT report appears to show some commercial buying around there too.
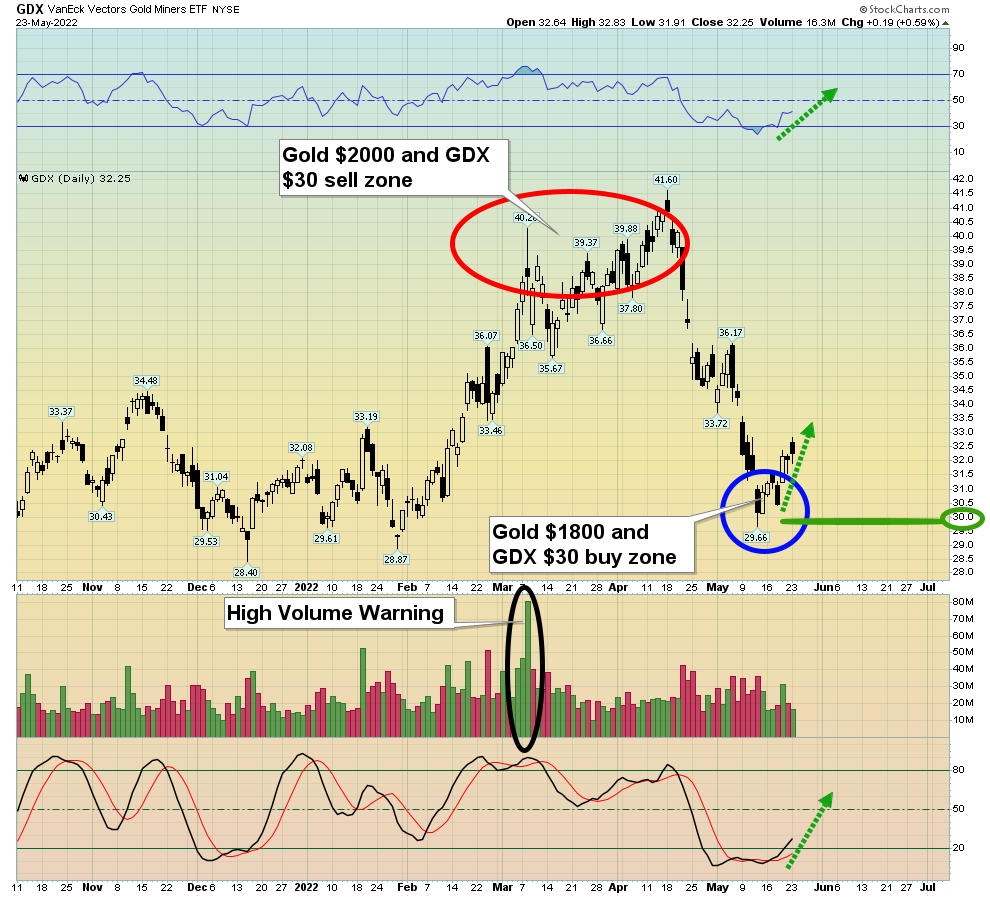
- Please click here now. Double click to enlarge this fabulous GDX “mining stock marines” chart. My focus here in the gold $1800 buy zone has been ETFs like GDX, GOAU, SIL, and XME.
- There’s no guarantee that the GDX $30 and gold $1800 price areas represent any kind of “final low” for the current reaction, although there are a lot of technical green shoots in play, including the COT reports, Indian dealer action, and investor sentiment. If there’s another big blast higher from here, and it looks likely, those “golden marines” who faced their fears and bought this zone will be ready to give themselves a very nice profit booking medal!
Thanks!
Cheers
St
About the author
