
- While it’s impossible for sane citizens to get pleasure from an event like the de facto “annihilation of America”, it is possible for hardcore gold bugs to retain most of their sanity… and get richer… as such an annihilation occurs.
- Please click here now. Various Fed speakers suggest US rates need to rise to 4% to curb inflation, Nouriel Roubini suggests 5% is required…
- And I’ve been adamant that regardless of what is supposedly required, rates are most likely headed to north of the 15% marker! It won’t happen in just a year or two, but over the next several decades.
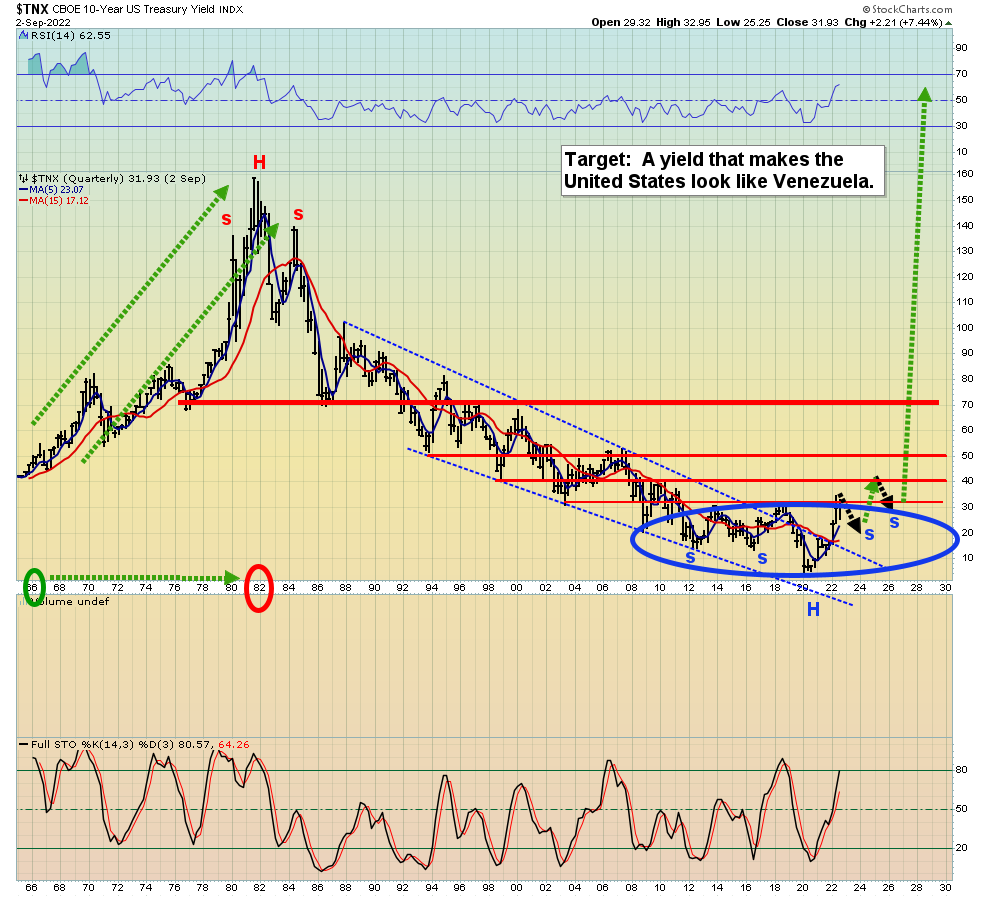 Click to enlarge this disturbing US Treasury yield chart. A base pattern is in play. The basing is likely to be completed in several years, perhaps with high right shoulders in the inverse H&S pattern.
 - As US madmen (also known as politicians) try to keep their debt-funded Ukraine war going and intensify their proxy wars with Russia and China, they will need to contain interest rates or the government will collapse, and likely do so with the nation in a horrifying state of civil war.
- Once the 2021-2025 war cycle ends, rates are likely to break upside from the base pattern, with America essentially left alone to fend for itself as former allies turn more aggressively towards China, India, and Russia.
- Please click here now. Double-click to enlarge this TBF bear bonds ETF chart. While the Fed may pause its rate hikes repeatedly in the coming years, it’s unlikely to do much cutting.
- Owning a fund like TBF is a way to bet on higher rates and inflation directly and it reduces gold-oriented portfolio volatility.
- Please click here now. Double-click to enlarge this monthly Dow chart. Is the H&S top realistic?
- Well, it’s one of many “tops of horror” scenarios for the Dow. Note the consistently overbought Stochastics oscillator from 2012 to 2015. Oscillators can stay overbought or oversold for a long time.
- Low rates and QE allowed the market to rise for years. High rates, QT, and war may see it fall for a similar amount of time.
- In 2021, I suggested the US stock market would enter a crash phase like 1929, and from there it would begin a stagflation-oriented quagmire, much like 1966-1982.
- Unfortunately, I now see lots of reasons why both the crash and the quagmire could become even more intense than I originally forecast.
- It’s important for investors to hold a lot of cash in a war cycle like the present one, because the big theme is… surprise.
- I provide daily updates 5-6 mornings a week just like this one in my flagship GU newsletter, and at just $199/yr, subscribers love the money-making analysis. I’m doing a special offer this week of just $179/15mths. If you can’t access the link, send me an email and I’ll get you onboard. Thanks!
- Gold? Please click here now. Double-click to enlarge his hourly chart. In the short-term, $1728, $1745, and $1765 are repelling the rallies. A close above $1728 would suggest the short-term trend has turned up.
- Next, please click here now. Double-click to enlarge this SGOL (physical gold ETF) daily chart. RSI and Stochastics both suggest gold is ready for a big rally from the double bottom pattern.
- Please click here now. Double-click to enlarge this all-important weekly chart for gold.
- The $1675 zone has been the launchpad for some very impressive rallies in silver and the miners.
- Unfortunately, that welcome mat may now be a bit worn out, so I’m urging investors to focus on $1610 and $1810 as the next “Space helmets on!” buy zones for the miners.
- Please click here now. Double-click to enlarge this long-term XAU chart. At first glance, it appears the miners are not a good long-term hold, as the XAU index is lower than it was almost 40 years ago!
- That’s true, but it’s also true that America and most of the Western world has been in a deflation cycle for all of that time.
- The miners are likely to do well as buy and hold investments over the next 20-30 years, but if bought at $1610 or $1810, the gains are likely to be “more than satisfactory” and can likely be sold within just one or two months after buying, at a large profit.
- Please click here now. Double-click to enlarge this SIL chart. A move above $27 is likely, should coincide with a move above $1810 for gold, and at that point the prices of $32 and $40 become realistic targets for eager investors!
Thanks!
Cheers
St
About the author
