
The US dollar banking system is coming to the end of its current and biggest bank run. Since the inception of the gold standard in 1879 in America, gold has continued to be the ultimate measure of its banking system.
On the gold chart, there are clear patterns that show how the current and previous US dollar bank runs are related. The bank run tends to end when the banking system is again fully capitalized, when measured in terms of gold.
Below is a long-term gold chart:
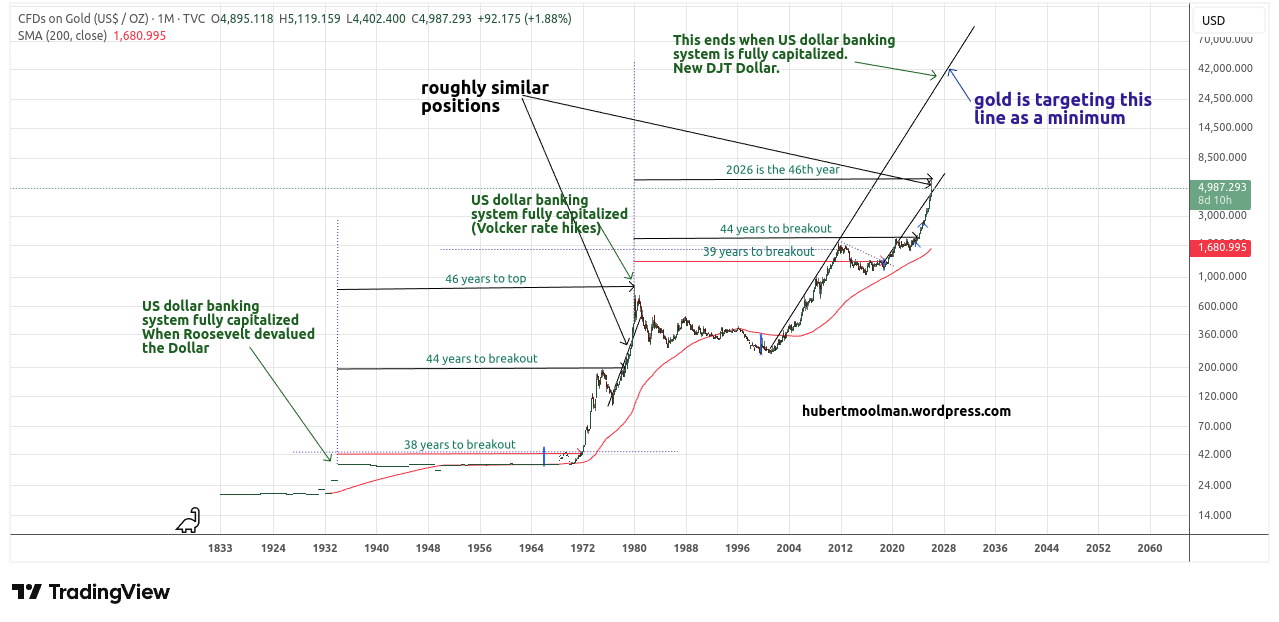
I have shown how the system was virtually fully capitalized in 1934 (see this post) after the US dollar was devalued. After many years of US dollar debasement since 1934, there was a massive bank run that ended in 1980, only when the US dollar banking system was again fully capitalized.
That end came about 46 years after the 1934 recapitalization, when gold hit $850 in 1980. The US dollar banking system again technically had a 100% gold backing based on the gold price.
After both the 1934 and 1980 recapitalizations of the US dollar banking system, the gold chart kept somewhat of a similar form, especially since about 44 years after the recapitalizations, gold made an important breakout (1978 and 2024).
In other words, since 2024, we have probably entered the final phase of the bank run, just like 1978 was the final phase that ended in 1980.
We are now in the 46th year since the 1980 recapitalization, and just like since the 1978 breakout, gold has been rising significantly since 2024. We don’t know if the bank run will end this year or if it will take a few more years.
However, we do know that it will likely end when gold has peaked, and the US dollar is significantly devalued, like it was in 1934 and 1980, which incidentally were at (or very near) significant bottoms in the Dollar Index (DXY).
Moreover, there will likely be a significant landmark event like the 1934 US dollar devaluation. It may end with a new US currency (the Trump dollar, maybe). It could originate internally, or it could be forced upon America from outside (foreign nations).
All of these have likely not happened yet.
The gold charts suggest that the price still has to rise significantly before we get to that phase. The target on the chart above is probably a minimum, provided that the current US dollar is still in existence when gold peaks.
More on this and this kind of analysis at my premium gold and silver blog or my Silver Long-term Fractal Analysis Report.
Warm regards
Hubert Moolman