
Gold's 72-day Cycle
As mentioned in my prior article, the recent correction phase for the Gold market came as a result of the 72-day cycle, which is one of the more dominant cycles that I track. This wave topped at the early-March highs, with Gold dropping nearly 300 points off that peak into the most recent low of 1791 (August, 2022 contract).
The chart below shows our 72-day cycle in the Gold market:
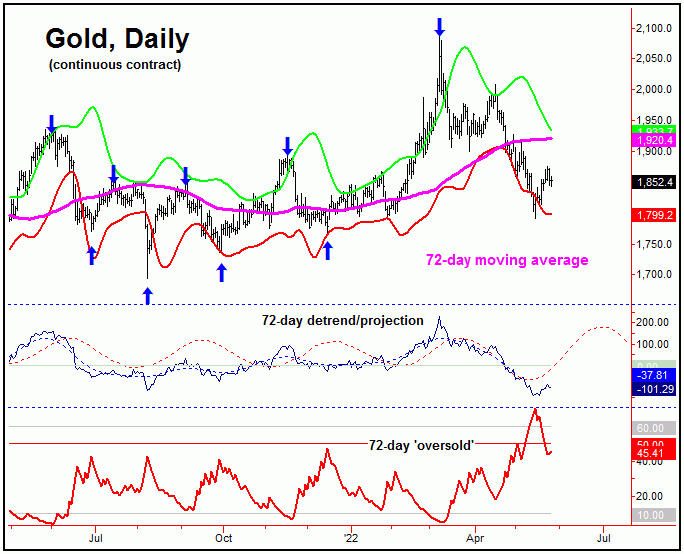
From the comments made in my last article, our 72-day 'oversold' indicator spiked above its upper reference line back on May 9th of this year. Having said that, the pattern that we were looking for was for Gold to see a daily close below our lower 72-day cycle band indicator. The combination of these two signals - when seen on the same trading day - is normally a strong message that Gold is hammering out a key bottom.
In terms of patterns, our analysis called for the recent decline phase to end up as a countertrend affair - against the December, 2021 trough of 1766.40. That is, when a cycle - such as this 72-day wave - is able to take out its prior peak made on the last upward phase, the probabilities are 80% that the next downward phase of the cycle will hold above its prior trough.
Adding to the notes above, the March, 2022 peak was higher than the prior top for this wave, which was registered back in mid-November, 2021. Thus, our assumption was that the most recent decline phase of the 72-day cycle would end up as countertrend, against, the December 2021 low - the prior 72-day trough.
With the above said and noted, the next rally of significance is expected to come from this 72-day cycle, which may already be in force. In terms of price, the overall assessment is looking for a push back to the 72-day moving average in the coming days/weeks - though a tag of our upper 72-day cycle band would be ideal.
Going further with the above, the average price rallies with this 72-day cycle wave - when forming a 'higher-low' - have been around 14%, lasting an average of 39 trading days before topping, thus giving us some added information on what we might expect.
What I have found is that, when any cycle is able to hold above its prior low (i.e., a countertrend correction), then the probabilities are also about 80% that the next upward phase of that same cycle will take out the prior peak - which, here, is the 2089 swing top from back in early-March.
Having said the above, the further the downward/correction phase of the 72-day cycle, the lower the odds of making higher highs on the next upward phase. In other words, a 50-61% retracement (a normal event) has very good odds of making higher highs on the next swing up, while a larger retracement (i.e., 78% or more) has marginally lower odds of doing the same.
With the above said and noted, the alternate for the 3-8 week picture would be this: the upward phase of the 72-day cycle sees only a hard secondary high, one that falls short of taking out the March peak of 2089. This is a now a possibility, simply due to the strength of the recent decline - which retraced over 90% of the prior upward phase of this cycle.
Gold's Short-Term Picture
With the potential for a 72-day cycle upward phase to be in force, traders should be looking to buy any short-term corrections with Gold. The next one of these should come from our smallest-tracked wave, the 10-day cycle component, which is shown on the chart below:
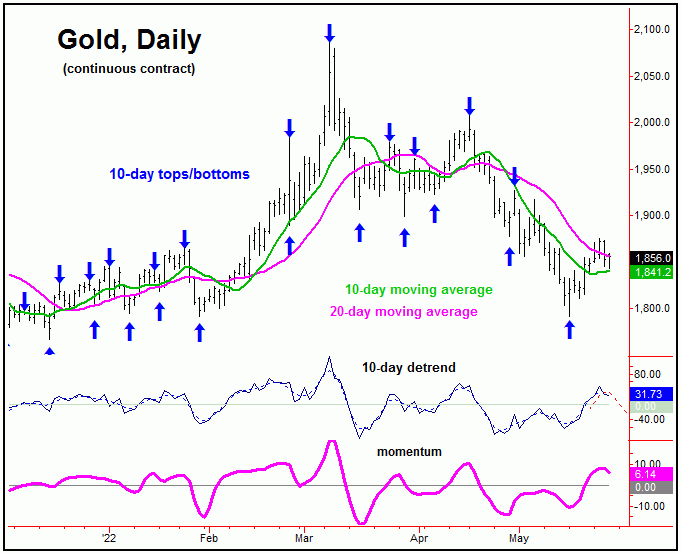
The last low for our 10-day cycle in Gold was registered back on May 16th, thus putting this wave at some 8 trading days along. With that, a normal retracement is back to the 10-day moving average or lower, with the patterns favoring any move down to end up as a countertrend affair - ideally due to the position of the larger 72-day cycle.
Stepping back slightly, if the downward phase of the 10-day wave does end up as the expected countertrend affair, then our ideal path is looking for continued strength in the days/weeks ahead, once again coming from the upward phase of the bigger 72-day cycle. Should that play out as expected, we will be keeping a close eye on the action from technicals, in the anticipation of a bigger peak forming with Gold into what looks to be the Summer of this year. Stay tuned.
Jim Curry
The Gold Wave Trader
http://goldwavetrader.com/
http://cyclewave.homestead.com/
Jim Curry is the editor and publisher of The Gold Wave Trader and Market Turns advisories - each of which specializes in the use of cyclic and statistical analysis to time the Gold and U.S. stock markets. He is also the author of several trading-related e-books, and can be reached at the URL's above.
About the author


Chief Analyst & Editor
Jim Curry became involved in the markets as an investor in 1988. In the early 1990's he stumbled upon a book/methodology that would change the way he looked at the markets forever. That book was J.M. Hurst's the Profit Magic of Stock Transaction Timing. Hurst's concepts seemed to make perfect sense to Jim, and he has spent the years since coming up with his own cycle/technical analysis methodology.
In 1998 Jim put his cyclic methods to the test by entering the Etrade national options-trading competition, twice (his only two entries ever into the competition). In the first contest he finished in the top 10 out of over 150,000 entrants; in the second entry into the same contest, he just narrowly missed finishing in first place - over quadrupling a $100,000 account in the contest's short time span.
What you are seeing when you view my market reports is a collection of over 30-years of experience in both numeric analysis and spectral methods - and in actually trading the methodology for myself and for the subscribers of my Gold Wave Trader (which covers Gold) and Market Turns (covering U.S. stocks) reports.
You can visit his websites at: http://goldwavetrader.com/ and http://cyclewave.homestead.com/